


The purpose of this work is to study the influence of the immersion temperature and the treatment time of the ion exchange of soda-lime glass in molten KNO3 bath on its mechanical properties, and in particular the erosion resistance using Sahara sand and alumina abrasives. EDS analysis showed that the depth of penetration of K+ into glass increases as temperature and treatment time increase. The effect of ion exchange temperature and time on mechanical reinforcement was studied by micro-indentation, scratch test, wear and erosion test. All of these mechanical properties are improved after ion exchange treatments; erosion and wear resistance behave the same, either by using natural abrasives such as Sahara sand or by using an aggressive abrasive as alumina grits.
The increase in the ion exchange time induces an increase in Vickers hardness of about 15–40% compared to annealed glass. Samples processed at 520°C for a short period of 2h show better mechanical properties compared to samples processed at 480°C for longer times. In this case, the sample has a higher surface density which made the glass in compression not only because the potassium ions occupy the ionic substitution spaces but also the free spaces.
El propósito de este trabajo es estudiar la influencia de la temperatura y el tiempo de inmersión en un baño de nitrato de potasio (KNO3) fundido en el comportamiento mecánico de un vidrio sodocálcico.
La extensión del proceso de intercambio iónico se ha caracterizado mediante microanálisis por dispersión de energías de rayos X (EDX). El comportamiento mecánico, por su parte, se ha caracterizado mediante ensayos de microindentación Vickers y de resistencia al rayado, al desgaste y a la erosión. Como partículas abrasivas se han utilizado arena del Sahara y alúmina, obteniendo resultados equivalentes.
La penetración del K en el material durante la inmersión aumenta con la temperatura y el tiempo de tratamiento. La incorporación del K da lugar a un aumento de la densidad superficial, generándose una matriz vítrea en compresión. El aumento del tiempo del intercambio iónico se traduce en un incremento de 15-40% de la micro-dureza Vickers. Las muestras tratadas a 520°C durante tiempos cortos (2 h) presentan mejores propiedades mecánicas que las tratadas a 480°C durante tiempos más largos.
En este caso, la muestra tiene una mayor densidad superficial lo que hizo que la celosía de vidrio se comprimiera no solo porque los iones de potasio ocupan los espacios de sustitución iónica, sino también los espacios libres.
Mechanical reinforcement of glass has always been a concern and has been explored in two different directions: by modifying the composition of the bulk glass itself or by reinforcing the surface of the glass [1,2]. Surface reinforcement can be obtained by inducing surface compression stresses either by thermal treatment (tempering) or by thermochemical ion-exchange [3,4]. This subsequent reinforcement technique has the advantage of maintaining the high optical transmission and perfect flatness for window glazing after the reinforcement treatment [5,6].
The ion-exchange technique involves immersing oxide glasses in a bath of molten alkaline salt, at a temperature below the glass softening point [7,8]. During the immersion time, ion diffusion occurs and the alkaline ions of the glass which are fairly close to the surface are substituted by those of the molten salt [9]. Not only temperature and time influence the efficiency of the ion-exchange, but other factors are also involved: the exchanging pair of ions [10], the glass composition [11], the interface interaction between glass and salt [12] and the influence of temperature on viscous relaxation [13]. This technique allows the strengthening of almost any glass article geometry [10] and even of thin glass sections down to 100μm [14].
Furthermore, there is no measurable optical distortion [2,15] and no risk of viscous deformation of the treated product [16] because the treatment is usually carried out at temperatures below the glass transition.
Many monovalent cations have been used in glass surface ion-exchange (Li+, K+, Rb+, Cs+, Ag+, Cu+) [17–22]. In the case of K+, the glass is immersed in the molten alkaline salt KNO3[23–25]. Since the penetrating K+ ions are larger (r=13.3nm) than the Na+ ions (r=9.8nm) simultaneously leaving the glass, compressive stress is generated at the surface of the glass [9,26–30]. René [9] mentioned the use of an electric field or ultrasonic waves as an aid in the ion exchange process. The electric field can be a source of an additional driving force for the inter-diffusion of mobile ions [31–33] in order to increase the residual stress even with short-term treatment [34], but the unbalanced residual stress and therefore asymmetric which could cause deformation of the samples [2].
Ion-exchange times have been experimented that vary from a few minutes [37–39] to several hours [1,30,40] and even a hundred hours [35] with the result being more immersion time the higher the concentrations of the penetrated ions [27]. Besides, the higher the ion-exchange temperature, the shorter the time is required to develop a compressive layer [36]. The inter-diffusion in the glass is limited by the higher temperature of the treatment, due to the possibility of stress relaxation [15]. However, Dubeil [35] who has treated the glass below and above the glass transition temperature (Tg) observed that the degree of exchange is lower after a treatment above the Tg. When the ion-exchange is carried out at temperatures approaching Tg, the stresses generated by the process are quickly released or removed by the viscous flow of the glass [36].
Several works using ion-exchange process have been carried out with the main objective of improving the mechanical properties of glass for more advanced applications [41] such as military and civil applications [42–44]where excellent mechanical and transmission properties are essential [14]. The mechanical behaviour of soda-lime float glass treated by ion exchange treatment under different conditions of temperature and treatment time was tested by scratch test and flexural strength measurements [45], bending test with the coaxial double ring [46], impact strength [47], Vickers hardness [48] and sand erosion test [49]. However, as several works have studied and reported that the strengthening of glass by ion exchange has been beneficial, it remains necessary to determine the best conditions of ion exchange (essentially immersion time and temperature) to obtain optimized mechanical properties and to test the reinforced glass under the most extreme conditions of use.
Therefore, in this work, commercial soda-lime float glass produced in Algeria was subjected to ion exchange in KNO3 salt bath for different treatment times and temperatures. The treated samples were then characterized in terms of potassium penetration profile and mechanical properties to assess the influence of chemical tempering terms on the final performance of the glass eroded by the blasting of sand and alumina abrasives.
The main objective of this work is to propose a method of reinforcing glass articles used in the Saharan region and subjected to sandstorms.
Experimental partSample preparationThe material used for the present work is a float sheet soda-lime silicate glass with a nominal thickness of 3mm as available in the market. Its composition measured by BRUKER S8 TIGER X-Ray Fluorescence) is given in Table 1.
50mm×15mm×3mm glass samples were cut from the glass sheet and were cleaned with acetone before use to remove any type of contaminants. The glass transition temperature (Tg) of the soda-lime silicate glass was determined to be 573°C from the differential thermal analysis curve carried out in alumina cells using anSDT-Q600 DSC-TGA instrument.
First, all glass specimens were annealed at 0.92Tg=530°C for 1h [50,51] to remove residual stresses in the glass. The annealed glass specimens were then immersed into molten KNO3 (purity>99.9%) at two temperatures 480°C or 520°C for different durations (2, 5, 20, 30, 40, 50 and 60h). These temperatures were chosen as close as possible to the glass transition temperature to favour the cation diffusion without stress relaxation. At the end of the ion-exchange process, the glass specimens were removed from the furnace, cooled, and carefully cleaned with deionized water to remove any adhering salt [52].
CharacterizationDetermination of ion profileQualitative analysis of the sample surfaces was carried out by scanning electron microscopy (Jeol JCM-6000 SEM) equipped with an X-ray dispersive analyser (EDX). The glass specimens were cut and embedded in resin for section analysis, once polished and metallized. The concentration profiles of sodium and potassium ions from the outer surface to a depth of approximately 200μm were recorded.
Determination of physico-mechanical propertiesThe micro hardness of the annealed and treated glasses was measured by Vickers micro hardness tester (ZHU 0.2 Zwick/Rolle), using 1N load and 30s dwell time. Five indentations were printed on each treated surface per sample.
Vickers hardness (Hv) was calculated using Eq. [1] according to [53]:
where F is the applied load and d the indent diagonal length.
The compressive stresses σc induced during the ion-exchange process are calculated using the Marshall and Lawn formula [54]:
with P is the applied load, C is the half-length of the radial cracks of the treated glass, C0 is the half-length of the radial cracks of the annealed glass, KIC is the toughness (measured from the cracks generated during the Hv indentation) and m is a constant.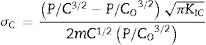
The density was calculated from the chemical composition of the surface layers of the samples by Sasek and Ledererova's method [55].
Determination of wear propertiesThe scratch resistance was measured with CSM Instruments Combi Tester equipment. This technique consists of moving a sample under a Rockwell diamond indenter (diameter 100μm). The linear scratches drawn on the specimen with progressively increasing load were recorded and further characterized with Bruker NPFlex Optical Profilometer at 25× and 50× magnifications. The surface of the glass samples and the indenter were cleaned with acetone before testing. Before the sample is scratched for analysis, a prescan is performed at a very low load so that the profile of the sample is taken into account in the scratch measurement [56]. Five scratches per sample were carried out at load raised to 10N with a constant speed of 5.22mm/min over a scratch length of 5mm [57]. All the measurements were carried out at room temperature in dry air. Critical load is defined as the load at the onset of surface failure revealed when cracks or damage cause visual detectable damage.
Friction tests were carried out with Pin on Disc Tribotechnic equipment (Tribotester V4.4 software). The tribological characterization was carried out in a dry medium at room temperature. A normal and constant load of 5N was applied by a 6mm diameter alumina ball on the sample while the radius of the circular path was set at 6mm and the speed of rotation at 12mm/s. Under these conditions, the test lasted 9min and the ball travelled a total distance of 7m. The sample and the alumina ball were cleaned in acetone and air dried before the wear test [58]. The tangential force on the ball is measured during the test and makes it possible to evaluate the coefficient of friction for the set conditions.
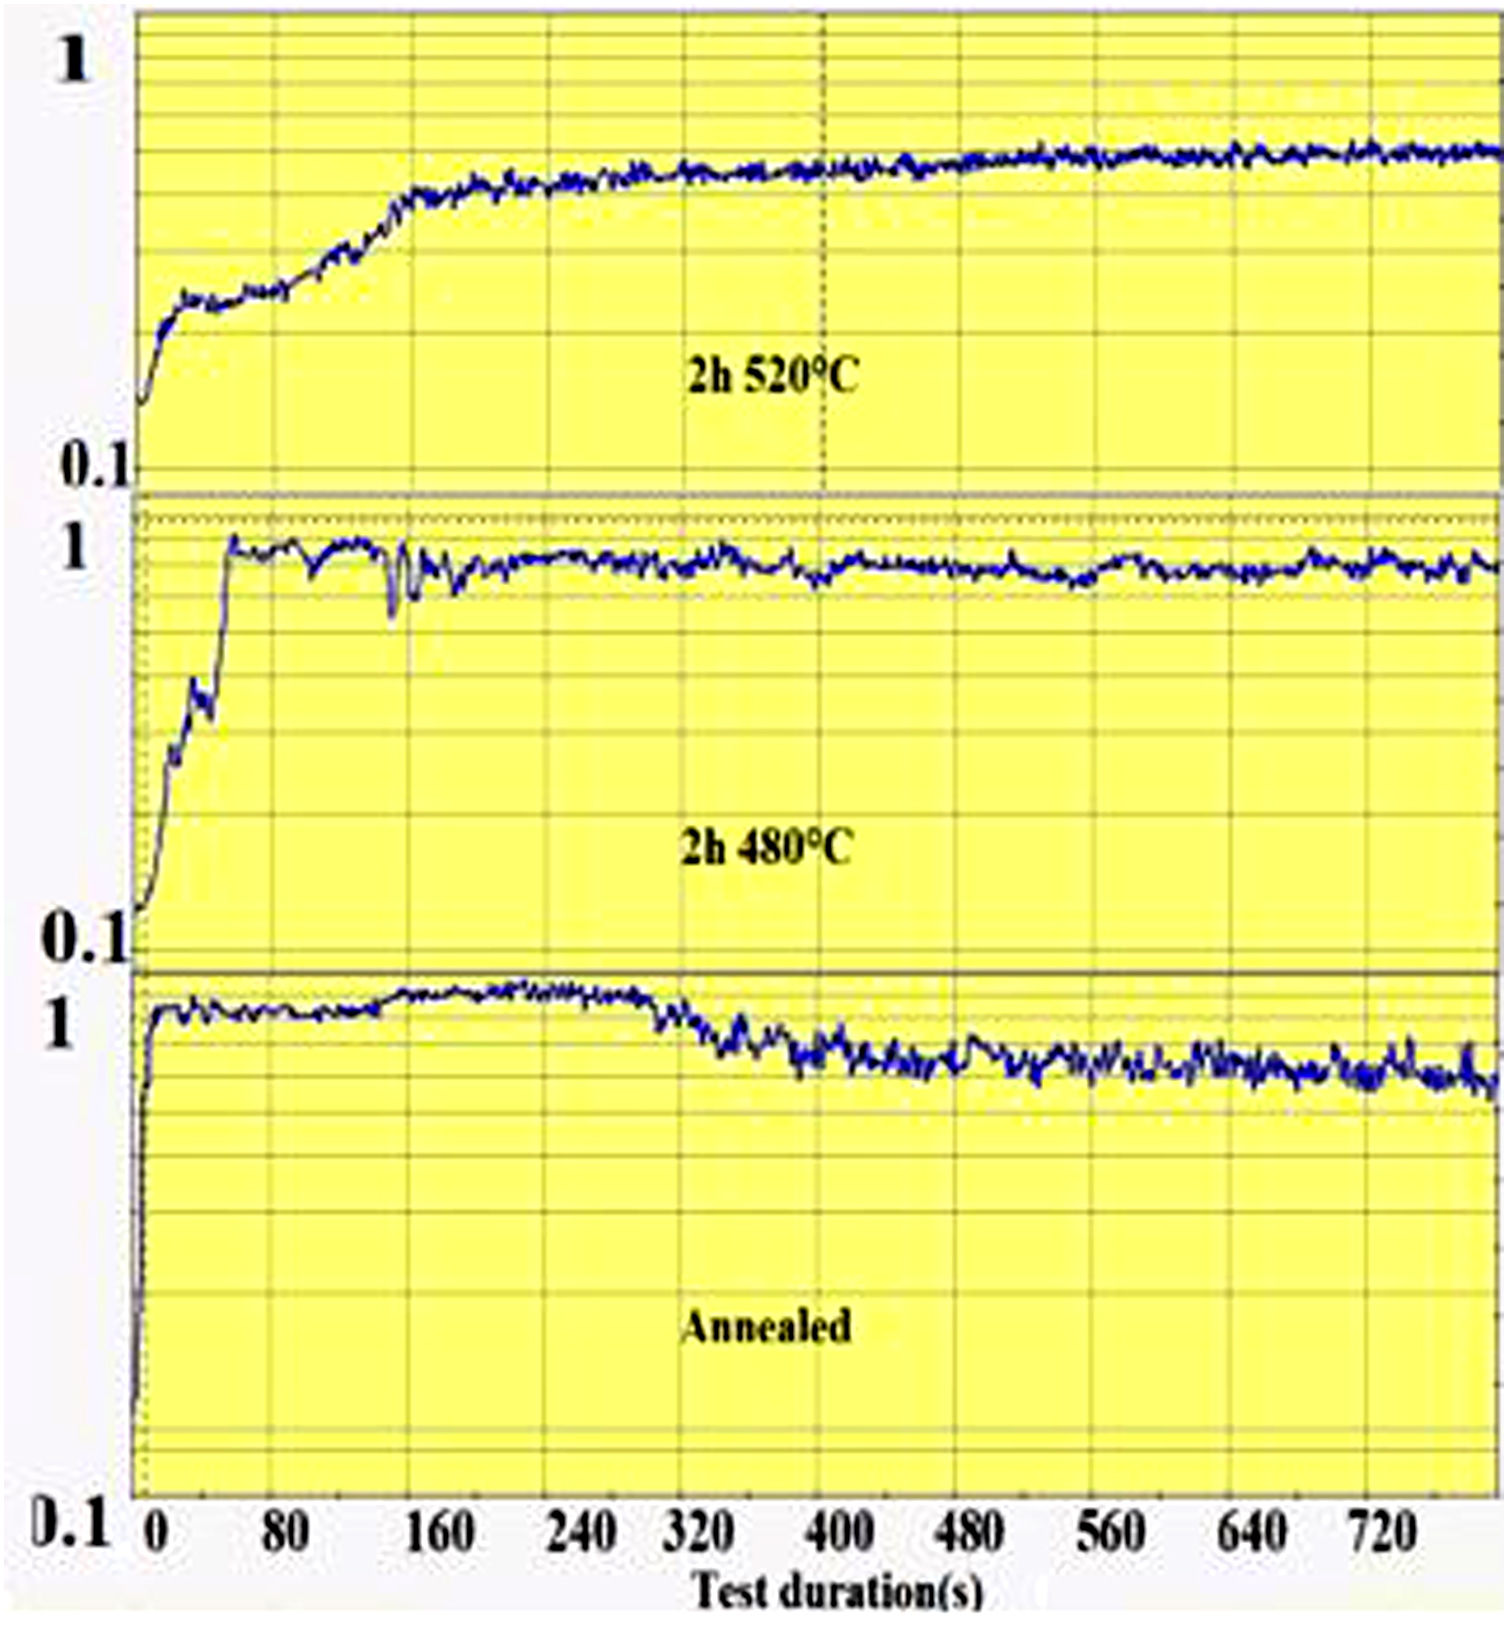
The wear groove on the glass surface was scanned with the Keyence Rugosimeter 3D confocal microscope VK-X250 and the extracted worn section was calculated from the groove section profiles. The friction coefficient is recorded during the pin-on-disc test as a function of time as shown in Fig. 1. From this recording, the time required for the wear of the ion exchange layer was considered as the time when the coefficient of friction of the spindle on chemically reinforced glass reaches the value of the coefficient of friction of annealed glass. It is then that the superficial potassium enriched layer has been completely worn out (on the “DOP” penetration depth) and the pin reaches the bulk glass below.

The resistance to erosion was evaluated by sandblasting to characterize the effect of the chemical treatment of the glass on the wear resistance. Each sample was impacted by 50g of abrasive particles accelerated in a stream of air through a nozzle 14mm in diameter. An extreme impact angle of 90° was used for these tests, which corresponds to a sample surface perpendicular to the flow of abrasive particles [59]. The distance between the nozzle and the sample (L) was set to 15mm. The average velocity of natural particles in Sahara sandstorms is 16m/s [60], but in order to obtain sufficient wear to be measured, the flow velocity of the particles has been set at 30m/s for tests as already mentioned in other glass sandblasting studies [61,62].
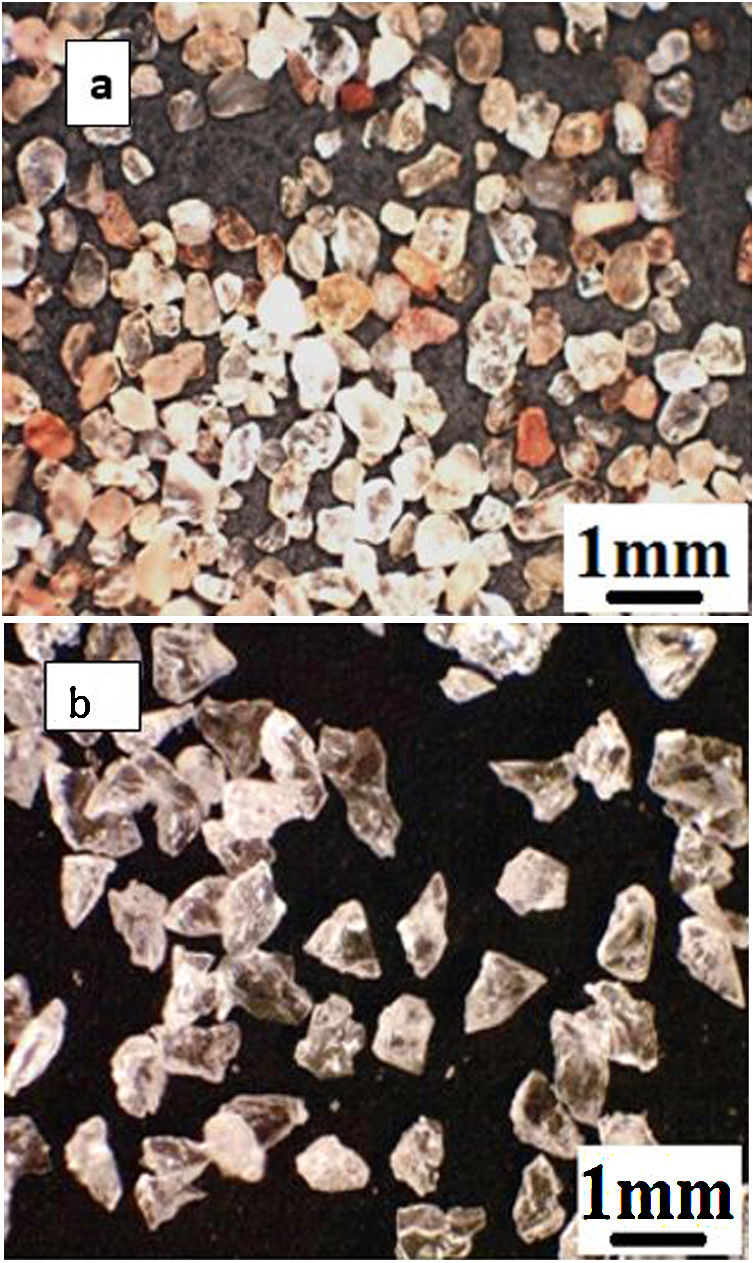
As the first abrasive medium, natural sand from the Ouargla region (southern Algeria) was used. This sand particle size measured by Malvern Mastersizer 2000 is in the range 75–425μm and its sphericity measured by the SYMPATEC QICPIC granulo-morphometry equipment is in the range 0.78–0.90. The sand particles have irregular shapes more round than angular and of different colours (Fig. 2a) with the average composition given in Table 2. It consists of 94.33% of silica in the form of quartz. The average Vickers hardness (less than 0.5N) of Ouargla sand is between 10.1 and 12.5GPa.
 and commercial alumina grits (b).")
As a second abrasive medium, the refined corundum abrasive F-41000 KOROX-BEGO composed of 99.6% aluminium oxide was used; its size is of the order of 140 to 700μm, with an average particle size of 306μm. Its sphericity is between 0.65 and 0.85. Compared to Ouargla sand particles, the edges of the corundum particles are sharper (Fig. 2b). The average Vickers hardness of alumina grains (less than 0.5N) is between 14.3 and 15.6GPa, higher than that of sand.
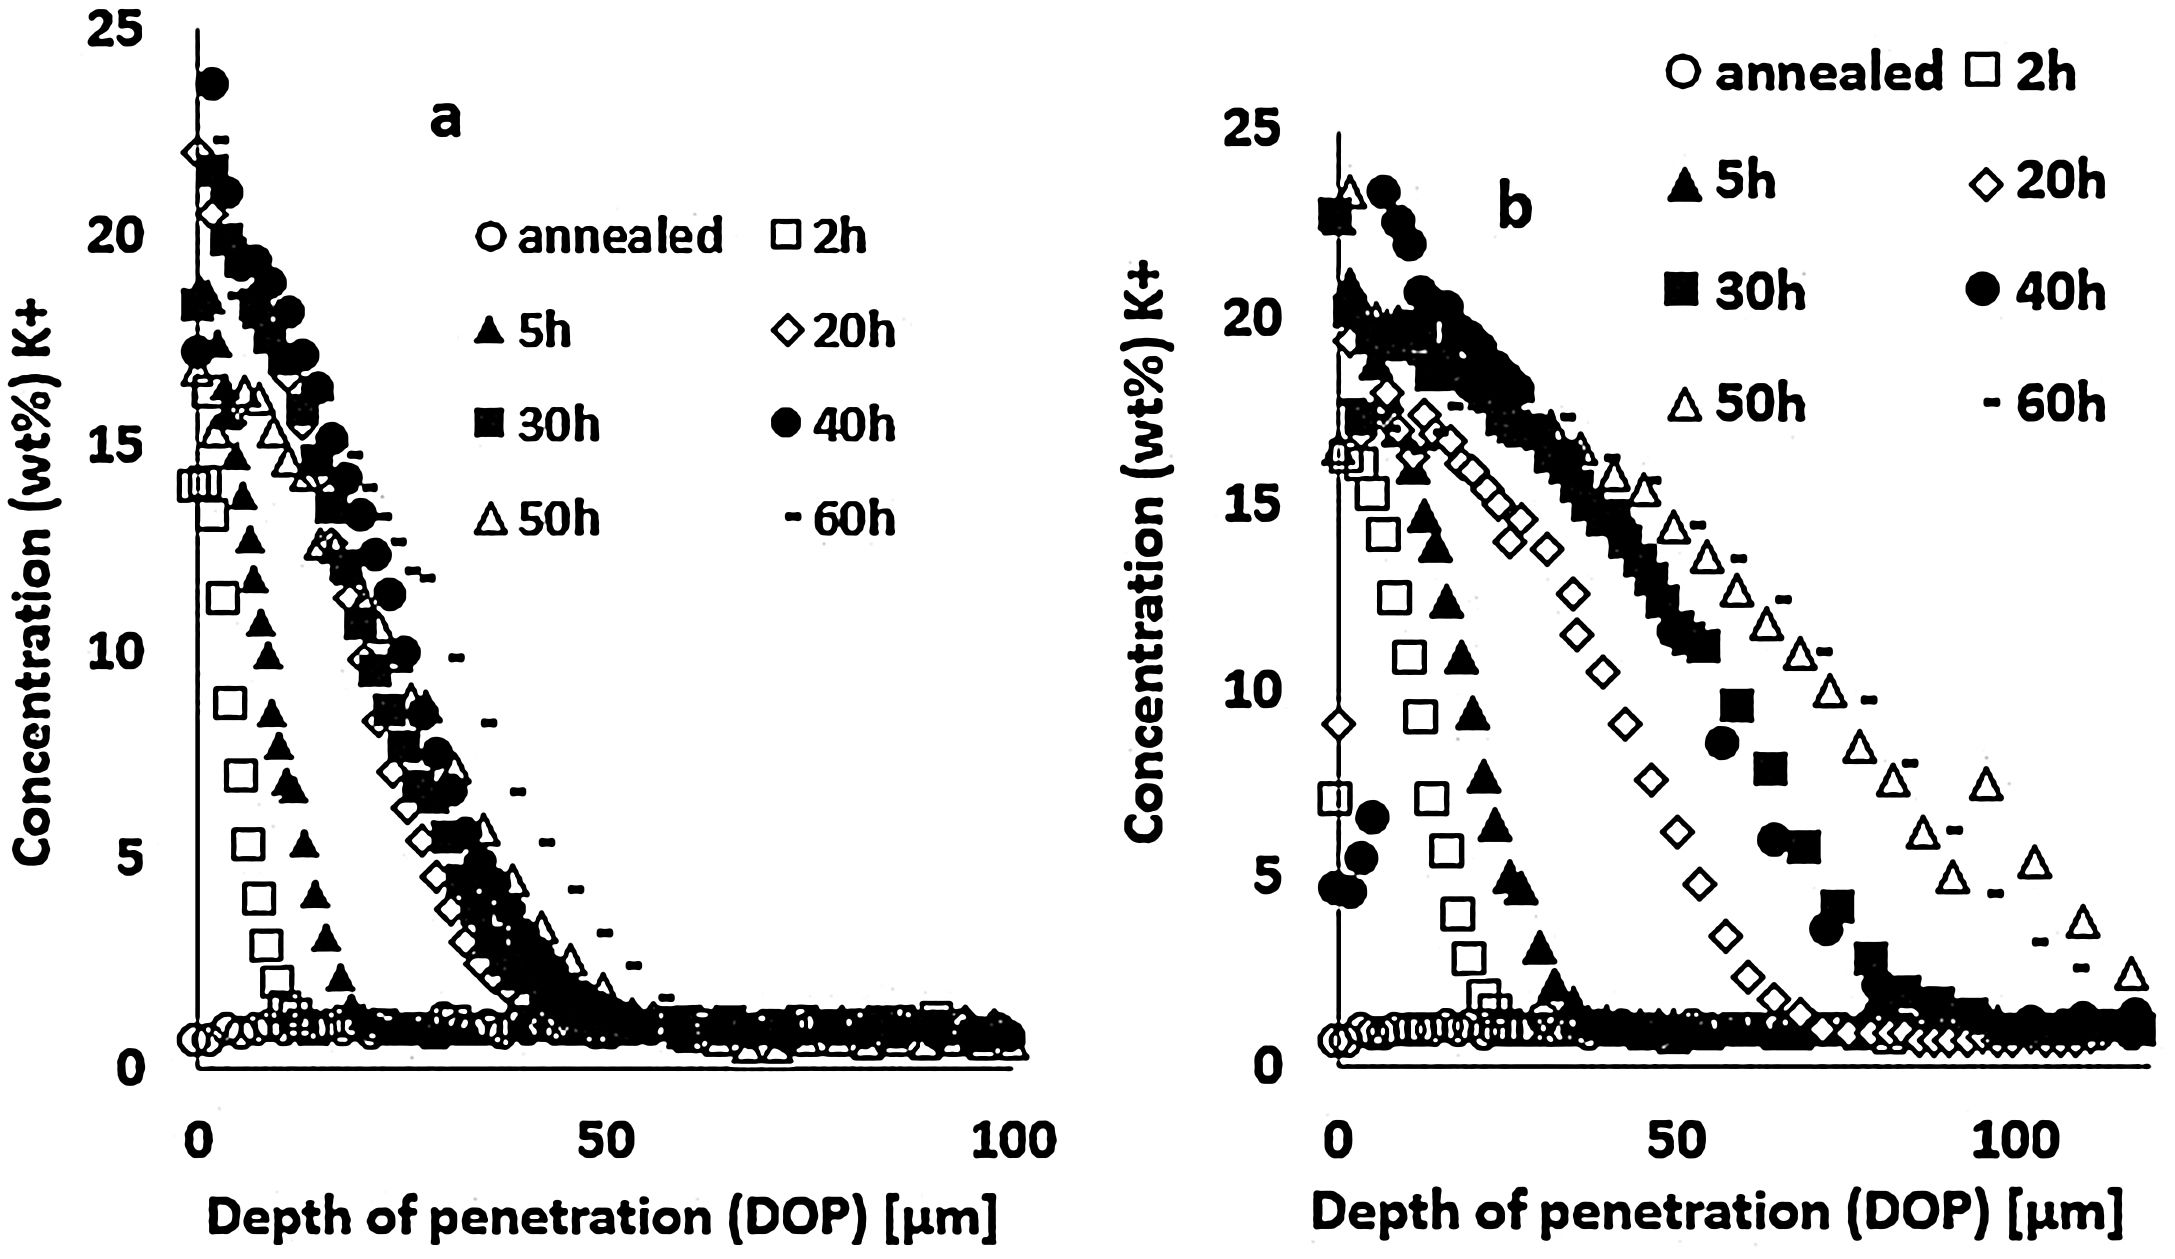
Results and discussionIon-exchange depth profileThe concentration profiles of K+ ions obtained by EDX on the float glass air-side of ion-exchanged specimens treated at 480°C or 520°C for different immersion times in the potassium bath are presented in Fig. 3. The K+ surface concentration of ion-exchanged glasses increases with the immersion time. The depth of penetration (DOP) varies between 10 and 50μm with immersion time for the treatment at 480°C (Fig. 3a), while it varies between 25 and110μm for 520°C (Fig. 3b). The K+ concentration is maximum at or just below the surface and decreases towards the depth. The extension of the ion-exchange depth in the glass is quite doubled at 520°C compared to 480°C temperature treatment.
 480°C and (b) 520°C.")
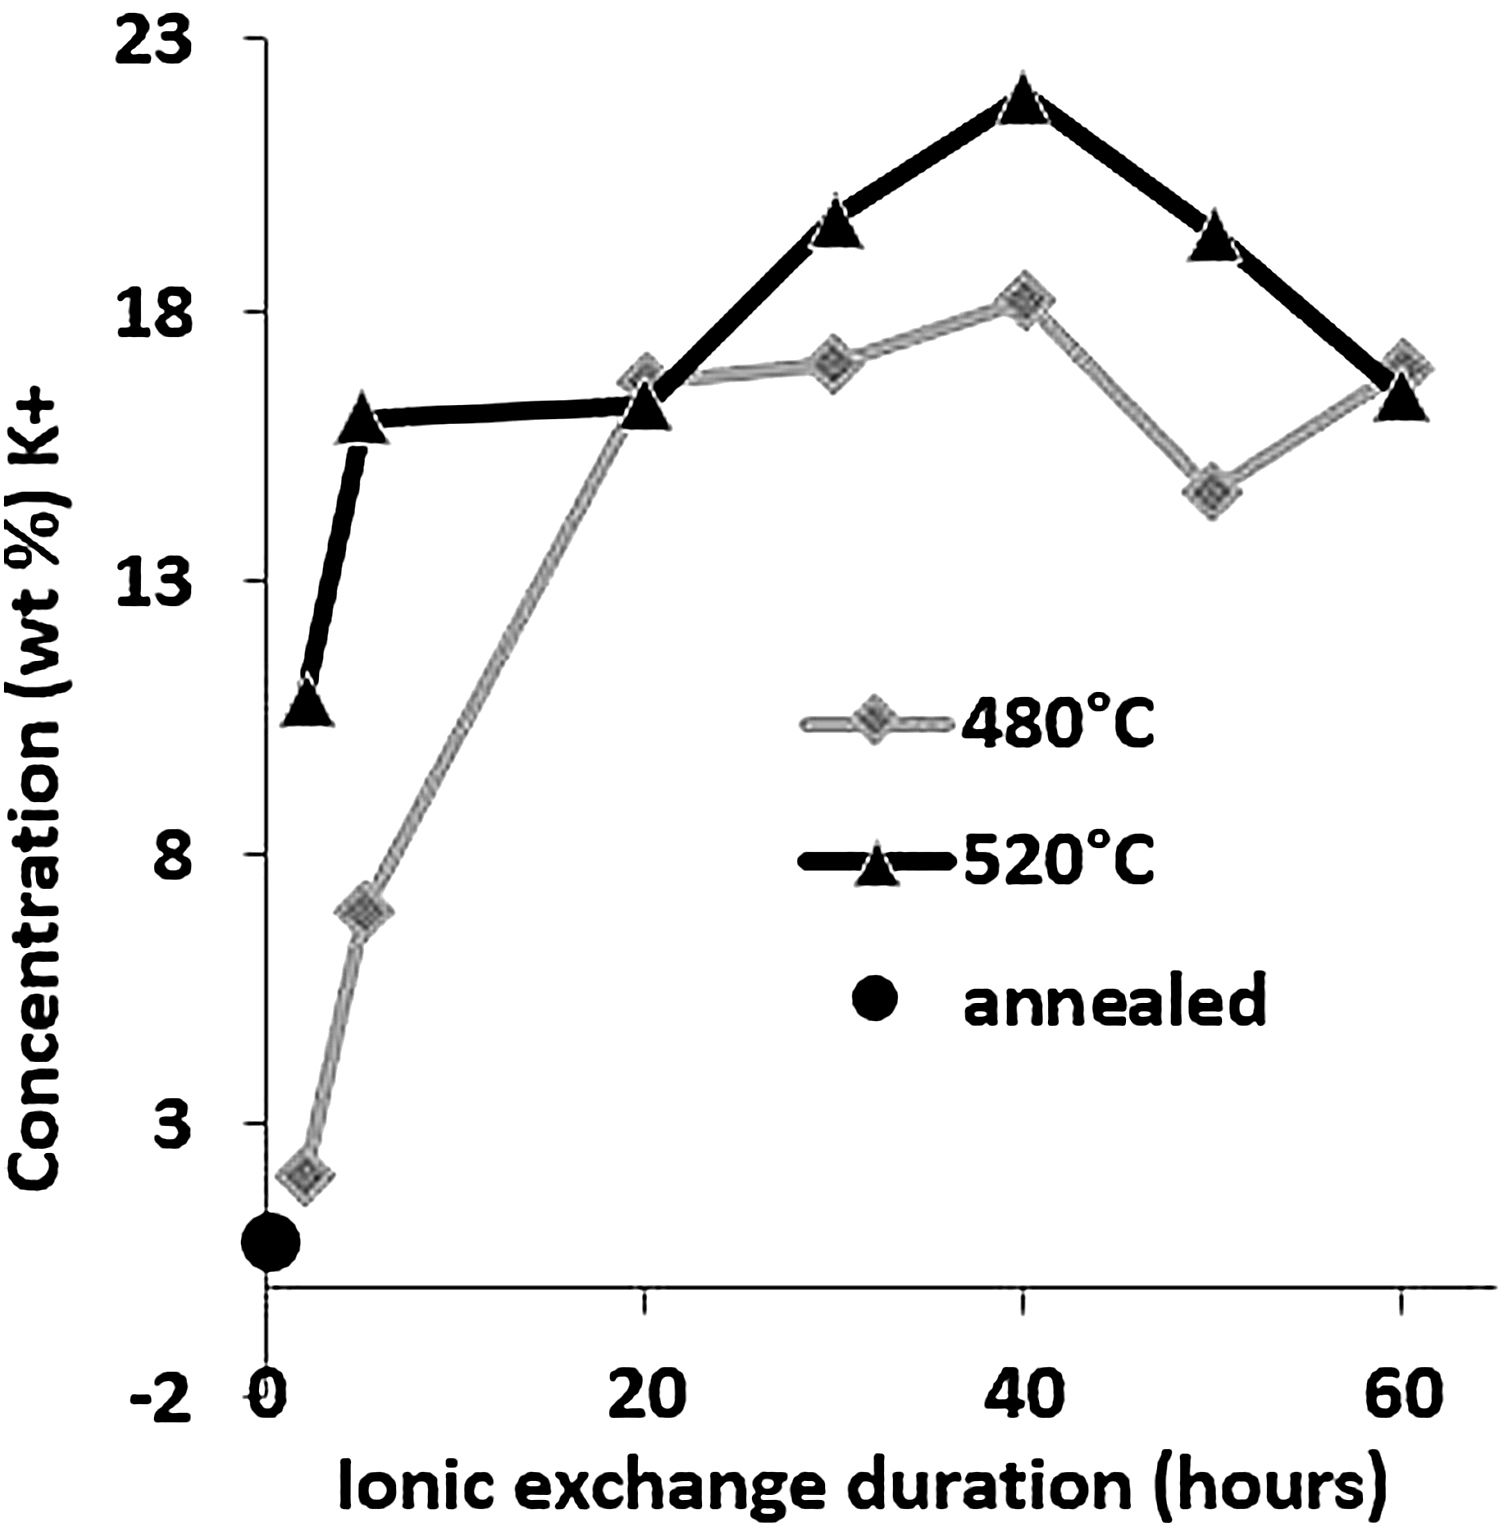
Large variations in the potassium concentration at the surface are observed, in part due to treatment, as surface washing after ion-exchange had to be more intensive on some samples to remove condensed salts of the glass surface. Therefore, the potassium concentration at 10μm below the surface is considered here as a more reliable process reference value. The K+ concentrations at a depth of 10μm are plotted versus the ionic exchange duration for the two treatment temperatures (Fig. 4). An increase in the K+ concentration was observed with the increase in the immersion time and temperature. For treatment at a temperature of 480°C, the K+ concentration increases up to 20h of immersion time, then it is kept constant. However, at 520°C, the K+ concentration increases to 40h and then decreases. For the samples treated at 520°C, the K+ concentration is almost twice that of samples treated at 480°C.

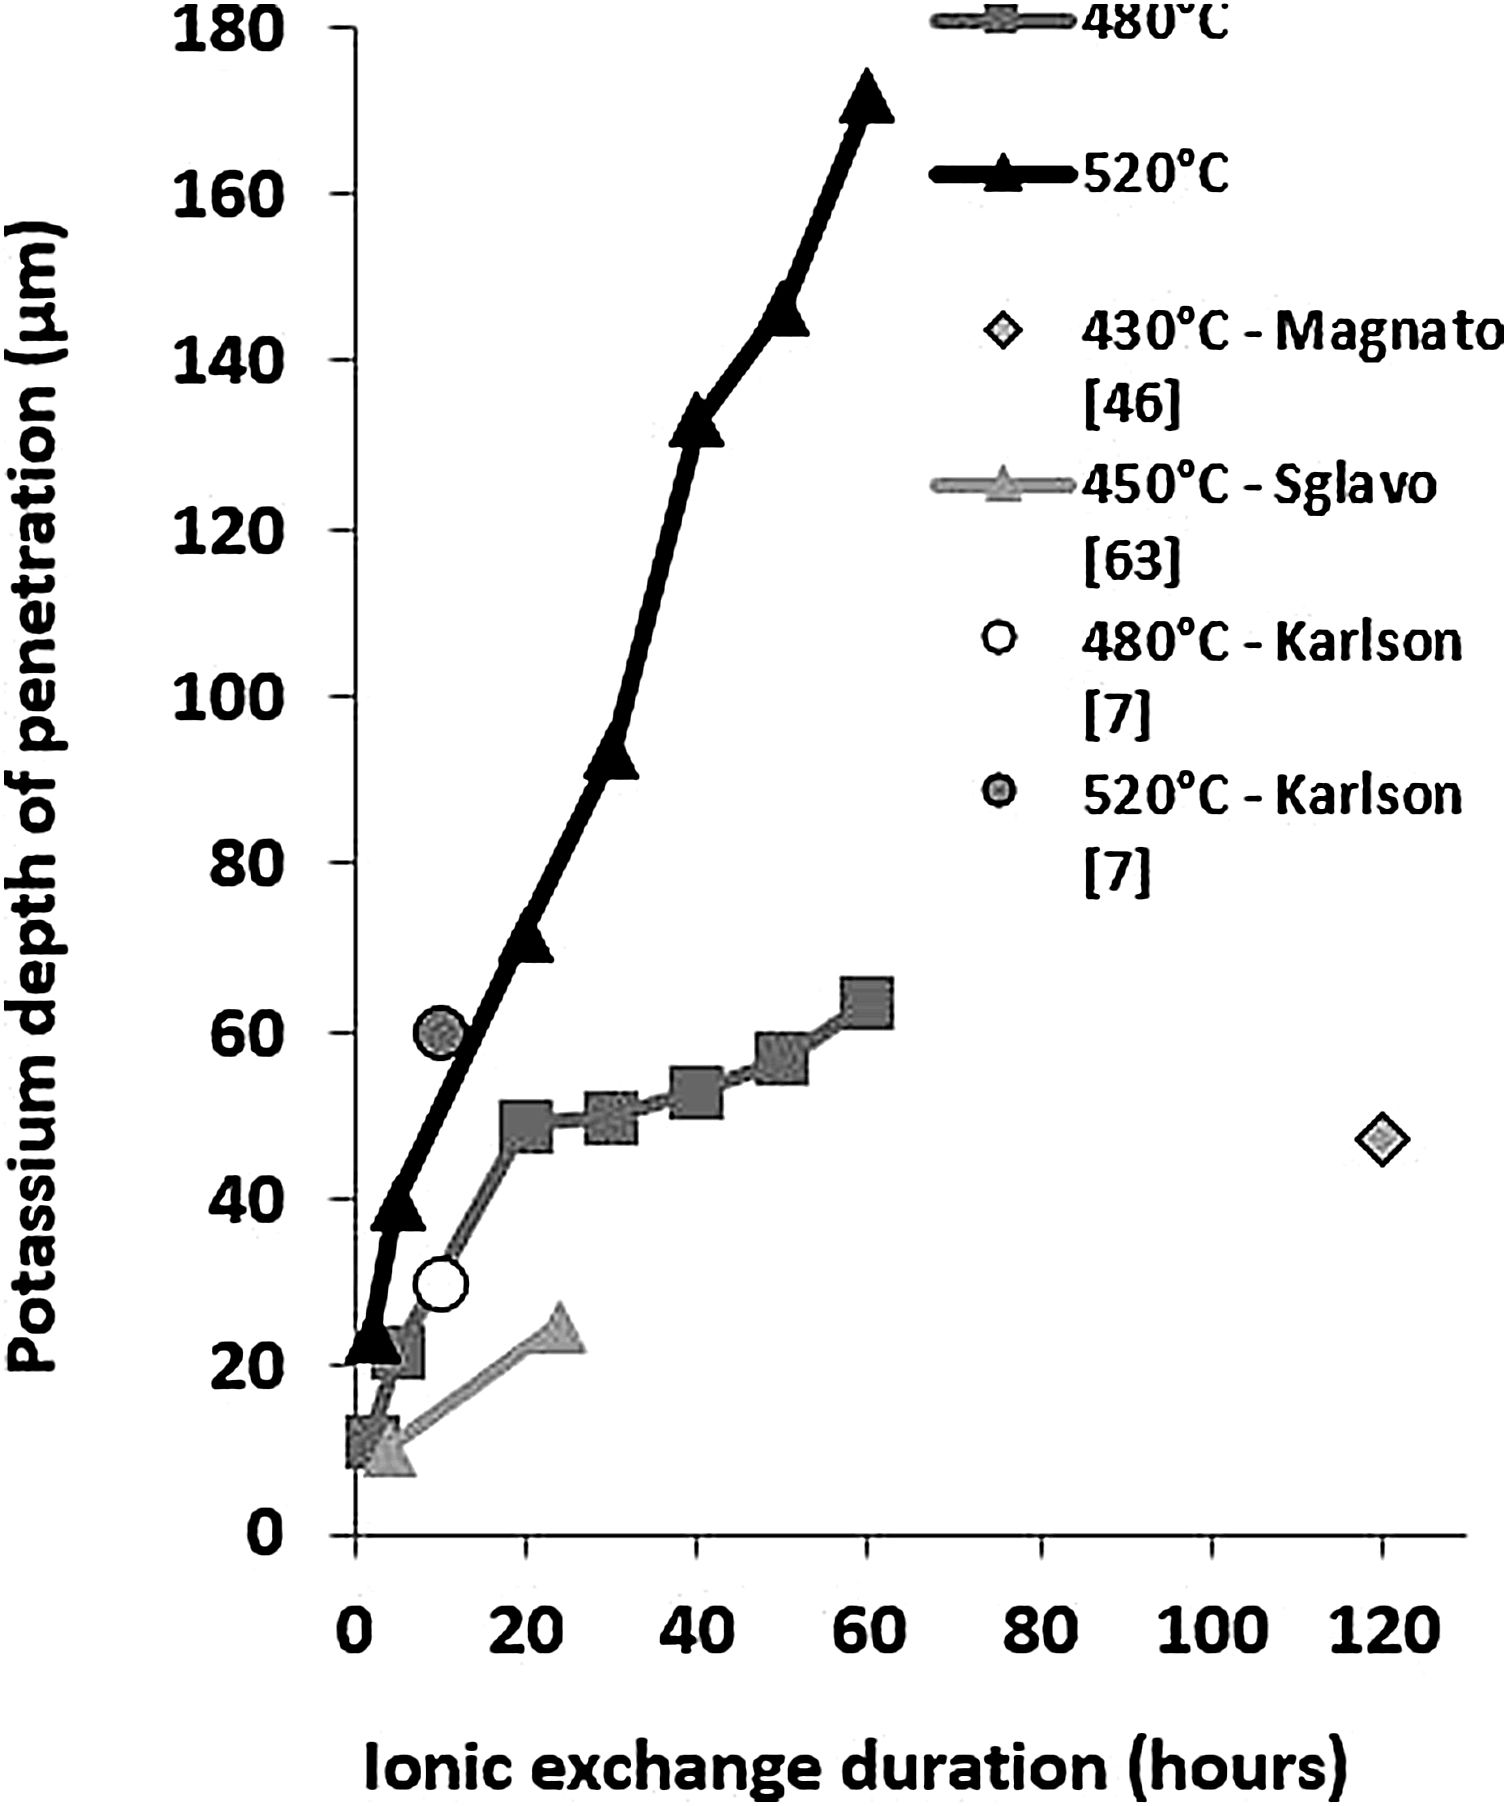
These EDX profile results are similar to those presented in other works [7,46,63], also plotted in Fig. 5. These data clearly show that treatment of the samples at higher temperatures results in the same DOP as at lower temperatures but with a shorter time.
Hardness depth of penetration (DOP) as a function of ion-exchange duration.")
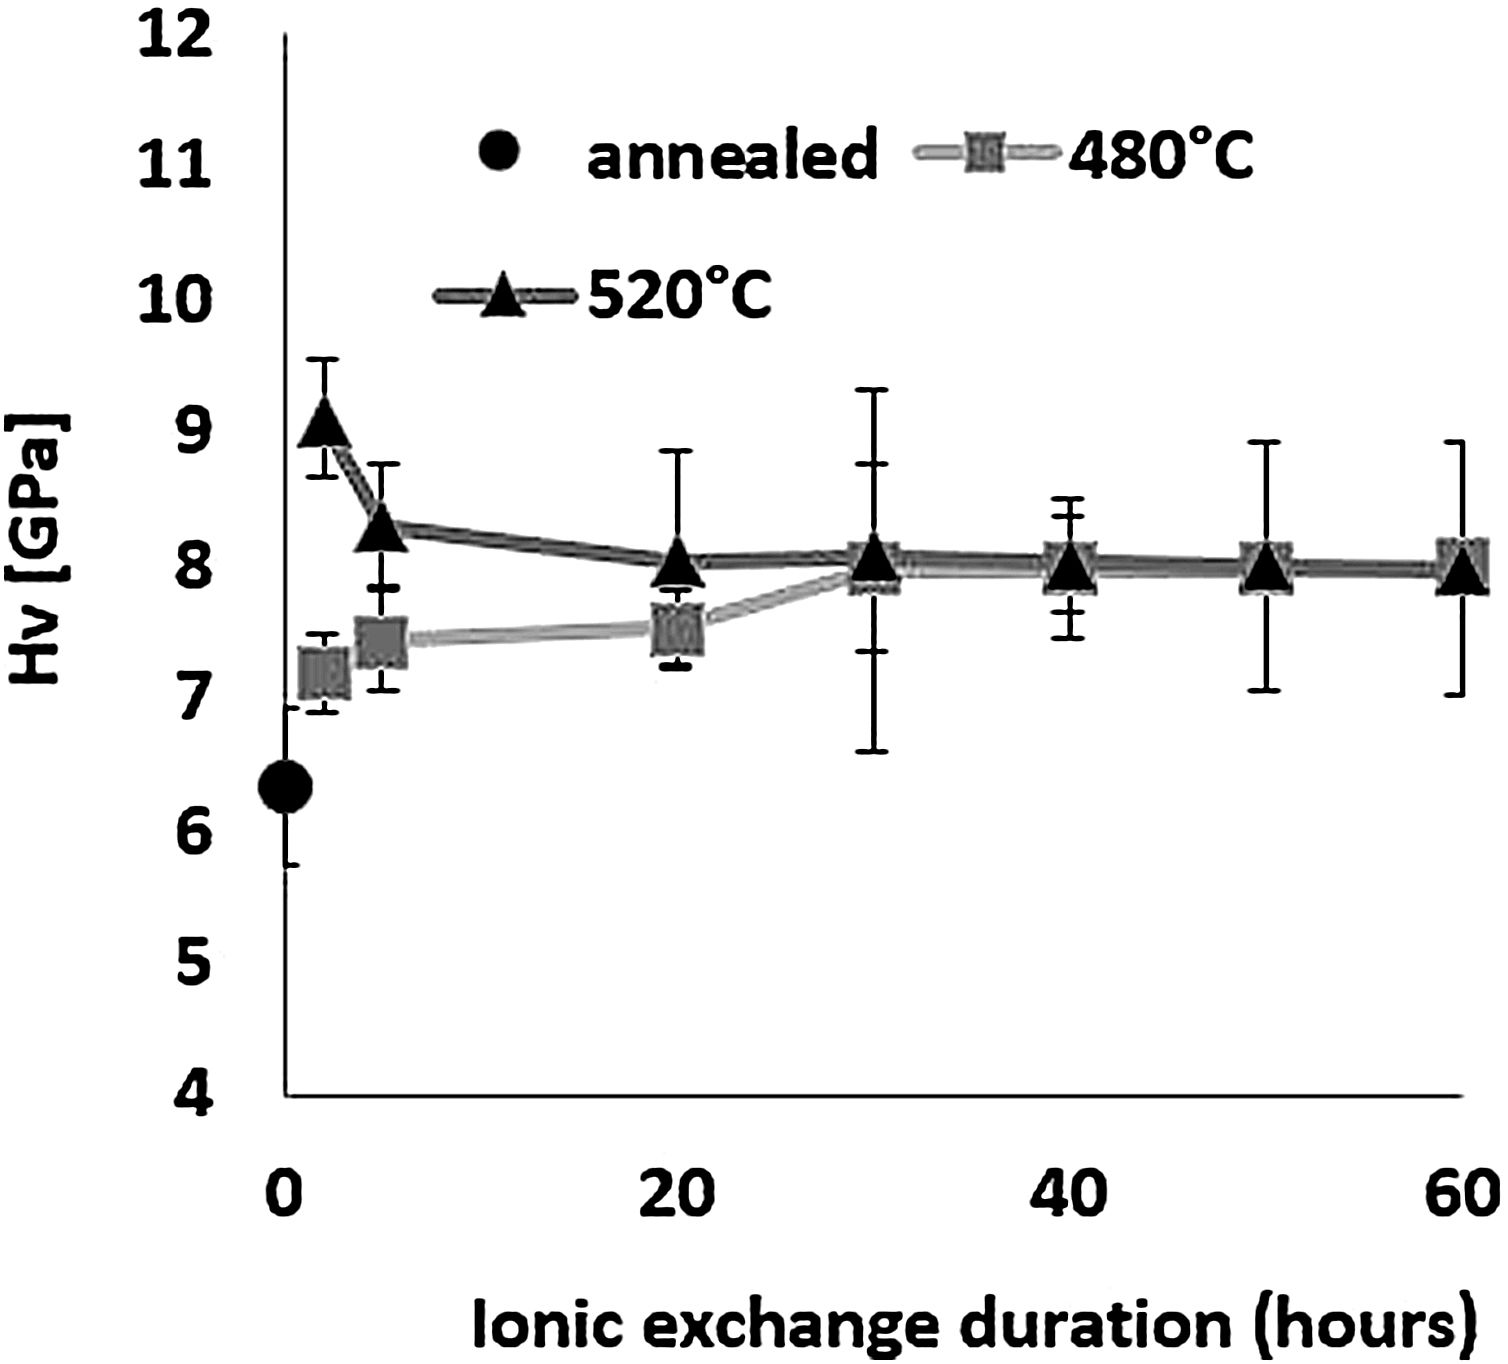
The influence of ion-exchange on hardness was examined taking into account Vickers hardness measurements. Fig. 6 shows hardness results obtained by relation [1] from the maximum load and depth of the indentation. All treated samples have a higher Vickers hardness than the reference untreated sample, demonstrating the effectiveness of chemical reinforcement in producing surface compressive stresses in glass [64]. For the sample treated at 480°C, Hv increases as time increases, reaching a maximum value of 8.0GPa for a 60-h treatment time compared to 6.3GPa for annealed glass.

For the samples treated at 520°C, the highest hardness of 9.1GPa was obtained for ion-exchange of 2h, above that time, Hv decreases down to around 8GPa, the same value as the samples treated at 480°C. The hardness of samples treated by ion-exchange has increased by 15–40% compared to that of annealed glass.
The hardness values of this study correspond to those of Younes’ work, which reach more than 8GPa [48]. According to Saggioro, the hardness increases as the exposure time increases, with a 14% improvement for an ion exchange time of 30h [65]. The standard deviation of approximately 9% is less than that of our work by almost 14% for the sample treated at 520°C for 30h, with the main source of error being diagonal indentation length measurements. In addition, Guldiren et al. found that Vickers hardness increases as the immersion time increases for short time treatment of 3hours, but it decreases for longer thermal treatment times [3,66].
The same phenomenon is observed for the samples treated at 520°C with a 10% decrease in hardness between 2h and 5h but the hardness value remains higher than that of the untreated sample. The increase in hardness is mainly attributed to the high concentration of K+ ions in the surface through the ion-exchange process and the decrease in the longer immersion time is attributed to the viscoelastic relaxation of the structure which reduces or eliminates compression constraints generated by ion exchange [10,15,46,66–71].
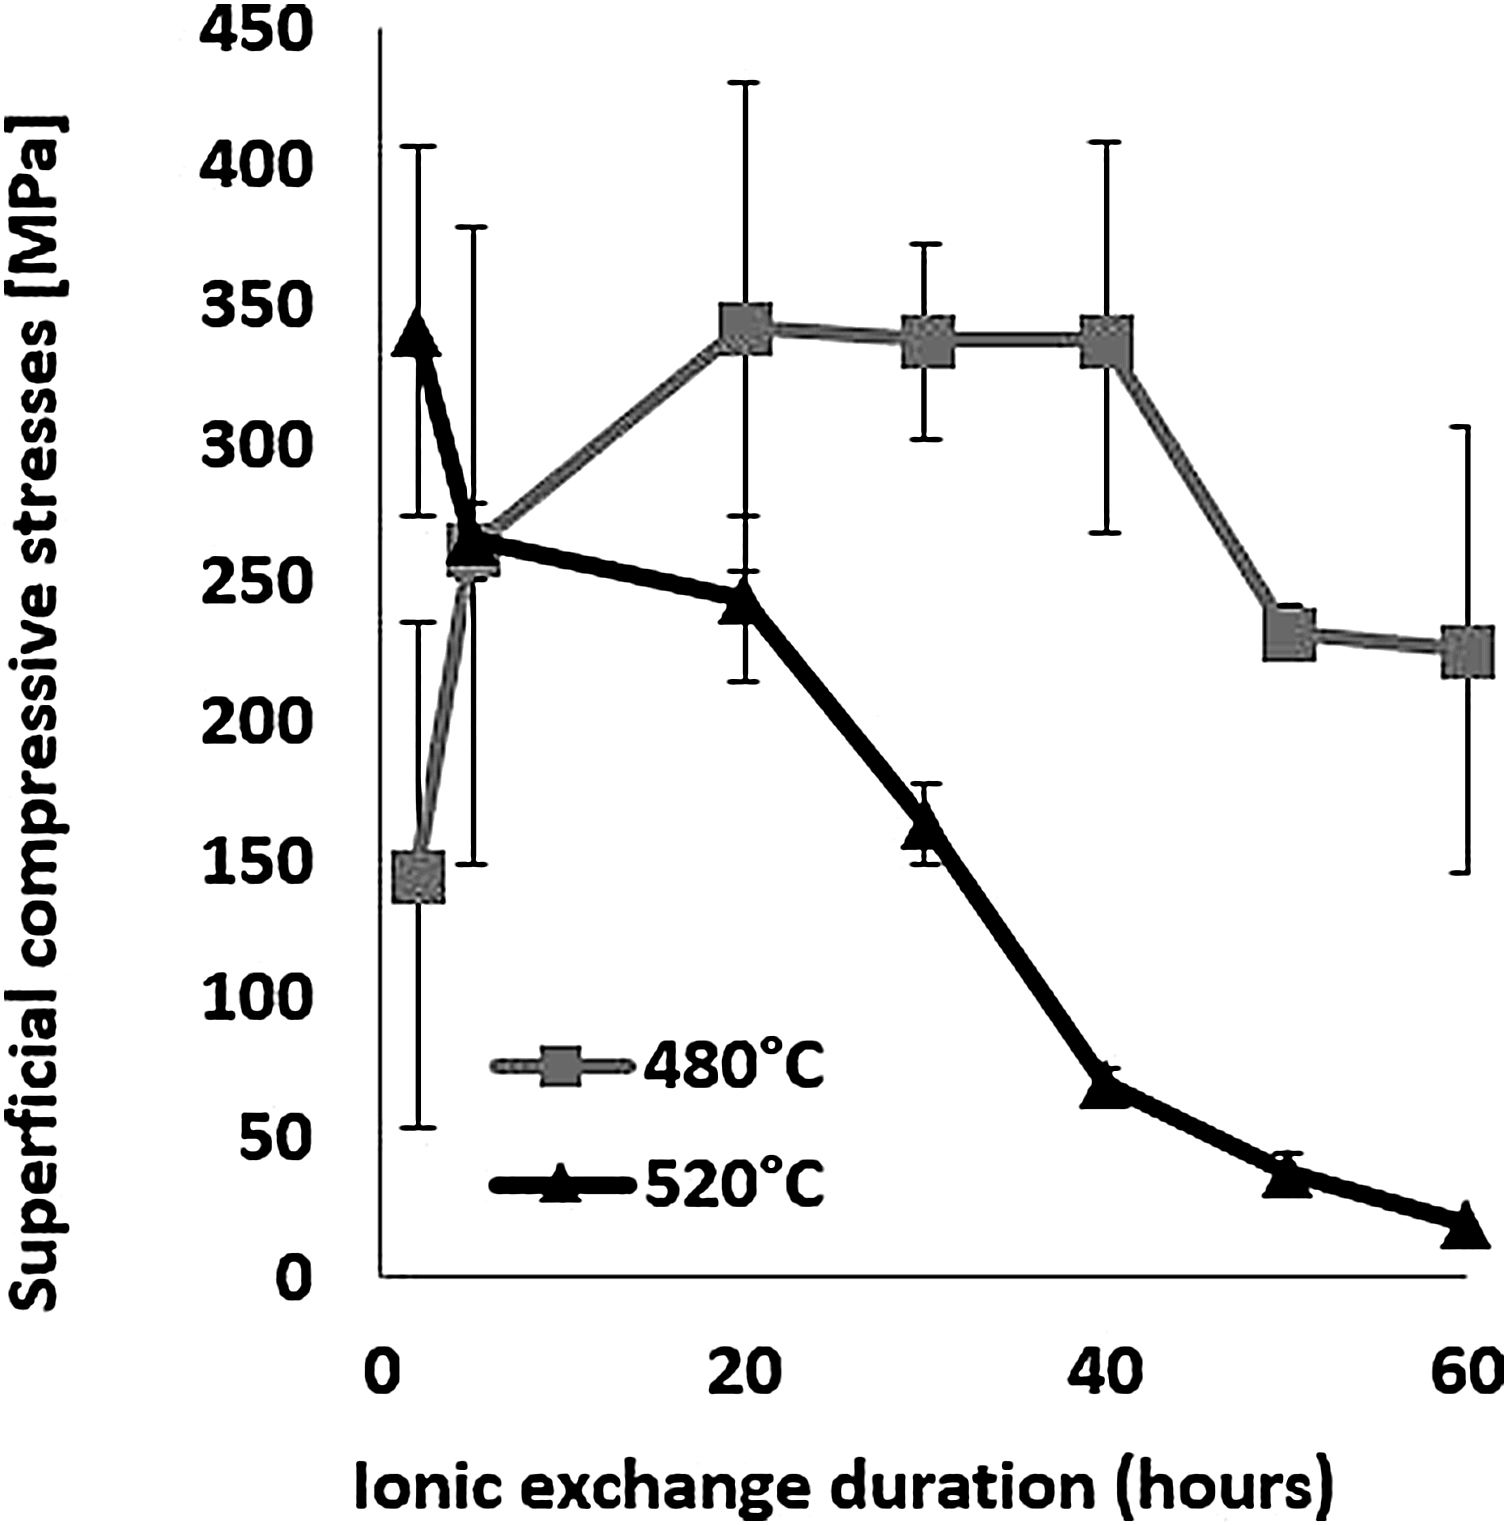
The evolution of the surface residual compressive stress calculated from indentation cracks with respect to ion-exchange time for the two temperatures studied is shown in Fig. 7. The compressive stresses are induced at the surface by the substitution of sodium ions by larger potassium ions in alkaline glass network sites [65,68,72,73] and the non-relaxation of this compression. At 480°C, the highest stress value of 337MPa for the treated sample was achieved over a 40-h processing period. After this treatment period, the stress decreases slightly. However, at 520°C, the maximum compression stress value of 340MPa is obtained for a processing time of 2h. Above this, the resulting surface compression stresses decrease to almost zero for treatment times of 50–60h.

The behaviour of hardness (Section Hardness) in relation to the two temperatures is a direct consequence of the behaviour of the compressive stresses. It can be assumed that the fact of being close to the glass transition temperature (Tg=573°C), the relaxation of the stresses induced by the ion exchange, would thus promote viscoelastic relaxation. The behaviour of hardness (Section Hardness) in relation to the two temperatures would be a direct consequence of the behaviour of the compressive stresses.
Ingram [74] suggested that this relaxation near Tg could be due to the cations themselves by the cation-induced relaxation of the network (CIRON) which induces stress reduction by causing the rupture and rearrangement of local bonds. Varshneya [75] modulates this interpretation by introducing a “new view” of the physics of chemical glass reinforcement. He suggested that CIRON does not even need to be invoked and explained that in the mesoscopic region around an exchange site, the bonds only need to be bent or stretched beyond their elastic limit to provide partial hosting, but permanent, for a larger invading ion.
The density was calculated according to Sasek and Ledererova's method. The results obtained are summarized in Table 3 and showed density values increase after the thermo-chemical treatment. The density values for the samples treated at 520°C temperature are relatively higher than those treated at 480°C. For the samples treated at 520°C, the highest density value of the order of 2.6 was obtained for ion-exchange time of 2h compared to 2.5 for the annealed glass. The change in density value is explained by the higher K+ content of the treated sample at 520°C compared to that treated at 480°C. Similarly, an improvement in hardness is observed after ion-Exchange at 520°C or 480°C relative to the original annealed glass and higher at 520°C due to higher surface K+ concentration inducing higher surface compression (Fig. 7).
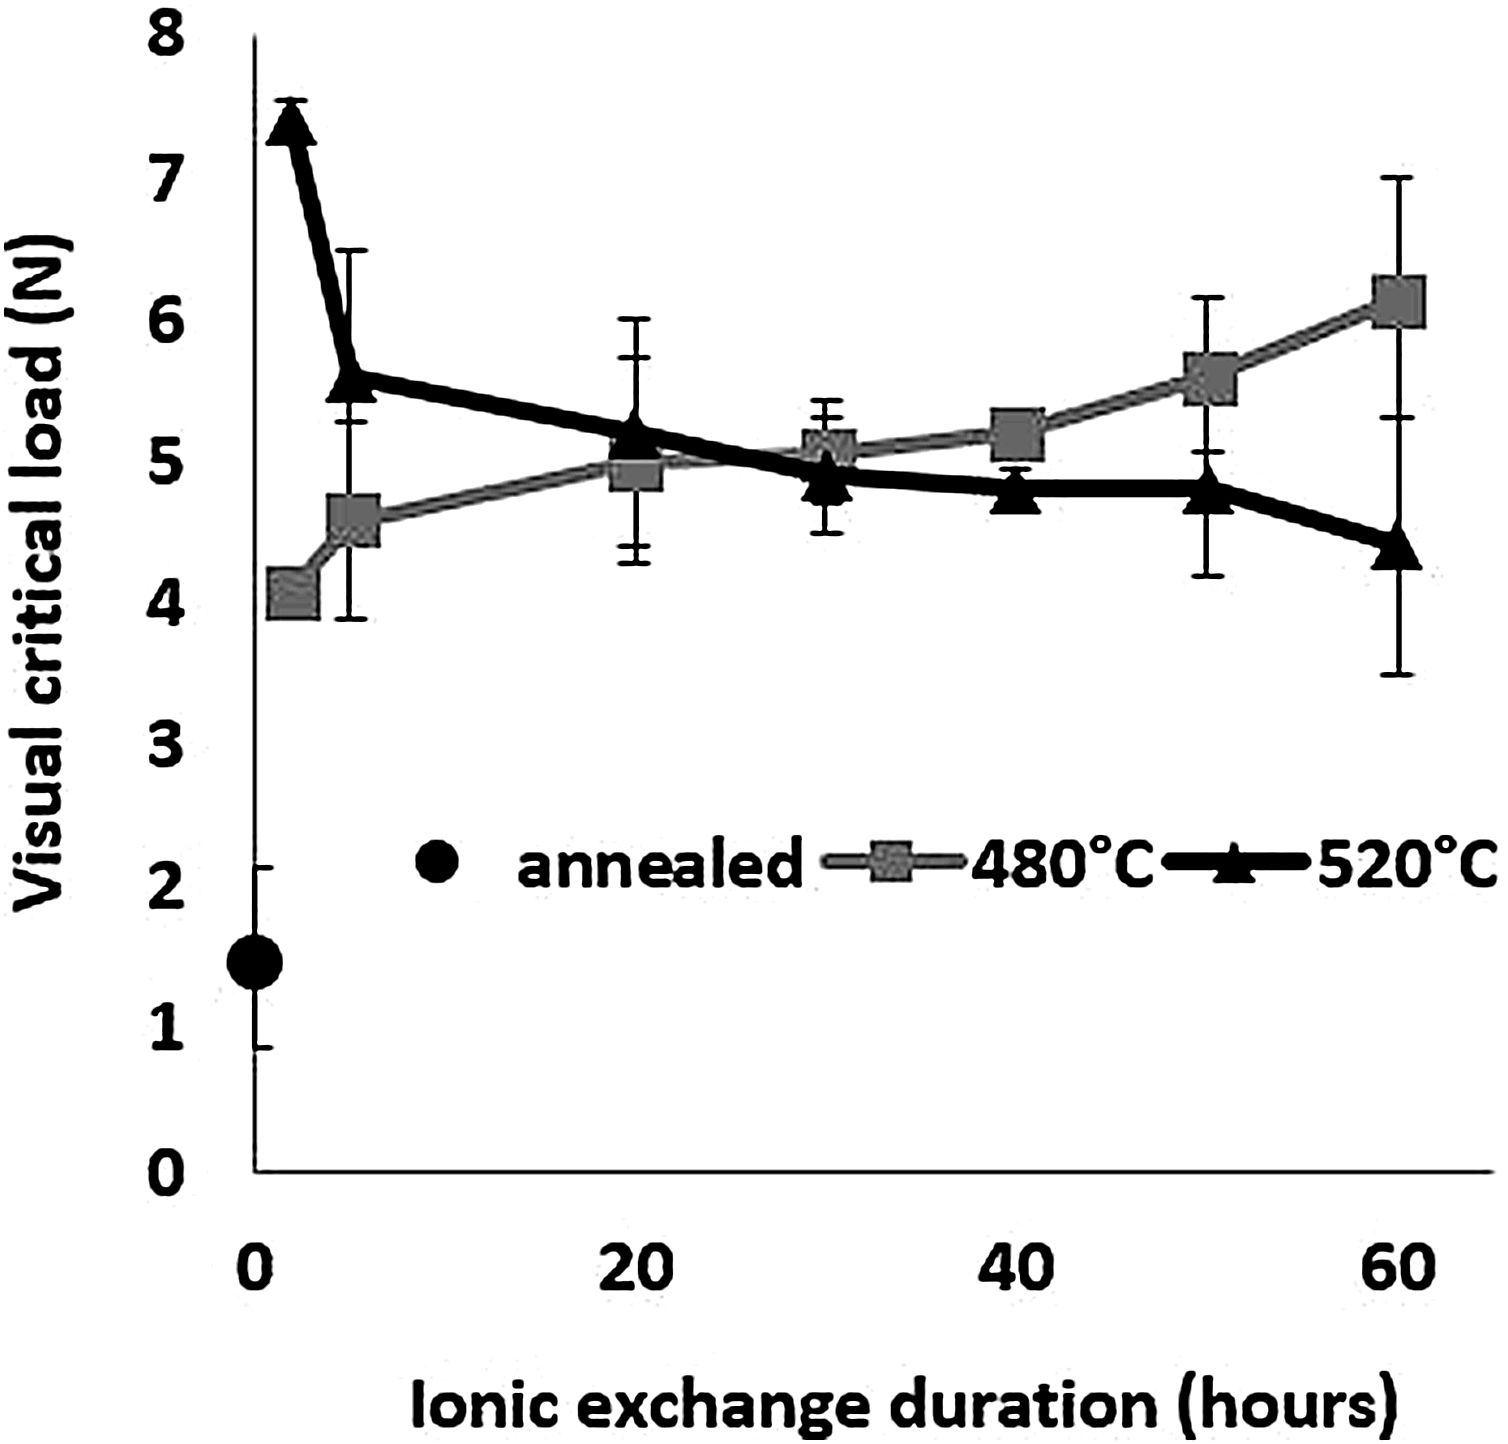
Scratch resistanceThe scratch resistance under increasing load is shown in Fig. 8 as a function of ion-exchange duration at the two different treatment temperatures. The visual critical load of the untreated glass is very low (1.5N) compared to all the time/temperature treatment combination ion-exchanged glasses. The maximum visual critical load of 7.4N is obtained for the glass treated at 520°C for 2h. For longer times, the visual critical load of this glass decreases with chemical strengthening time down to 4.3N at 520°C for 60h. On the contrary, the visual critical load of the glass treated at 480°C increases steadily with treatment duration up to 6.14N for 60h.

High temperature and short treatment time (520°C – 2h) is the best combination for optimized scratch resistance. These scratch results are consistent with the Vickers hardness results (Fig. 6) as the scratch resistance is directly related to the hardness of the glass.
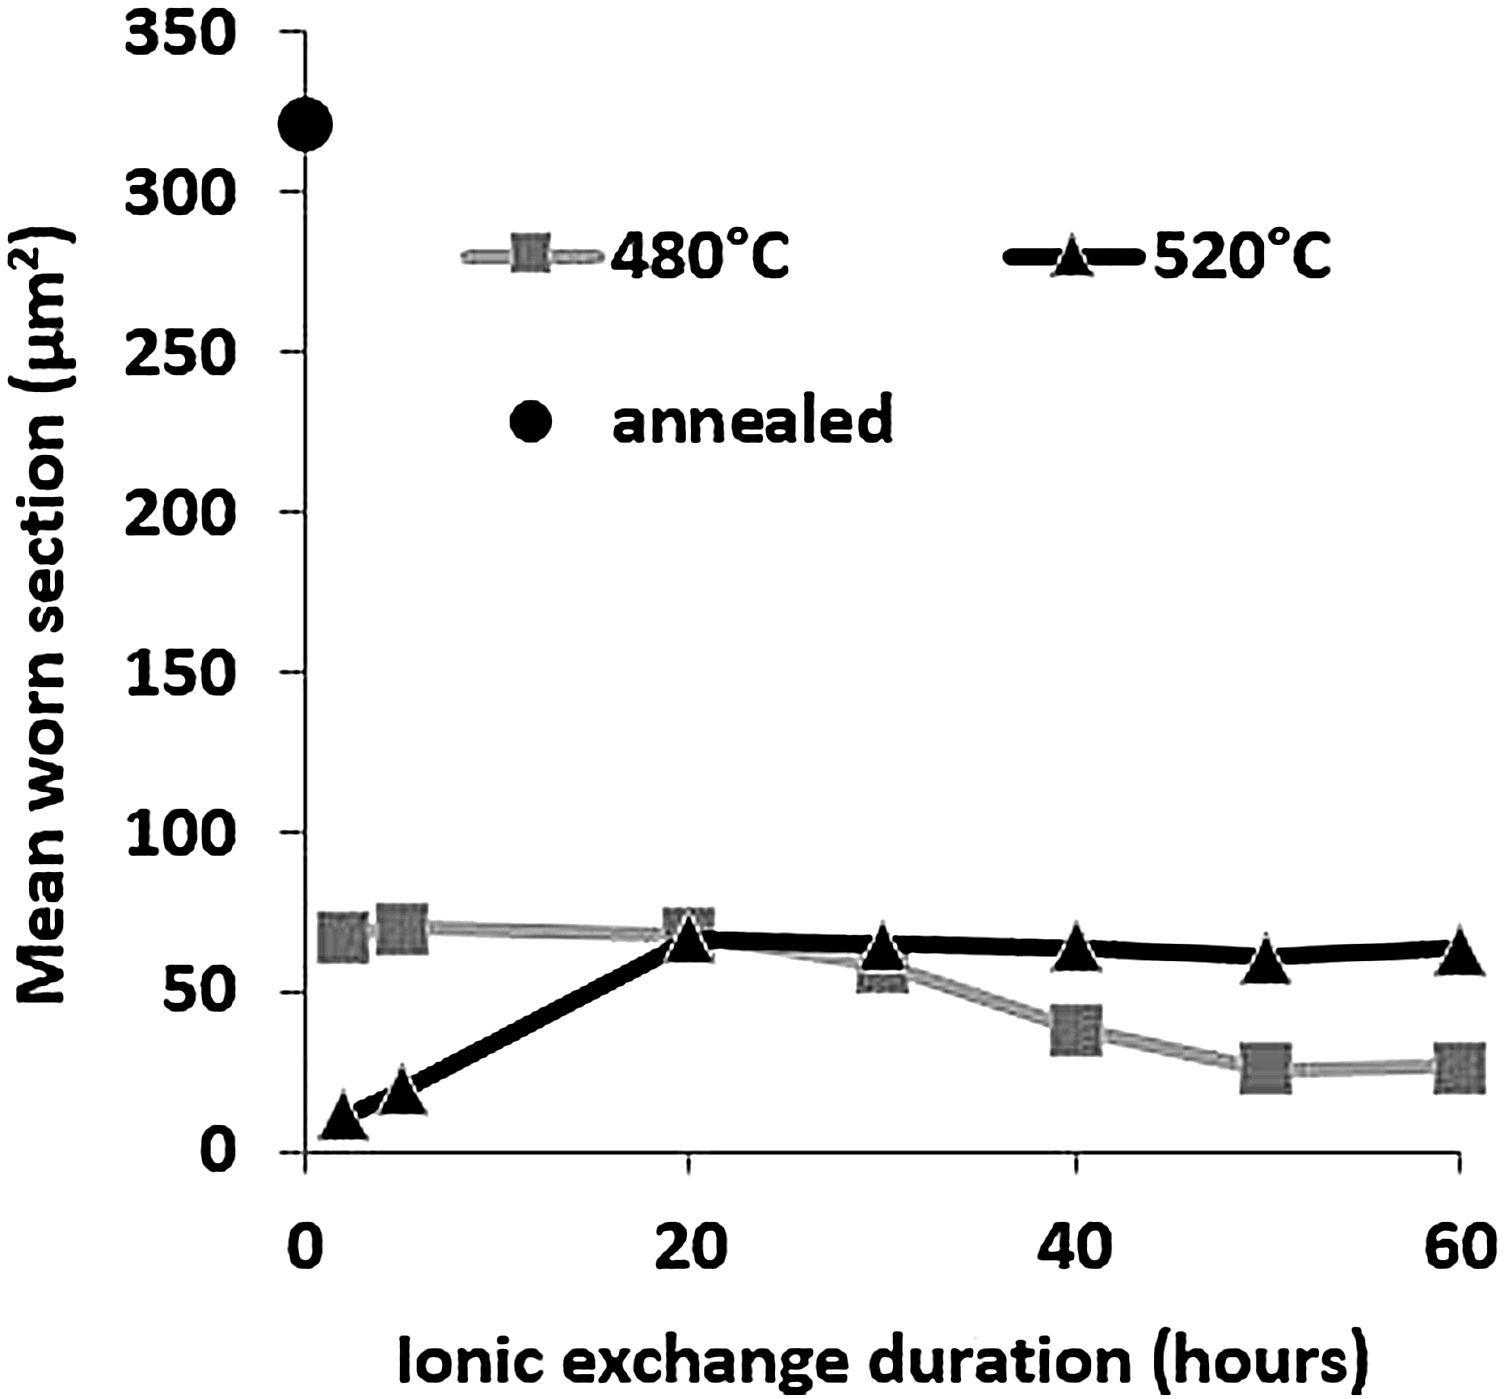
Wear resistancePin-on-disc mean worn section is presented in Fig. 9 as a function of ionic exchange duration at the two different treatment temperatures. The worn section of the untreated glass is very high (322μm2) compared to each treatment time/temperature combination ion-exchanged glass (maximum worn section of 70μm2).

For glass treated at 480°C, the average worn section decreases with time of the chemical strengthening. It reaches a minimum value of 26μm2 above 50h of treatment. For glass treated at 520°C, the worn-out section is at least 11μm2, for 2h of treatment, then wear increases to a steady-state level greater than 20h of treatment (worn section 60–65μm2).
High temperature and short treatment time is the best combination of optimized sliding wear resistance. This might be the optimum process compromise to achieve a high surface potassium concentration (see Fig. 4) and avoid releasing the generated surface stresses (Fig. 7). These pin-on-disc wear results are also consistent with the Vickers hardness results (Fig. 6) for the same reasons.
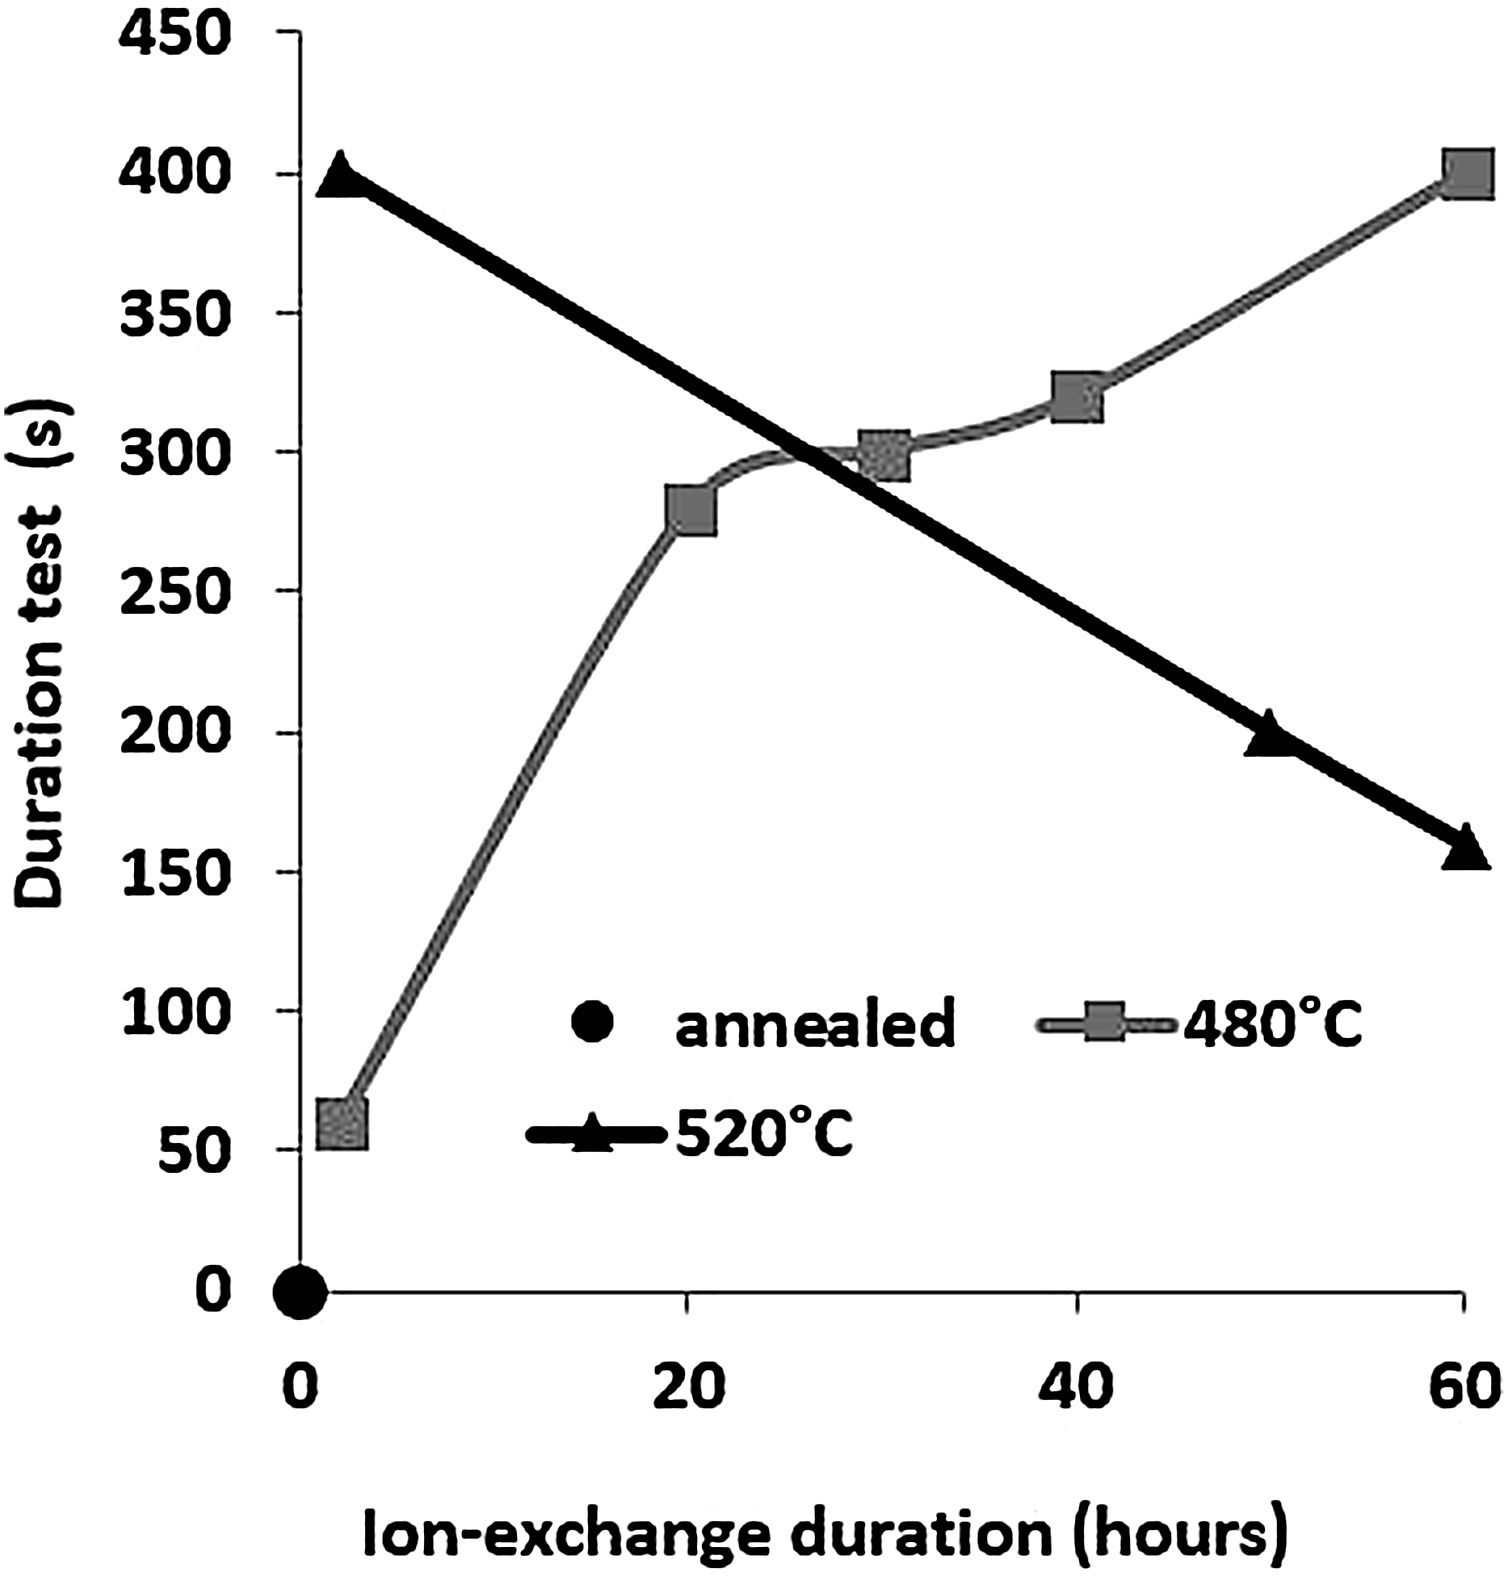
The second parameter extracted from the pin-on-disc test is the time required to wear out the ion exchange layer that corresponds to the penetration thickness. These results are shown in Fig. 10, correspond to Vickers’ results in terms of hardness, and scratch resistance. Indeed, the longest time (400s) is the hardest and most scratch-resistant sample (2h to 520°C) and the time decreases for a longer ion exchange treatment time. For samples treated at 480°C, the ion exchange layer wear time gradually increases to 400s for 60h.
Erosion test.")
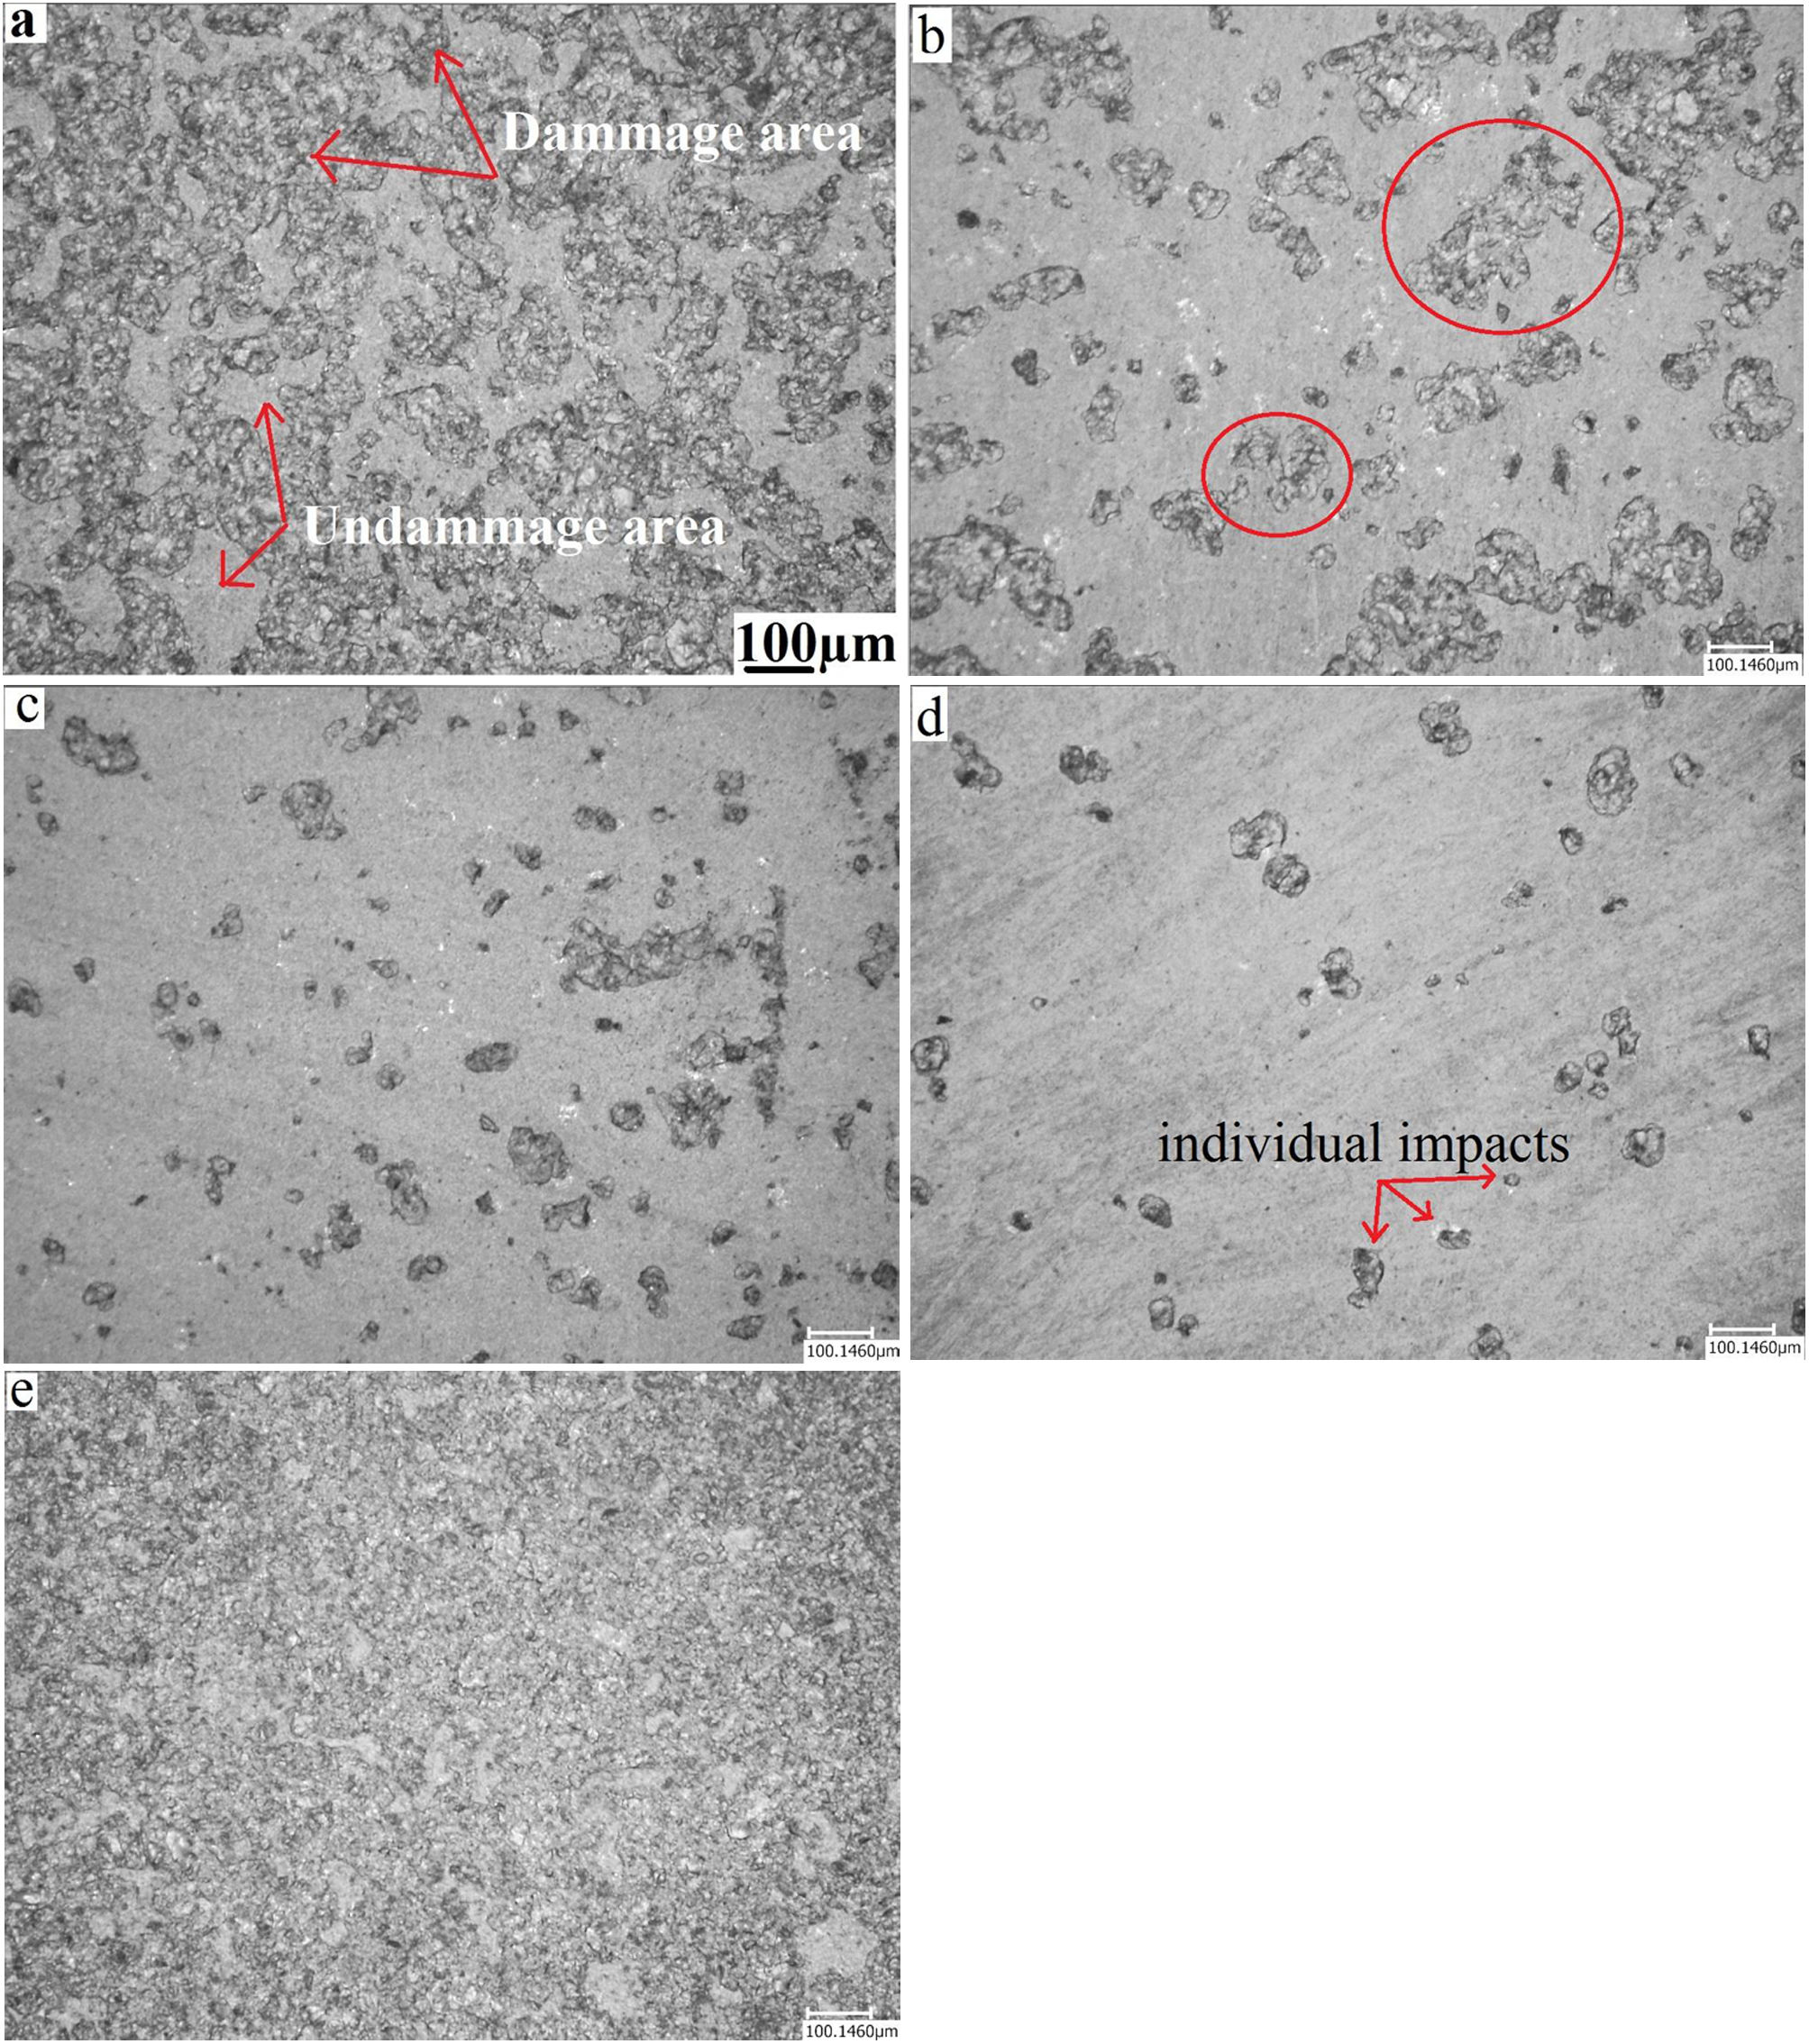
Fig. 11 presents a microscopic observation of the samples (annealed, and treated: at 480°C for 2h, 60h, and treated at 520°C for 2h) eroded by the sand and annealed and eroded by alumina. As shown in the micrographs, the surface of the annealed glass (Fig. 11a) is much more damaged than that of the treated glass. The density of the defects and their distribution cover the entire surface. Compared to the treated glass, the number of defects is much greater.
. (a) annealed eroded by sand. (b) Treated at 480°C for 2h eroded by sand. (c) Treated at 480°C for 60h eroded by sand. (d) Treated at 520°C for 2h eroded by sand. (e) Annealed glass eroded by Alumina.")
For chemically toughened glass, this density of defects decreases as the temperature and treatment time increase. The number and size of induced defects decrease considerably after the thermo-chemical treatment. There is the formation of individual impacts (Fig. 11e) randomly distributed on the surface especially for the treatment at the temperature of 520°C.
For samples eroded by sand, there is formation of an impact site surrounded by a few scales (Fig. 11b and c). An interaction between nearby defects occurs when their number is large. This leads to the formation of areas damaged by an erosion mechanism.
The effect of erosion with alumina on an annealed glass is shown in the last micrograph. It is noticed that almost the entire surface is degraded, compared to glass eroded by sand. The damage covers the entire surface of the glass to reach the saturation state. This can be explained by the fact that the alumina grains have a higher hardness than sand grains. They have a shape with sharp edges and cutting edges compared to sand grains whose shape is more rounded.
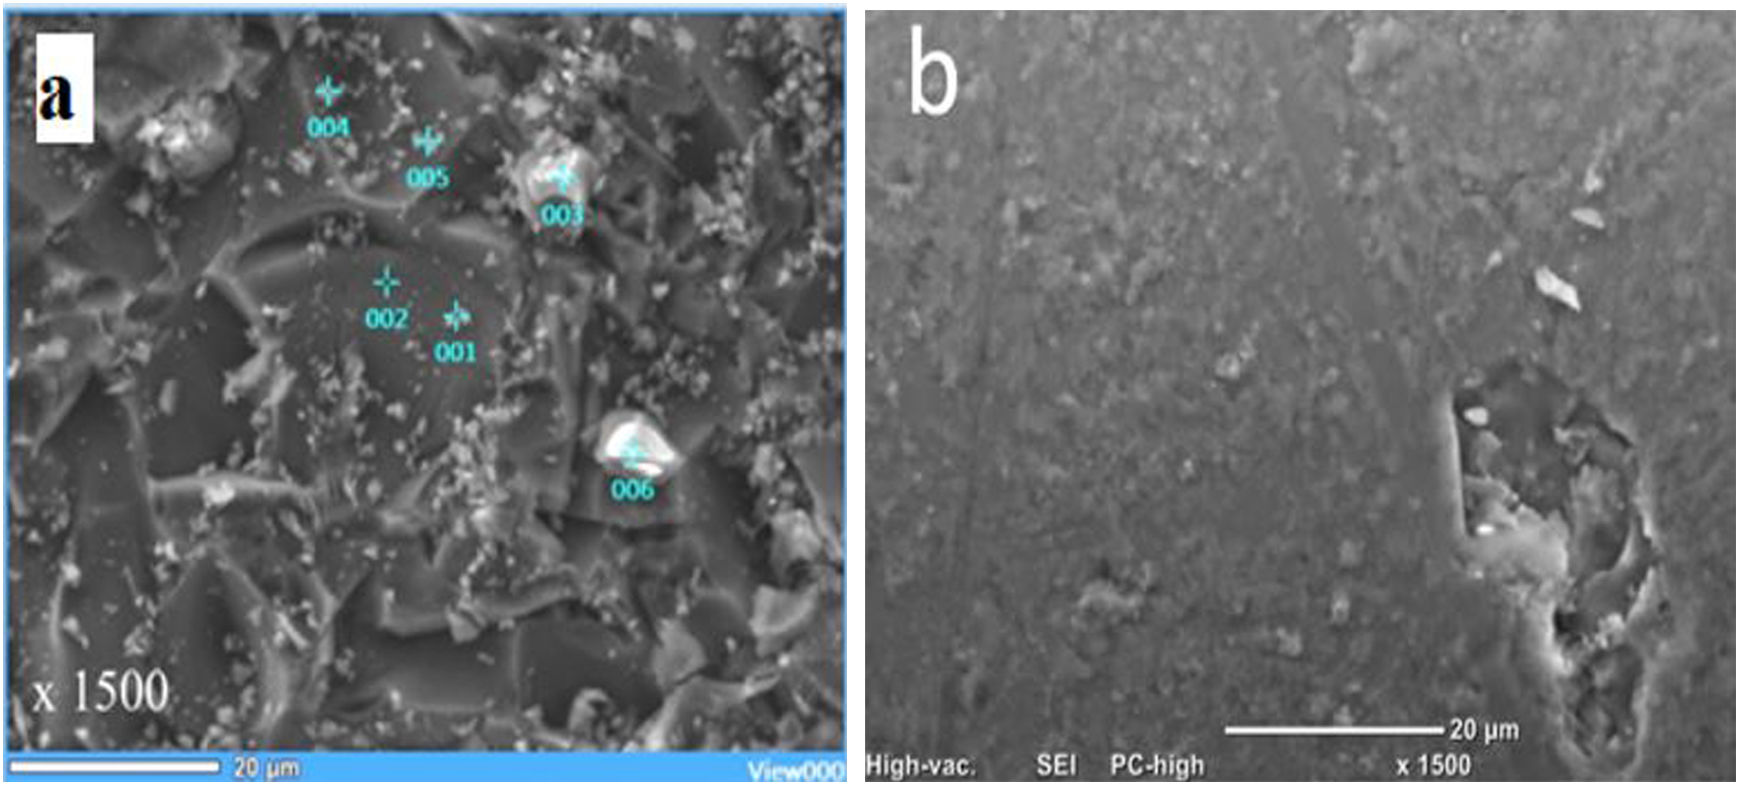
Fig. 12 shows the SEM images for glass treated at 480°C for 2h eroded by alumina and sand. This image (Fig. 12a) shows the surface damage of eroded glass by alumina grains. Some materials torn from the glass surface (points 003 and 006) and the presence of alumina grains glued to the glass surface (points 001, 004 and 005) are highlighted. These grains were broken during erosion. Fig. 12b clearly shows that the material was removed. Damage to the surface by the sandblasting mechanism is responsible for the loss of mass, which turns into shavings of different sizes.
 alumina, (b) sand.")
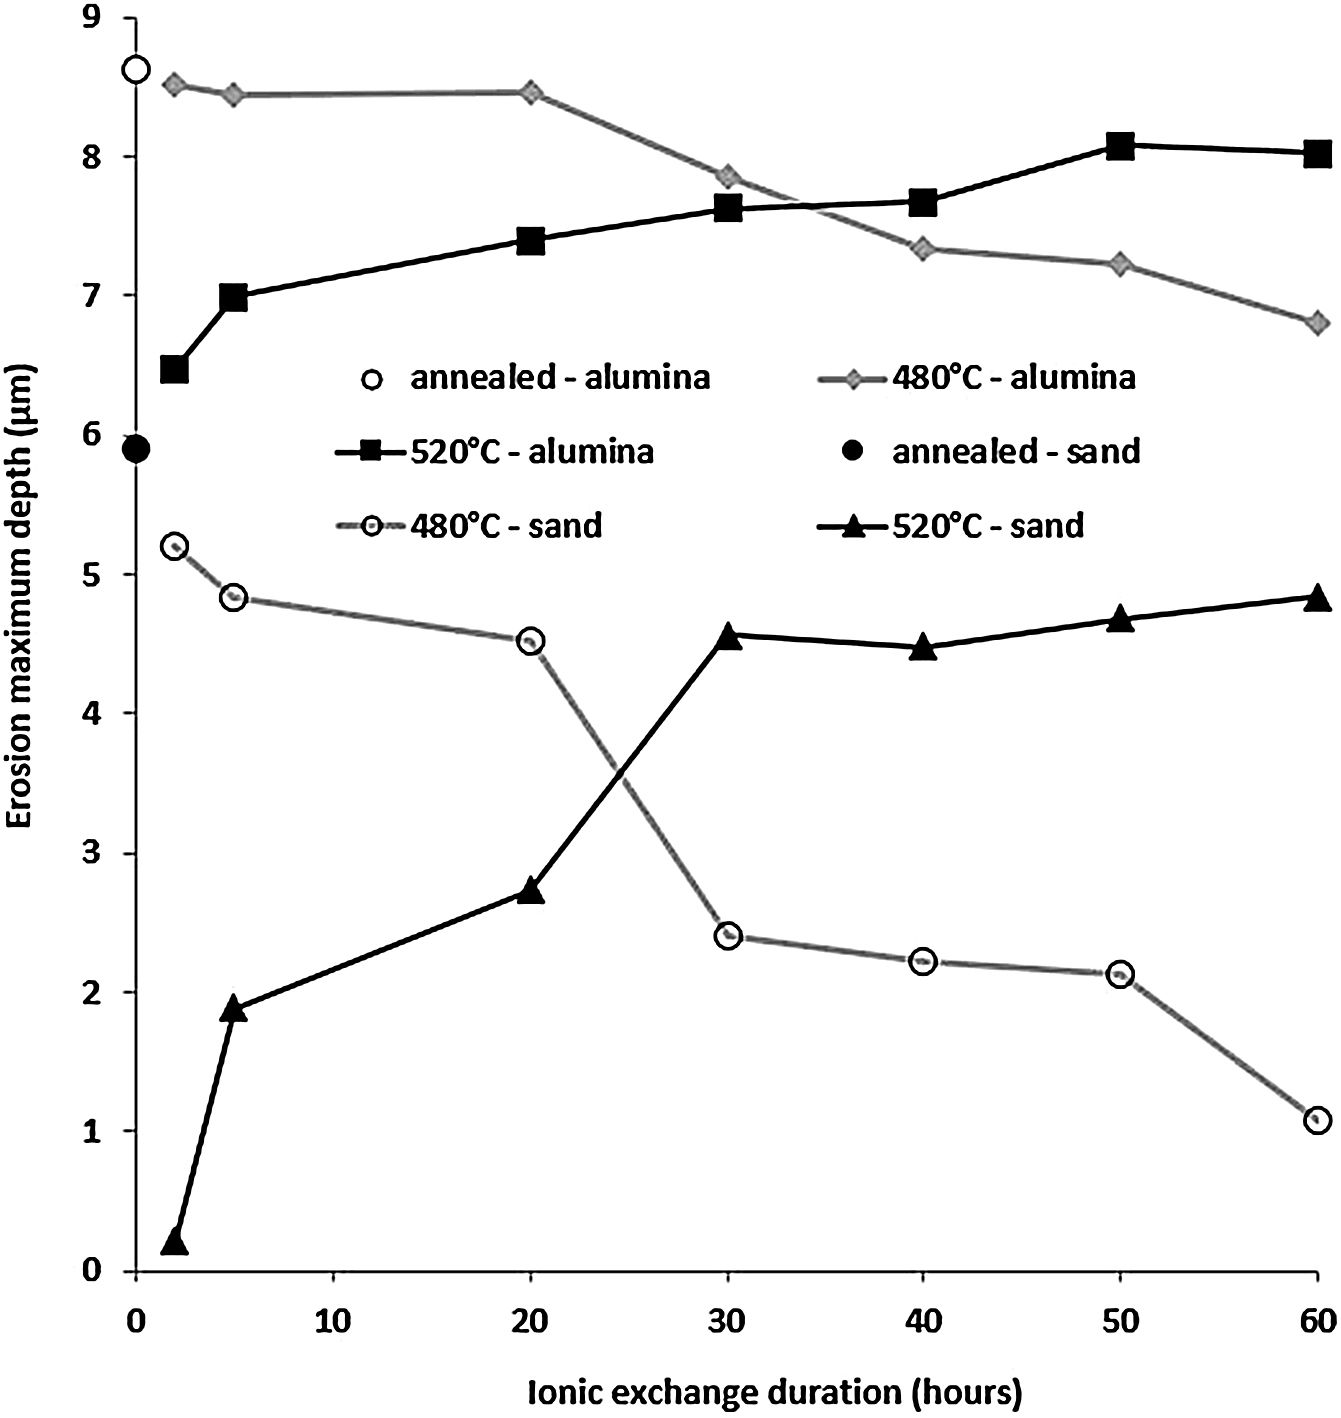
Fig. 13 shows the maximum erosion depth measured on the worn surfaces of the sample for the different temperatures and treatment times of the ion exchange. The wear resistance is better when this parameter has low values. While the wear resistance of treated samples at 480°C increases with the increase in ion exchange time, it decreases for treated samples at 520°C. For ion exchange times less than 30h, samples treated at 520°C have better wear resistance than those treated at 480°C. The best resistant samples are those treated at 520°C for less than 10h.

This behaviour can be explained by the evolution of the compressive stresses (Fig. 7). For the temperature of 520°C, the compressive stresses decrease from the treatment time of 2hours. Therefore, the resistance that these stresses oppose and therefore the material to the removal material by erosion damage decreases from 2h.
It can be noted that these stresses increase from 2h for the temperature of 480°C. If the maximum depth of erosion increases, of course the erosion damage strongly increases.
ConclusionThis work has confirmed previous results such as hardness; scratch, wear resistance and erosion resistance are strongly improved after ion-exchange treatment and has allowed to precise the best thermal treatment conditions for soda-lime glass tempered in molten KNO3 bath. The increase in the ion exchange time induces an increase in Vickers hardness of about 15–40% compared to annealed glass. Samples processed at 520°C for a short period of 2h show better mechanical properties compared to samples processed at 480°C for longer times. These conditions correspond to the maximum diffusion of K+ in the surface of the glass without induced compressive stress relaxation phenomenon. Therefore, knowing the glass transition temperature is decisive for the choice of its reinforcement parameters by ion exchange.
This work has also shown the possibility of using the ion exchange technique to strengthen the glass articles exposed to the sandstorm. Reinforcing the surface of glass products used in the Sahara (windows, solar panels, glass facades, windshields, etc.) is becoming an absolute necessity. It was shown that the damage to the glass surface provoked by the alumina grits is more severe than by the sandblasting and that the erosion resistance strongly depends on the temperatures and treatment times of the ion exchange. So, the best resistant samples are those treated at 520°C for less than 10h.
The authors thank Dr. Fabrice Petit for his helpful suggestions regarding the interpretation of mechanical test results. BCRC (Belgian Ceramic Research Centre) and DGRSDT (Directorate General of Scientific Research and Technological Development-Algeria) for financial support.
