


Representative ‘Bluespeckled’ (13–16th centuries) and ‘Brownspeckled’ (13–21st century) wares recovered from the excavations in Qalhât or collected around Bahlâ city (Sultanate of Oman) were characterized by XRPD, SEM-EDS, Raman/optical microspectroscopy, and thermal expansion. Minerals present in the body (quartz, augite and albite as major phases, calcite, dolomite, rutile, anatase, phosphate, hematite and magnetite as minor phases) were identified by XRPD and/or Raman spectroscopy. SEM-EDXS microanalysis was performed on the glazes in order to compare their composition, especially the type of flux. The firing temperatures measured from the thermal expansion curves range between 1080°C and 1150°C. This preliminary study confirms that the first differentiation can be made by considering non-invasive Raman technique and thermal expansion measurement is sufficient to get an extensive comparison of the wares. A local place of production is likely for the body of all samples but importation of the glazes of ‘Bluespeckled’ wares is questioned. Modern Bahlâ productions cannot be considered to have inherited the Qalhât ones. Ba-rich, cassiterite-opacified glaze corresponding to the Late Islamic Arabic Period appears as a new technology without a connection to the ancient one.
Las mercancías representativas ‘moteadas de azul’ (siglos XIII-XVI) y ‘moteadas de marrón’ (siglos XIII-XXI) recuperadas de las excavaciones en Qalhât o recolectadas alrededor de la ciudad de Bahlâ (Sultanato de Omán) se caracterizaron por microscopía XRPD, SEM-EDS, Raman, microscopía y expansión térmica. Los minerales presentes en el cuerpo (cuarzo, augita y albita como fases principales, calcita, dolomita, rutilo, anatasa, fosfato, hematita y magnetita como fases menores) se identificaron mediante espectroscopía XRPD y/o Raman. Se realizó un microanálisis SEM-EDXS en los esmaltes para comparar su composición, especialmente el tipo de flujo. Las temperaturas de cocción medidas a partir de las curvas de expansión térmica oscilan entre 1080° C y 1150° C. Este estudio preliminar confirma que la primera diferenciación se puede hacer considerando la técnica Raman no invasiva y la medición de la expansión térmica es suficiente para obtener una comparación extensa de las mercancías. Es probable que haya un lugar de producción local para el cuerpo de todas las muestras, pero se cuestiona la importación de los esmaltes de las mercancías “moteadas de azul”. No se puede considerar que las producciones modernas de Bahlâ hayan heredado las de Qalhât. El esmalte opacificado con casiterita, rico en Ba correspondiente al último período árabe islámico, aparece como una nueva tecnología sin conexión con la antigua.
At the beginning of the first millennium AD, the Indian Ocean became a region of long-distance trade between the Middle East, India, South(east)-Asia and Africa, thanks to monsoon winds [1]. Qalhât site (Sultanate of Oman) located near the Ra's al-Hadd was a key harbour city for short- to long-distance trade from the 13th to the 15th century. The city was founded around 1100 AD, sacked by the Portuguese in 1508 and became totally abandoned during the 16th century [2]. More than two hundred thousand ceramic shards were excavated. Preliminary visual classifications based on shape and decors, as well Raman and XRF studies were carried out [2–5]. Many questions are still open for pottery characterized by a simple monochrome glaze and a porous body intermediate between that of terra cotta and faience. Particular attention is paid here for two well defined groups by visual examination, the so-called ‘Bluespeckled’ and ‘Brown speckled’ wares (Figs. 1 and 2), commonly found in many sites of the Arabic Peninsula and their place of production highly disputed [2–7]. We will seek by analysis to obtain objective information concerning their places of production, local, imported from Iran or elsewhere.
 1; (b) 3; (c) 5; (d) 6 and (e and f) 8 shards (see Table 1 for details).")
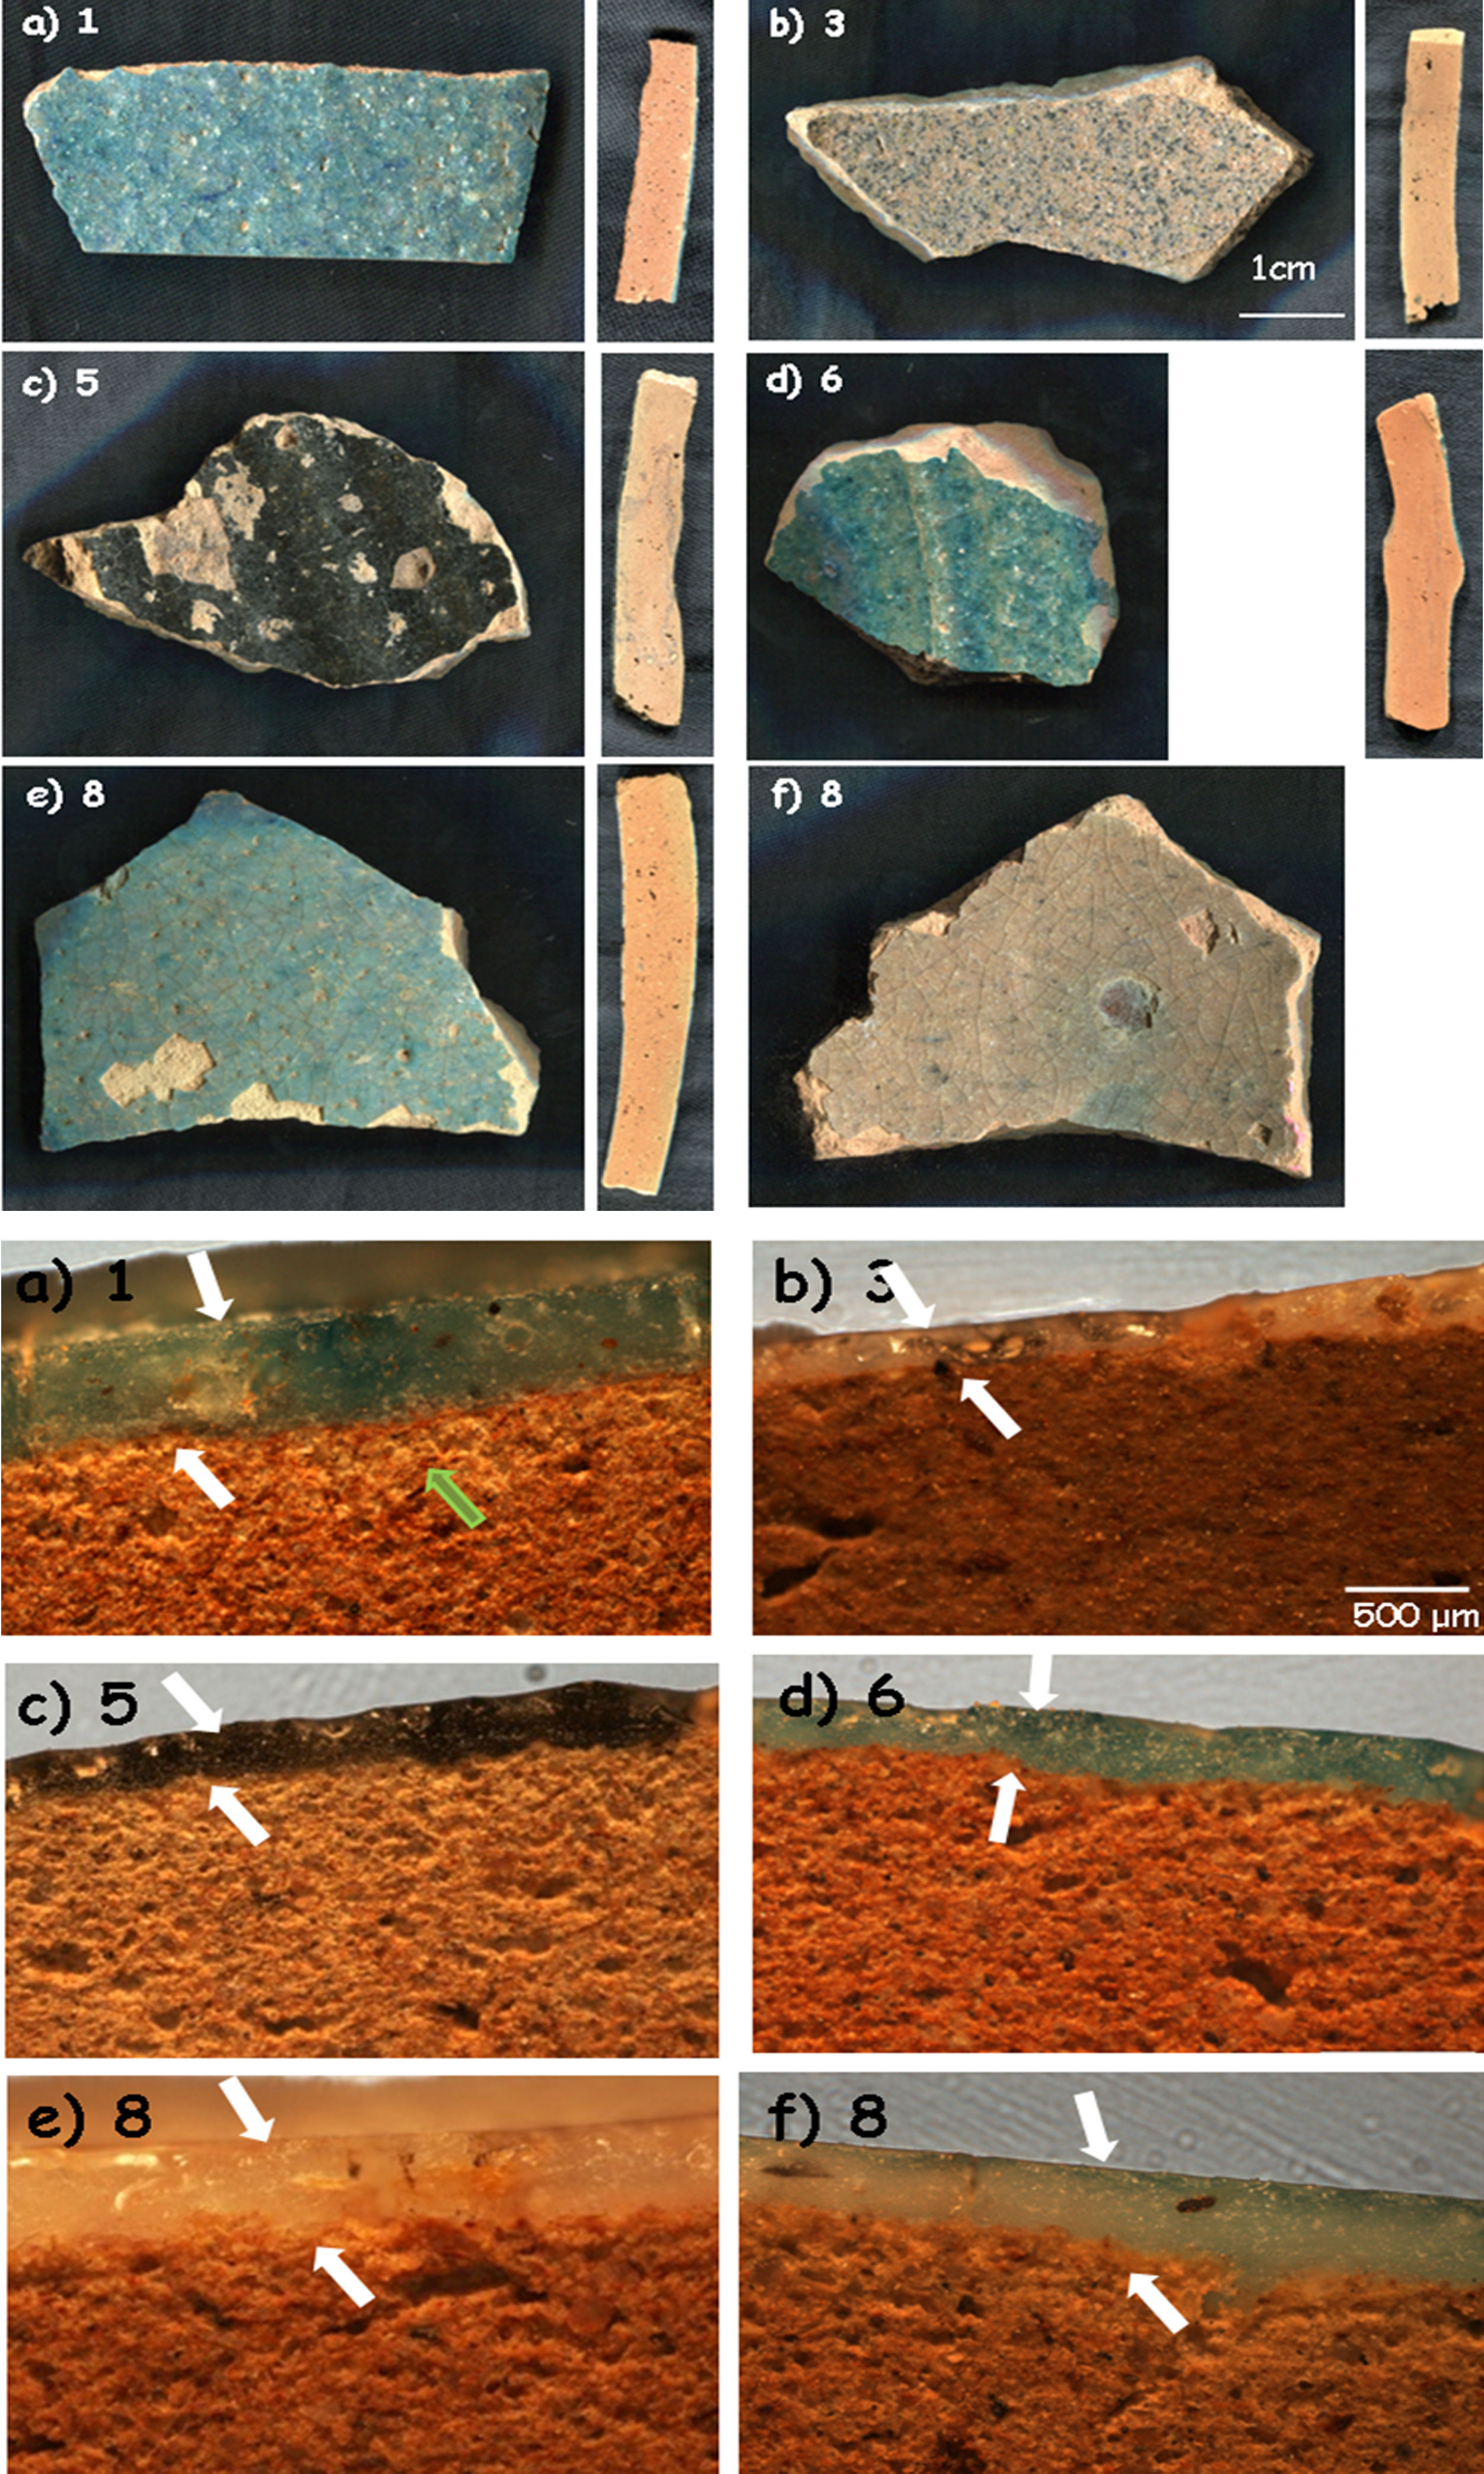
‘Bluespeckled’ samples and corresponding cross sections for (a) 1; (b) 3; (c) 5; (d) 6 and (e and f) 8 shards (see Table 1 for details).
.")
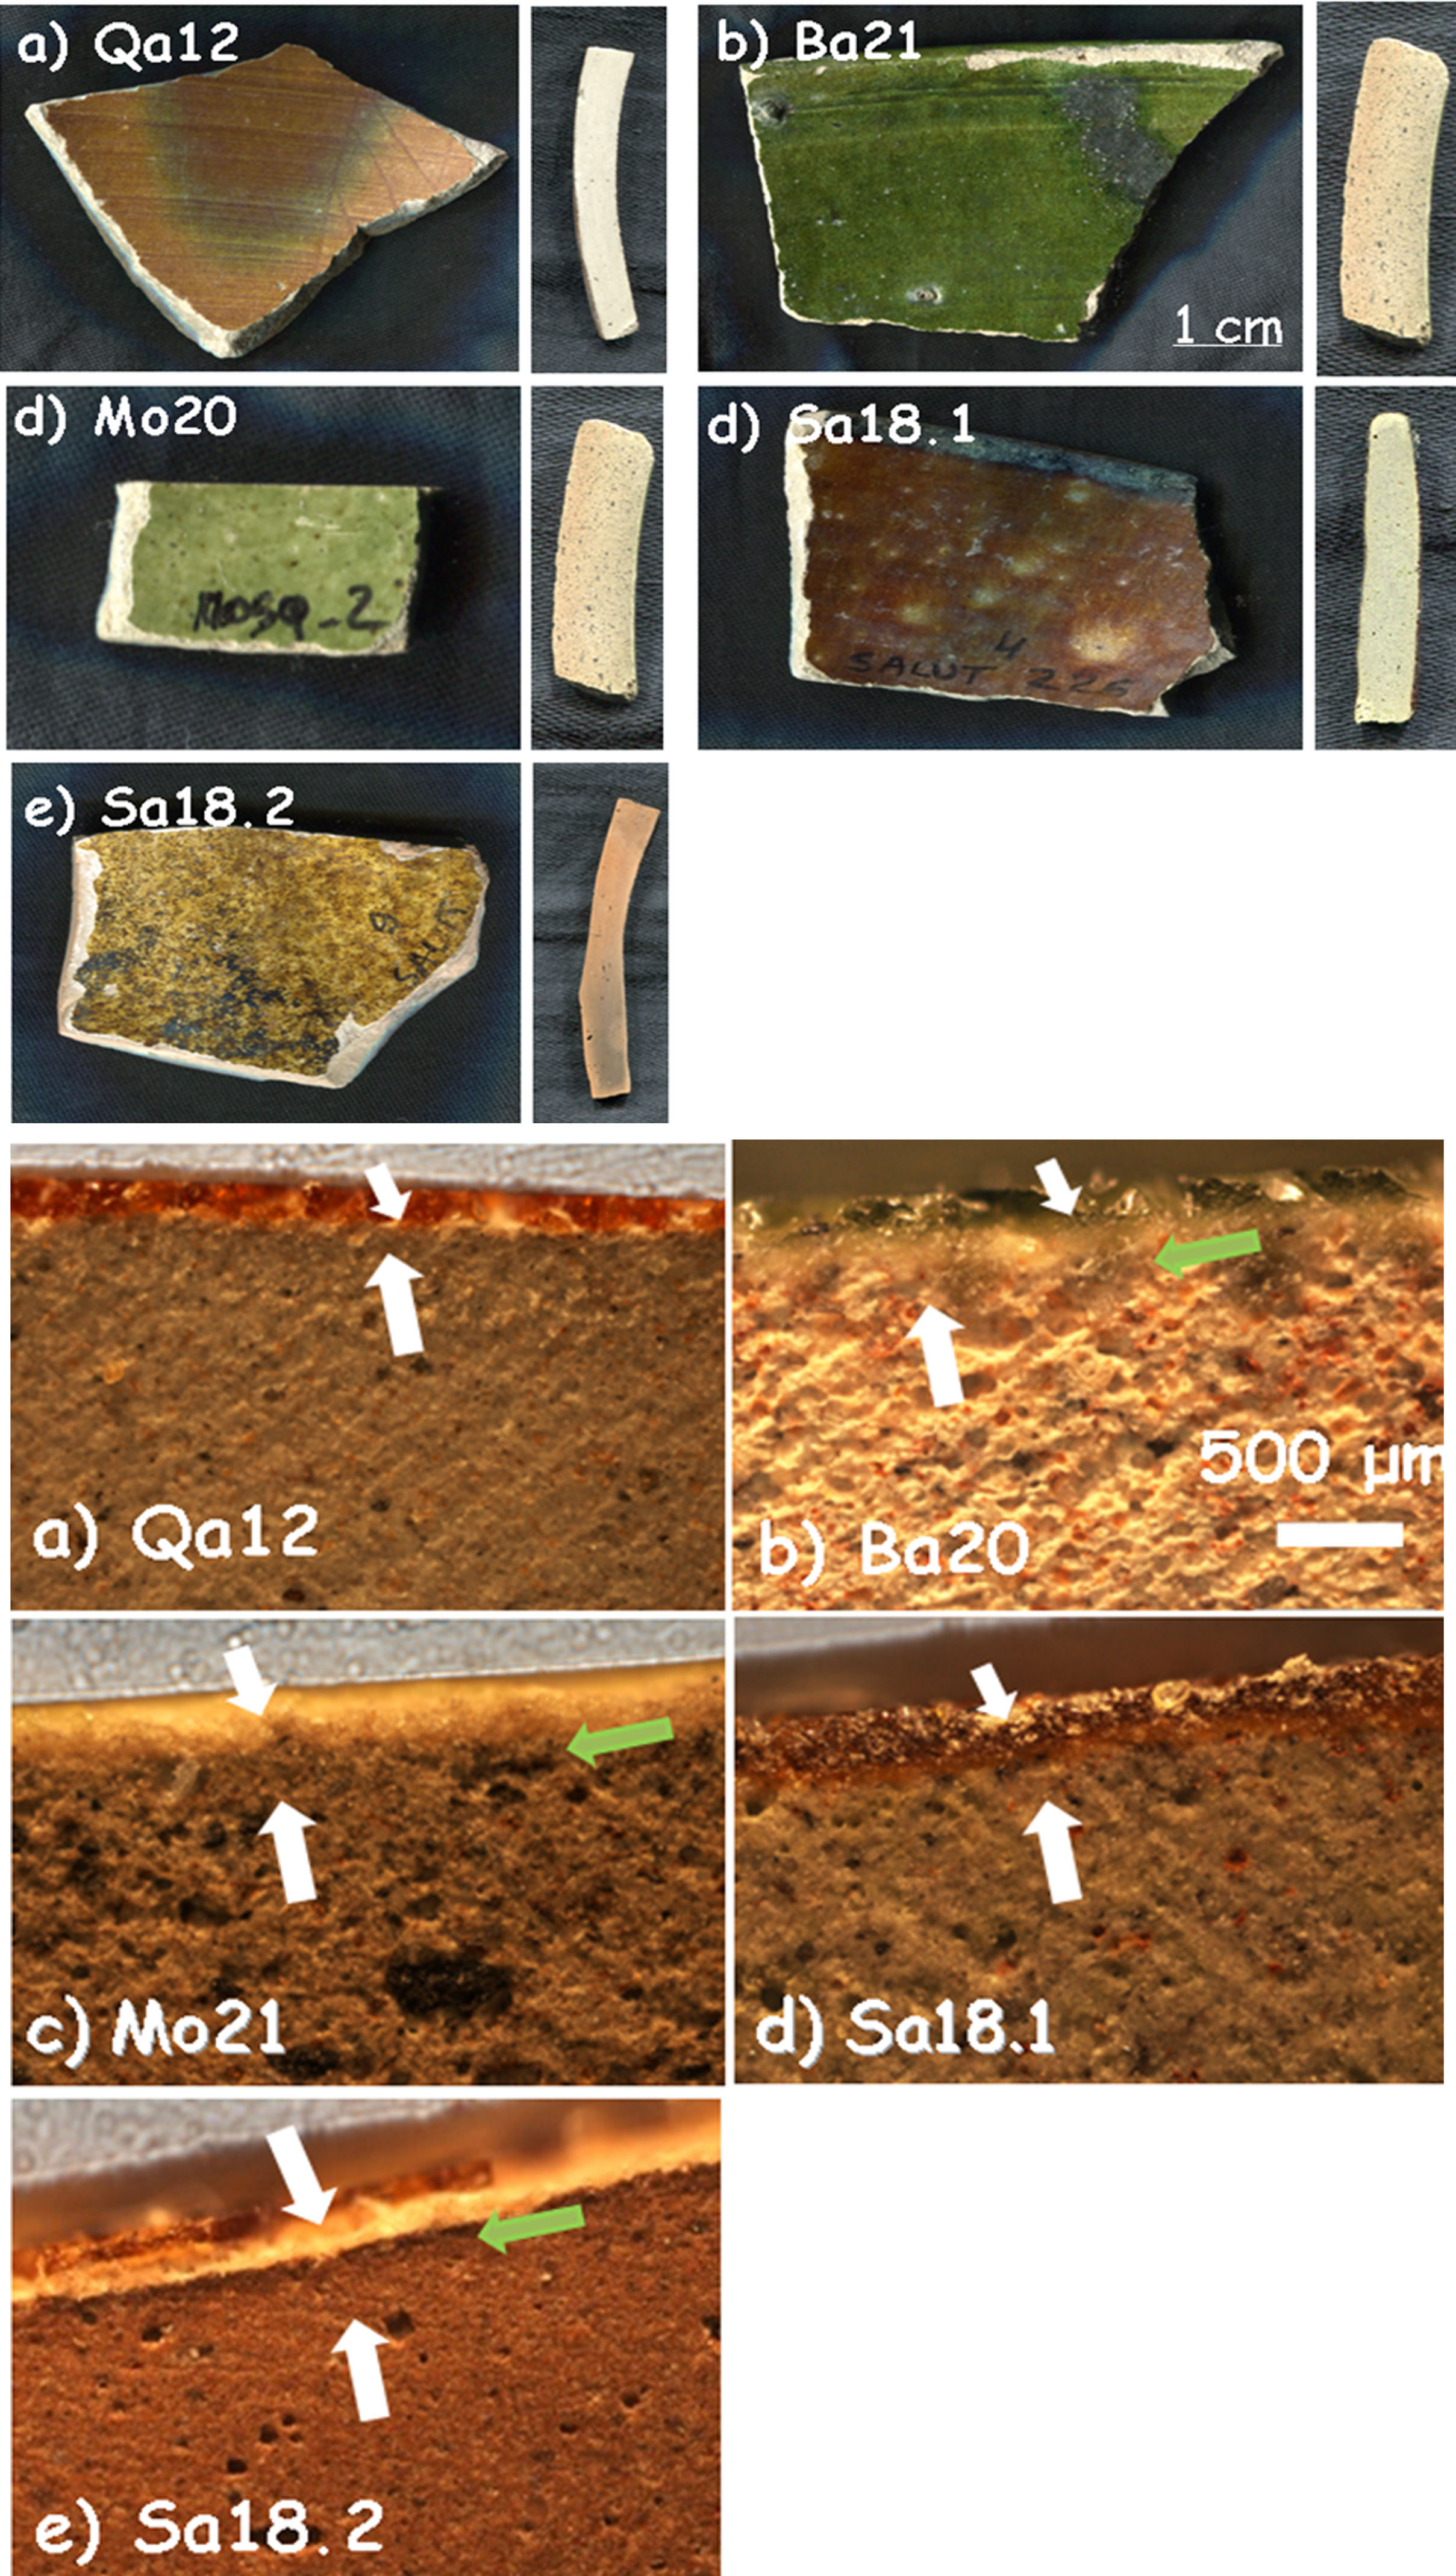
‘Brownspeckled’/green samples and corresponding cross sections for Qa12, Ba21a, Mo20, Sa18.1 and Sa18.2 shards (see Table 1 for details).
‘Bluespeckled’ ware refers to pieces with a medium porous body, generally reddish and a glaze showing a wide variety of shades of blue or green, sometimes pinkish or purple, or greyish and even nearly black (Fig. 1). This glaze is characterized by millimetre dark speckles and is often slightly bumpy. Shapes of pottery are very typical, mostly ranging from wide shallow bowls with a straight lip or, most often, a flange, to jars in part [3]. This ware was found on the coastal sites of Iran, south Arabia, India and East Africa during the 14–16th/17th centuries. It is variously known as ‘Persian Bluespeckled’, ‘Monochrome’ or ‘Bluemonochrome’, and is given a south Iranian origin [6], although a south Arabian production is also sometimes considered [7].
‘Brownspeckled’ wares include a variety of pieces with a rather fine grained, dense body, greyish or light red, sometimes with both colours (Fig. 2). The glaze is brown to green, with millimetre dark speckles, showing orange splashes in a greenish matrix when the body has two colours. It is also common on the late sites of the Persian Gulf area and south Arabia, from the 16th century onwards, and is known as ‘Bahlâ’ or ‘Khunj’ wares [8]. Its origin is under debate, whether from the Oman peninsula where similar pieces are still produced today, or from south Iran, in the district of Khunj in the Hormuz straights where wasters were seemingly identified in the 1970s [9]. Shards of this type are even sometimes (mis)interpreted as of South Asian origin due to the high quality of the body and are often difficult to distinguish by eye sight but two different groups of shapes may nevertheless be individualized, one including flanged plates similar to the ones of ‘Blue speckled’ ware, the other one with rather deep bowls with straight pointed lips as in Qalhât [3], each group possibly testifying a different origin or dating.
The technology of these glazed ceramics seems to be among the simplest one: only one type of (clay-rich) earth or a simple mixture of common clay and sand was sufficient. The elemental and Raman analysis will allow us identifying the glaze type. Some phases, stable in contact with the molten glaze and rare from the geological point of view, as well as some minor or trace elements can be used as provenance markers [10–12]. The green body can then be coated with a glaze-precursor slip and put directly in the kiln [13,14]. This simple technology limits the chance to find specific chrono-technological markers [4]. Firing of terra cotta- and faience-like pottery is generally conducted at a relatively low temperature, between 850°C (apparition of liquid phases activating the sintering) and 1150°C (highest temperature achieved by many kilns), sufficient to form a transient liquid phase that will weld quartz and feldspar grains decreasing the porosity but without developing a significant volume of new phases as observed for stoneware and porcelain [13,14]. Working techniques of traditional potters may have continued using raw materials coming from the same quarries without much change for centuries after the beginning of the exploitation. In this way, comparison with modern and contemporary traditional ceramics can be very informative. Thus, visually similar modern ceramics (19–21st centuries) were collected from Oman sites around Bahlâ which is a well-known pottery production centre, located in inland Oman, about 200km to the northwest of Qalhât and close to the archaeological site of Salut (around 200km from Qalhât and 40km from Bahlâ). The Late Islamic period (i.e. 17th century onwards) Bahlâ wares excavated from Qattara Oasis, close to al Ain city, about 200km northwest of Bahlâ were recently studied [8].
In the present study, a multistep analysis protocol was pursued to obtain comparative information: (i) macrostructure examination of pottery sections and Raman microspectroscopy of glazes and minerals of the body (using the mapping modalities) in association with XRPD, (ii) glaze composition analyzed by SEM/EDXS, and (iii) thermal expansion measurements to determine the firing temperature.
Methods and materialsFive representative ‘Bluespeckled’ and five ‘Brownspeckled’ (one from 13th century and 4 post-mediaeval) shards were selected (Table 1) on the basis of the previous work [3] in which different groups were identified: hundreds of shards have been classified according visual criteria, 65 of them being analyzed by Raman microspectrometry (including 31 ‘Blue and Brown speckled’ shards), plus respectively 58 of them at the laboratory and 41 other at Qalhat site by pXRF. Blue shards represent all the variety of enamels. The good homogeneity of the ‘Brown speckled’ wares observed by archaeologists and the previous work led to the selection of a single mediaeval sample. The selected shards were cut with a saw (Minitom Struers, Denmark) and the cross sections were observed with the optical microscope (BX51 Olympus Microscope, Japan). However polishing liquids generate a strong fluorescence, detrimental to Raman analysis due to the penetration of chemicals in porous body. Porosity was evaluated in an area of 6mm2 per sample using ImageJ software (Olympus). Pore types were classified as a function of their dimension with small (5–50μm), medium (50–100μm) and large (>100μm) size. The number of pores and percentage of three dimension classes (small, medium and large pores) were calculated to obtain the most characteristic porosity dimension for each sample. The bubble number was calculated in the same area of 6mm2 while the mean thickness was extrapolated along the entire sample section.
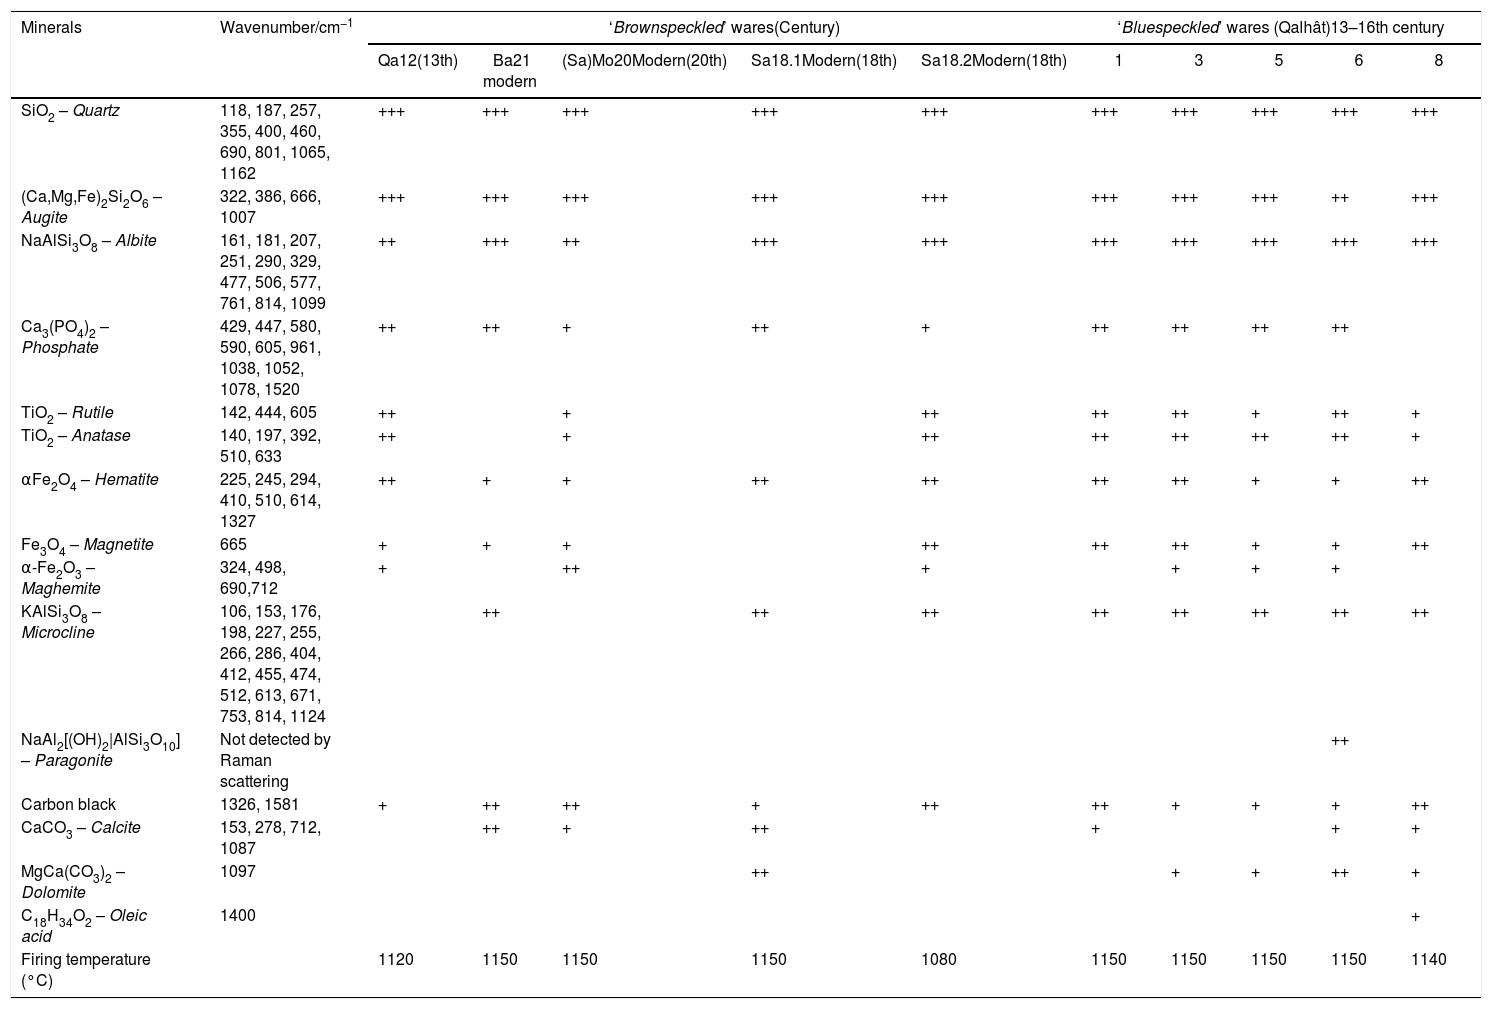
Typical mineral composition of the samples found by Raman microspectrometry and XRPD and their relative Raman signatures (scarce moderate and strong). The amounts were estimated considering the spectrum detected from the analysis of a surface of 1200μm×150μm with steps of 34μm and 3.8μm, respectively (+++, ++ and + mean major, moderate and minor; assignments see references 15, 16, 26 and references herein). Qa, Ba and Sa: from Qalhât, Bahlâ and Salut, respectively.
| Minerals | Wavenumber/cm−1 | ‘Brownspeckled’ wares(Century) | ‘Bluespeckled’ wares (Qalhât)13–16th century | ||||||||
|---|---|---|---|---|---|---|---|---|---|---|---|
| Qa12(13th) | Ba21 modern | (Sa)Mo20Modern(20th) | Sa18.1Modern(18th) | Sa18.2Modern(18th) | 1 | 3 | 5 | 6 | 8 | ||
| SiO2 – Quartz | 118, 187, 257, 355, 400, 460, 690, 801, 1065, 1162 | +++ | +++ | +++ | +++ | +++ | +++ | +++ | +++ | +++ | +++ |
| (Ca,Mg,Fe)2Si2O6 – Augite | 322, 386, 666, 1007 | +++ | +++ | +++ | +++ | +++ | +++ | +++ | +++ | ++ | +++ |
| NaAlSi3O8 – Albite | 161, 181, 207, 251, 290, 329, 477, 506, 577, 761, 814, 1099 | ++ | +++ | ++ | +++ | +++ | +++ | +++ | +++ | +++ | +++ |
| Ca3(PO4)2 – Phosphate | 429, 447, 580, 590, 605, 961, 1038, 1052, 1078, 1520 | ++ | ++ | + | ++ | + | ++ | ++ | ++ | ++ | |
| TiO2 – Rutile | 142, 444, 605 | ++ | + | ++ | ++ | ++ | + | ++ | + | ||
| TiO2 – Anatase | 140, 197, 392, 510, 633 | ++ | + | ++ | ++ | ++ | ++ | ++ | + | ||
| αFe2O4 – Hematite | 225, 245, 294, 410, 510, 614, 1327 | ++ | + | + | ++ | ++ | ++ | ++ | + | + | ++ |
| Fe3O4 – Magnetite | 665 | + | + | + | ++ | ++ | ++ | + | + | ++ | |
| α-Fe2O3 – Maghemite | 324, 498, 690,712 | + | ++ | + | + | + | + | ||||
| KAlSi3O8 – Microcline | 106, 153, 176, 198, 227, 255, 266, 286, 404, 412, 455, 474, 512, 613, 671, 753, 814, 1124 | ++ | ++ | ++ | ++ | ++ | ++ | ++ | ++ | ||
| NaAl2[(OH)2|AlSi3O10] – Paragonite | Not detected by Raman scattering | ++ | |||||||||
| Carbon black | 1326, 1581 | + | ++ | ++ | + | ++ | ++ | + | + | + | ++ |
| CaCO3 – Calcite | 153, 278, 712, 1087 | ++ | + | ++ | + | + | + | ||||
| MgCa(CO3)2 – Dolomite | 1097 | ++ | + | + | ++ | + | |||||
| C18H34O2 – Oleic acid | 1400 | + | |||||||||
| Firing temperature (°C) | 1120 | 1150 | 1150 | 1150 | 1080 | 1150 | 1150 | 1150 | 1150 | 1140 | |
Raman microspectroscopy was performed using a LabRam Infinity spectrometer (Dilor, France) coupled to a BX Olympus microscope with different long working distance objectives (×10, ×50 and ×100), equipped with a Nd:YAG green laser (532nm). For the homogenous glazes, analyses were first conducted with ×10 objective in order to obtain a rapid characterization of different phases. Scans with Raman map modality were made at ×50 magnification in a rectangular 150μm×1200μm area. Steps and number of spots analyzed were fixed both for X (3.8μm) and Y (34μm) direction. Each spectrum was acquired with duration of 8s and 3 accumulations. The elaboration of the maps was pursued using Labspec software (Dilor, France) extrapolating and identifying the different mineral phases present in the surface analyzed.
X-ray powder diffraction (XRPD) patterns on cut shards with two parallel sides were recorded using a SmartLab diffractometer (Rigaku Corporation). CuKα radiation was used. The diffractometer was equipped with a β filter and D/teX Ultra 250 detector. Data were collected between 5 and 70°2θ at every 0.01° in Bragg-Brentano geometry. The scan speed was 5°/min and slit configuration included 0.5° incident slit, 10mm length limiting slit, #1 20mm and #2 20mm reciving slits. All specimens were rotated with 30–60rpm speed during data collection. PDXL 2 software (Rigaku Corporation) was used for powder diffraction data analysis [15].
Elemental composition and images were obtained with a JEOL 5410LV SEM-EDX using an acceleration voltage of 20kV. Quantitative elemental analysis (in oxides) with Iridium Ultra software used the ZAF calculation method. Validity of the measurements was monitored by applying the same procedure to certified glass-reference samples “Corning Museum B, C and D” and “American National Bureau of Standard (NBS 620)”, as usual [16]. The error is below 5% for major oxides and below 10% for the others.
A vertical dilatometer (SETARAM, France) was used for thermal expansion analysis. Alumina rod with support and N2 atmosphere were used. The samples were cut with the diamond saw (thickness ∼3mm) and measurements were made perpendicular to the section in order to limit the sticking between the samples and the rod and support because of the melting of the glaze. With this orientation, only the thermal expansion of the paste was measured. Each sample underwent three thermal cycles from room temperature to firing temperature with a rate of 10°C/min. The sintering temperature was estimated for the first series of measurements and serves as maximal heating point [17]. If the sintering temperature was not achieved (characterized with a strong contraction), a second series of heating was made again up to a temperature 20°C higher than the previous run, and so on, up to obtain the clear signature of sintering; the last heating run hence give the firing temperature achieved at the production step. The normalized thermal expansion/contraction curve was obtained by dividing the expansion with the thickness of the sample, starting from 200°C to eliminate perturbation related to the proximity with the lowest temperature thermostat.
A limited number (10) of representative shards were chosen regarding visual criteria based on the examination of thousands of them as well as the examination of Raman spectra of tens of them [3].
‘Blue speckled’ pottery: The five samples which have been selected (Fig. 1) are representative of shards classified as ‘Bluespeckled’. Some samples are grey (Fig. 1b and f) and even dark (Fig. 1c). Sections of the body parts look very similar but different from those of ‘Brownspeckled’ ware (Fig. 2). The glaze thickness is about twice of that measured on ‘Brownspeckled’ ware and the glaze quality looks much better. The body is homogeneously red in the core and develops a thin intermediate zone at the glaze-body interface. Sample 3 presents a transparent grey glaze on both sides of the shard on a homogeneous red body (Fig. 1b). Sample 5 (Fig. 1c) was selected for it represents a common black opacified glaze found at Qalhât. The glaze is on both sides of the sample. The body shows a red core and lighter-coloured external parts (Fig. 1c). Sample 6 (Fig. 1d) has a blue glaze, similar to that of sample 1, but only on the outside. The last sample (8) is characterized by the glaze on both sides but with different colours: blue on the outside and grey inside, both rather well transparent (Fig. 1e).
‘Brown speckled’ pottery includes pottery with brown, ochre and green glazes (Fig. 2). This type of shards belongs to the most commonly found pottery types in later levels at Qalhât site [3]. The old sample Qa12 is characterized by a monochromatic satin brown glaze on both sides of the shard (28 similar samples have previously been studied by Raman and 4 of them by XRF [3]). In the cross section, the body appears to be homogenously grey with traces of wheel-throw lines, likely due to the poor plasticity of the wheeled matter. The other samples are more recent and come from the region of Bahlâ where pottery kilns still produce a similar type of ware: three come from a ruined village (Sa18.1 and Sa18.2) and a nearby ruined mosque (Mo20) close to the ancient Iron Age site of Salut, about 40km from Bahlâ, and may be dated to the 19–20th centuries; the last one comes from Bahlâ itself (Ba21) and may be dated to the 20–21st centuries. The glazes are monochromatic and translucent overlying both sides of the samples except for Mo20 and Sa18.2 which have a glaze on only one side. Sample Sa18.2 has an ochre satin glaze. Sample Mo20 is covered by a slight green glaze whereas sample Ba21 is covered by an intense vivid green glaze. Glaze sections of samples Qa12 and Sa18.1 as well as Mo20 and Sa18.2 look very similar.
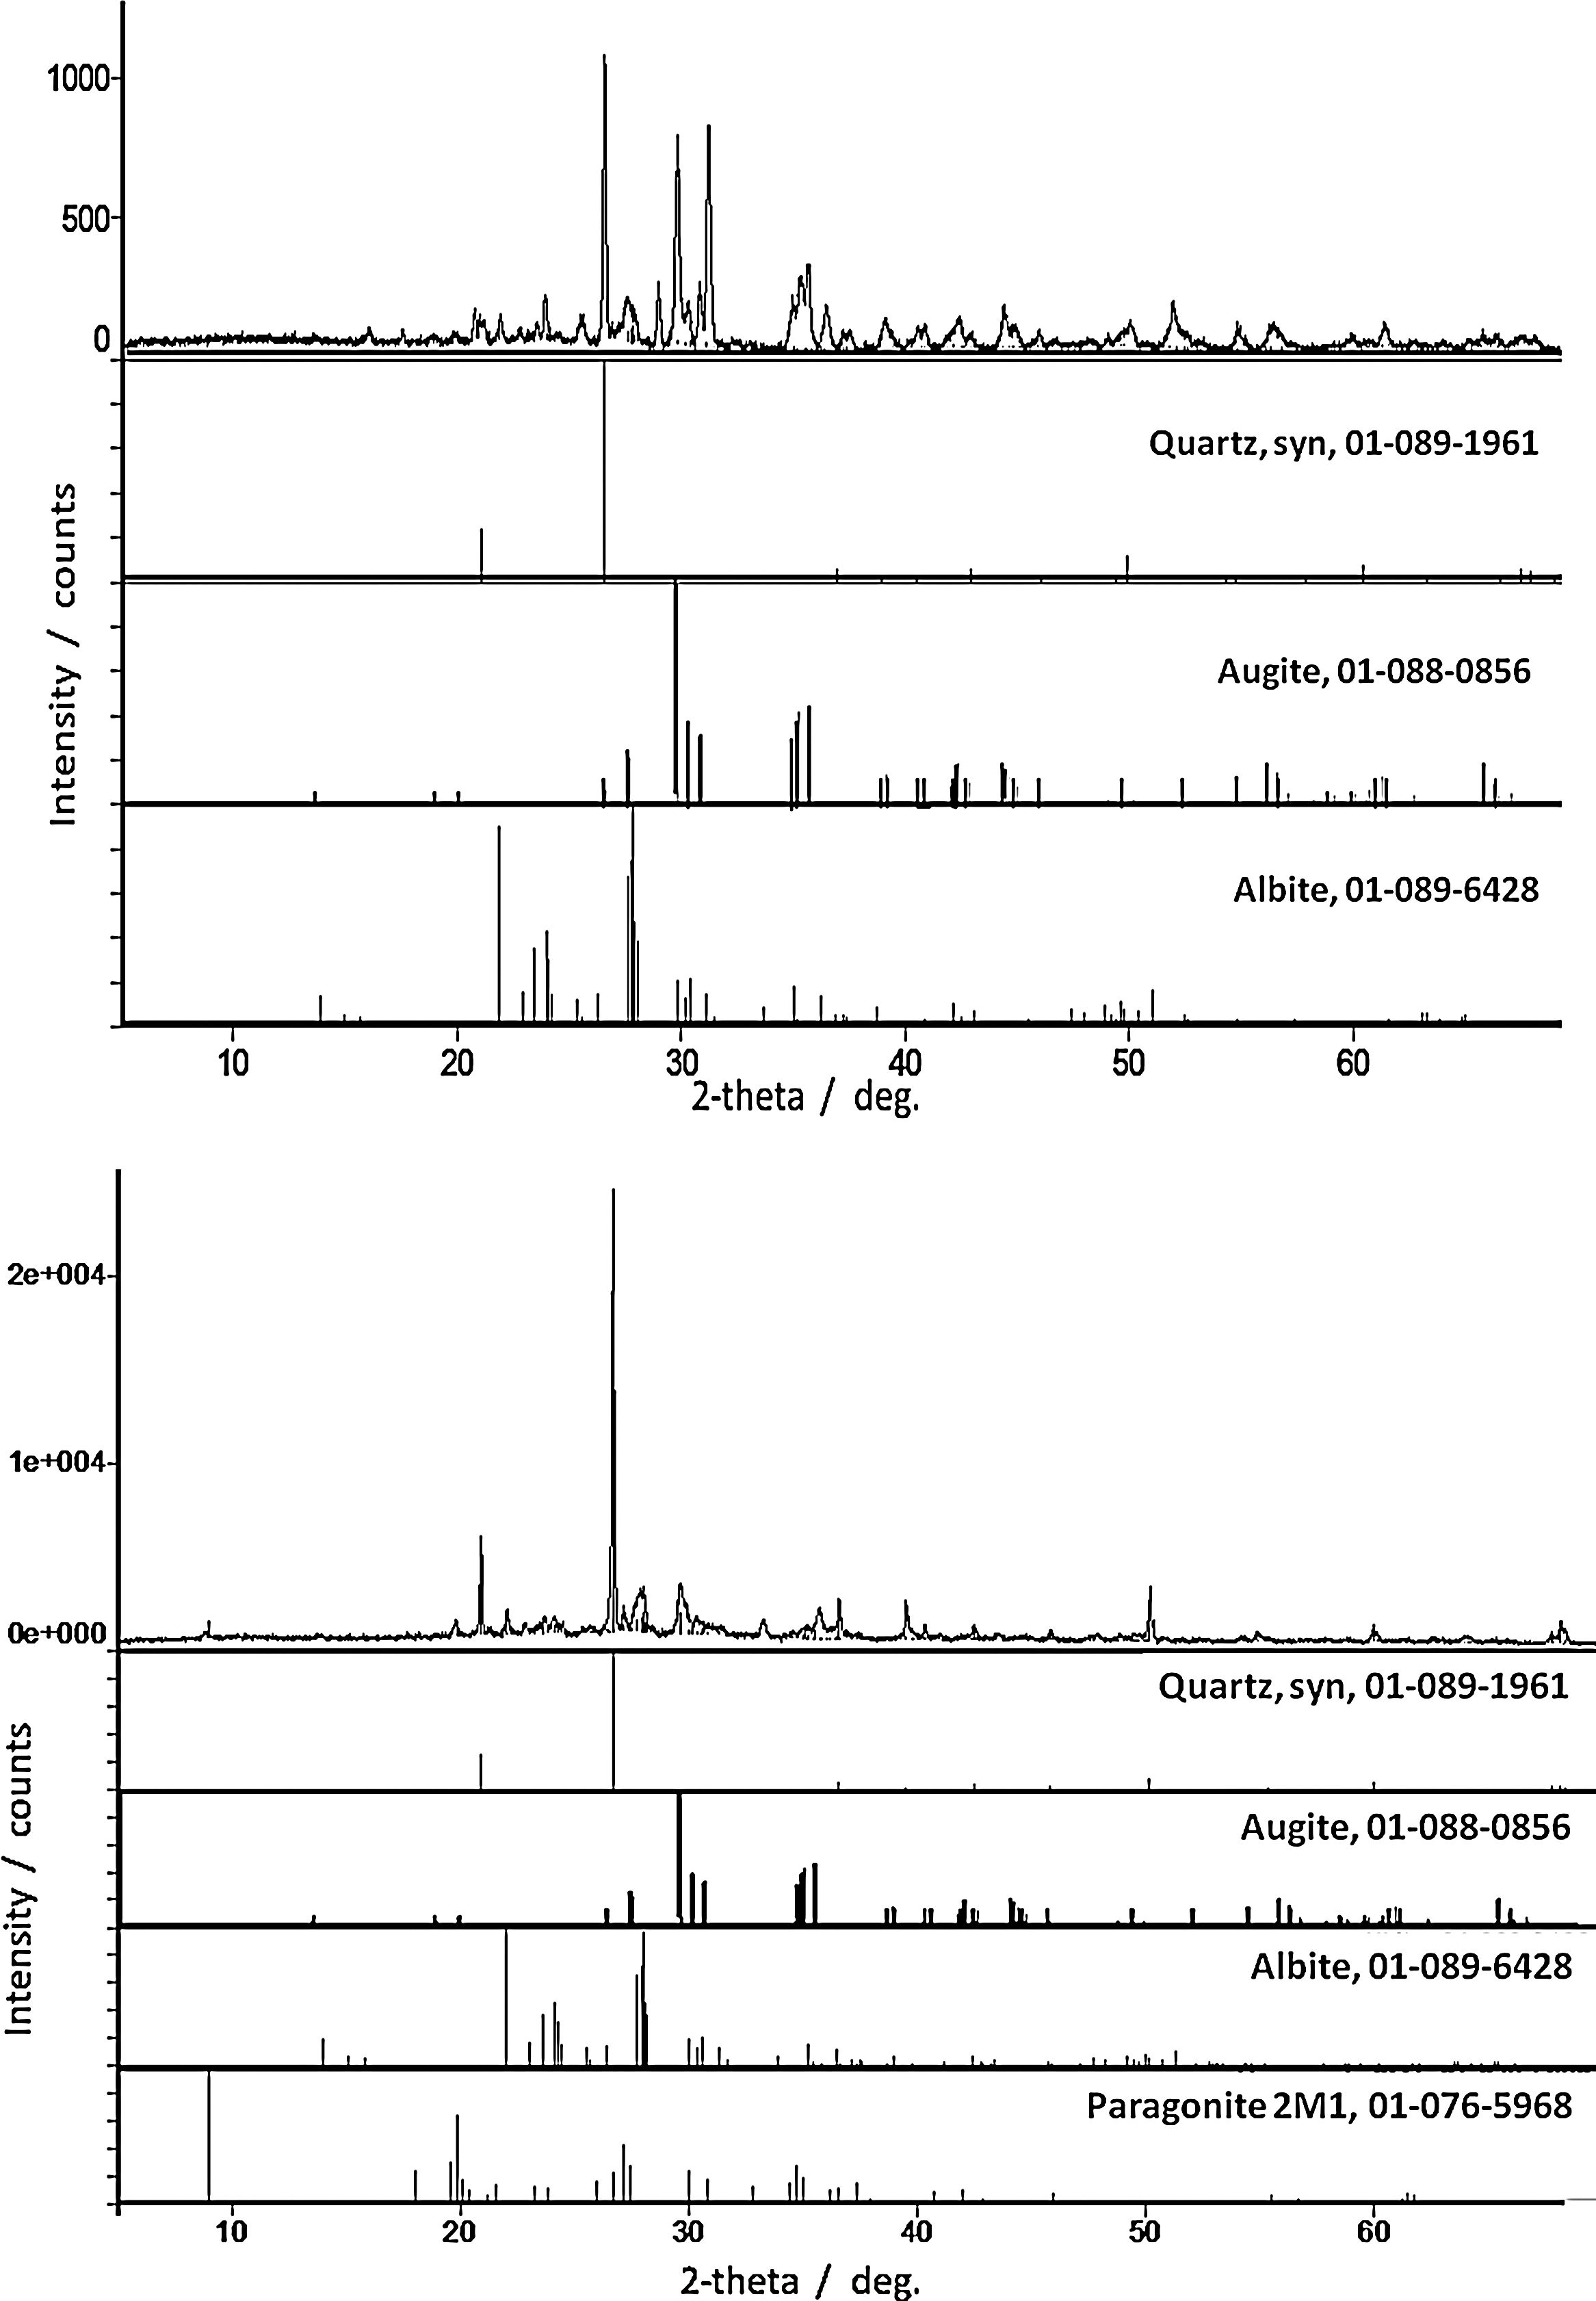
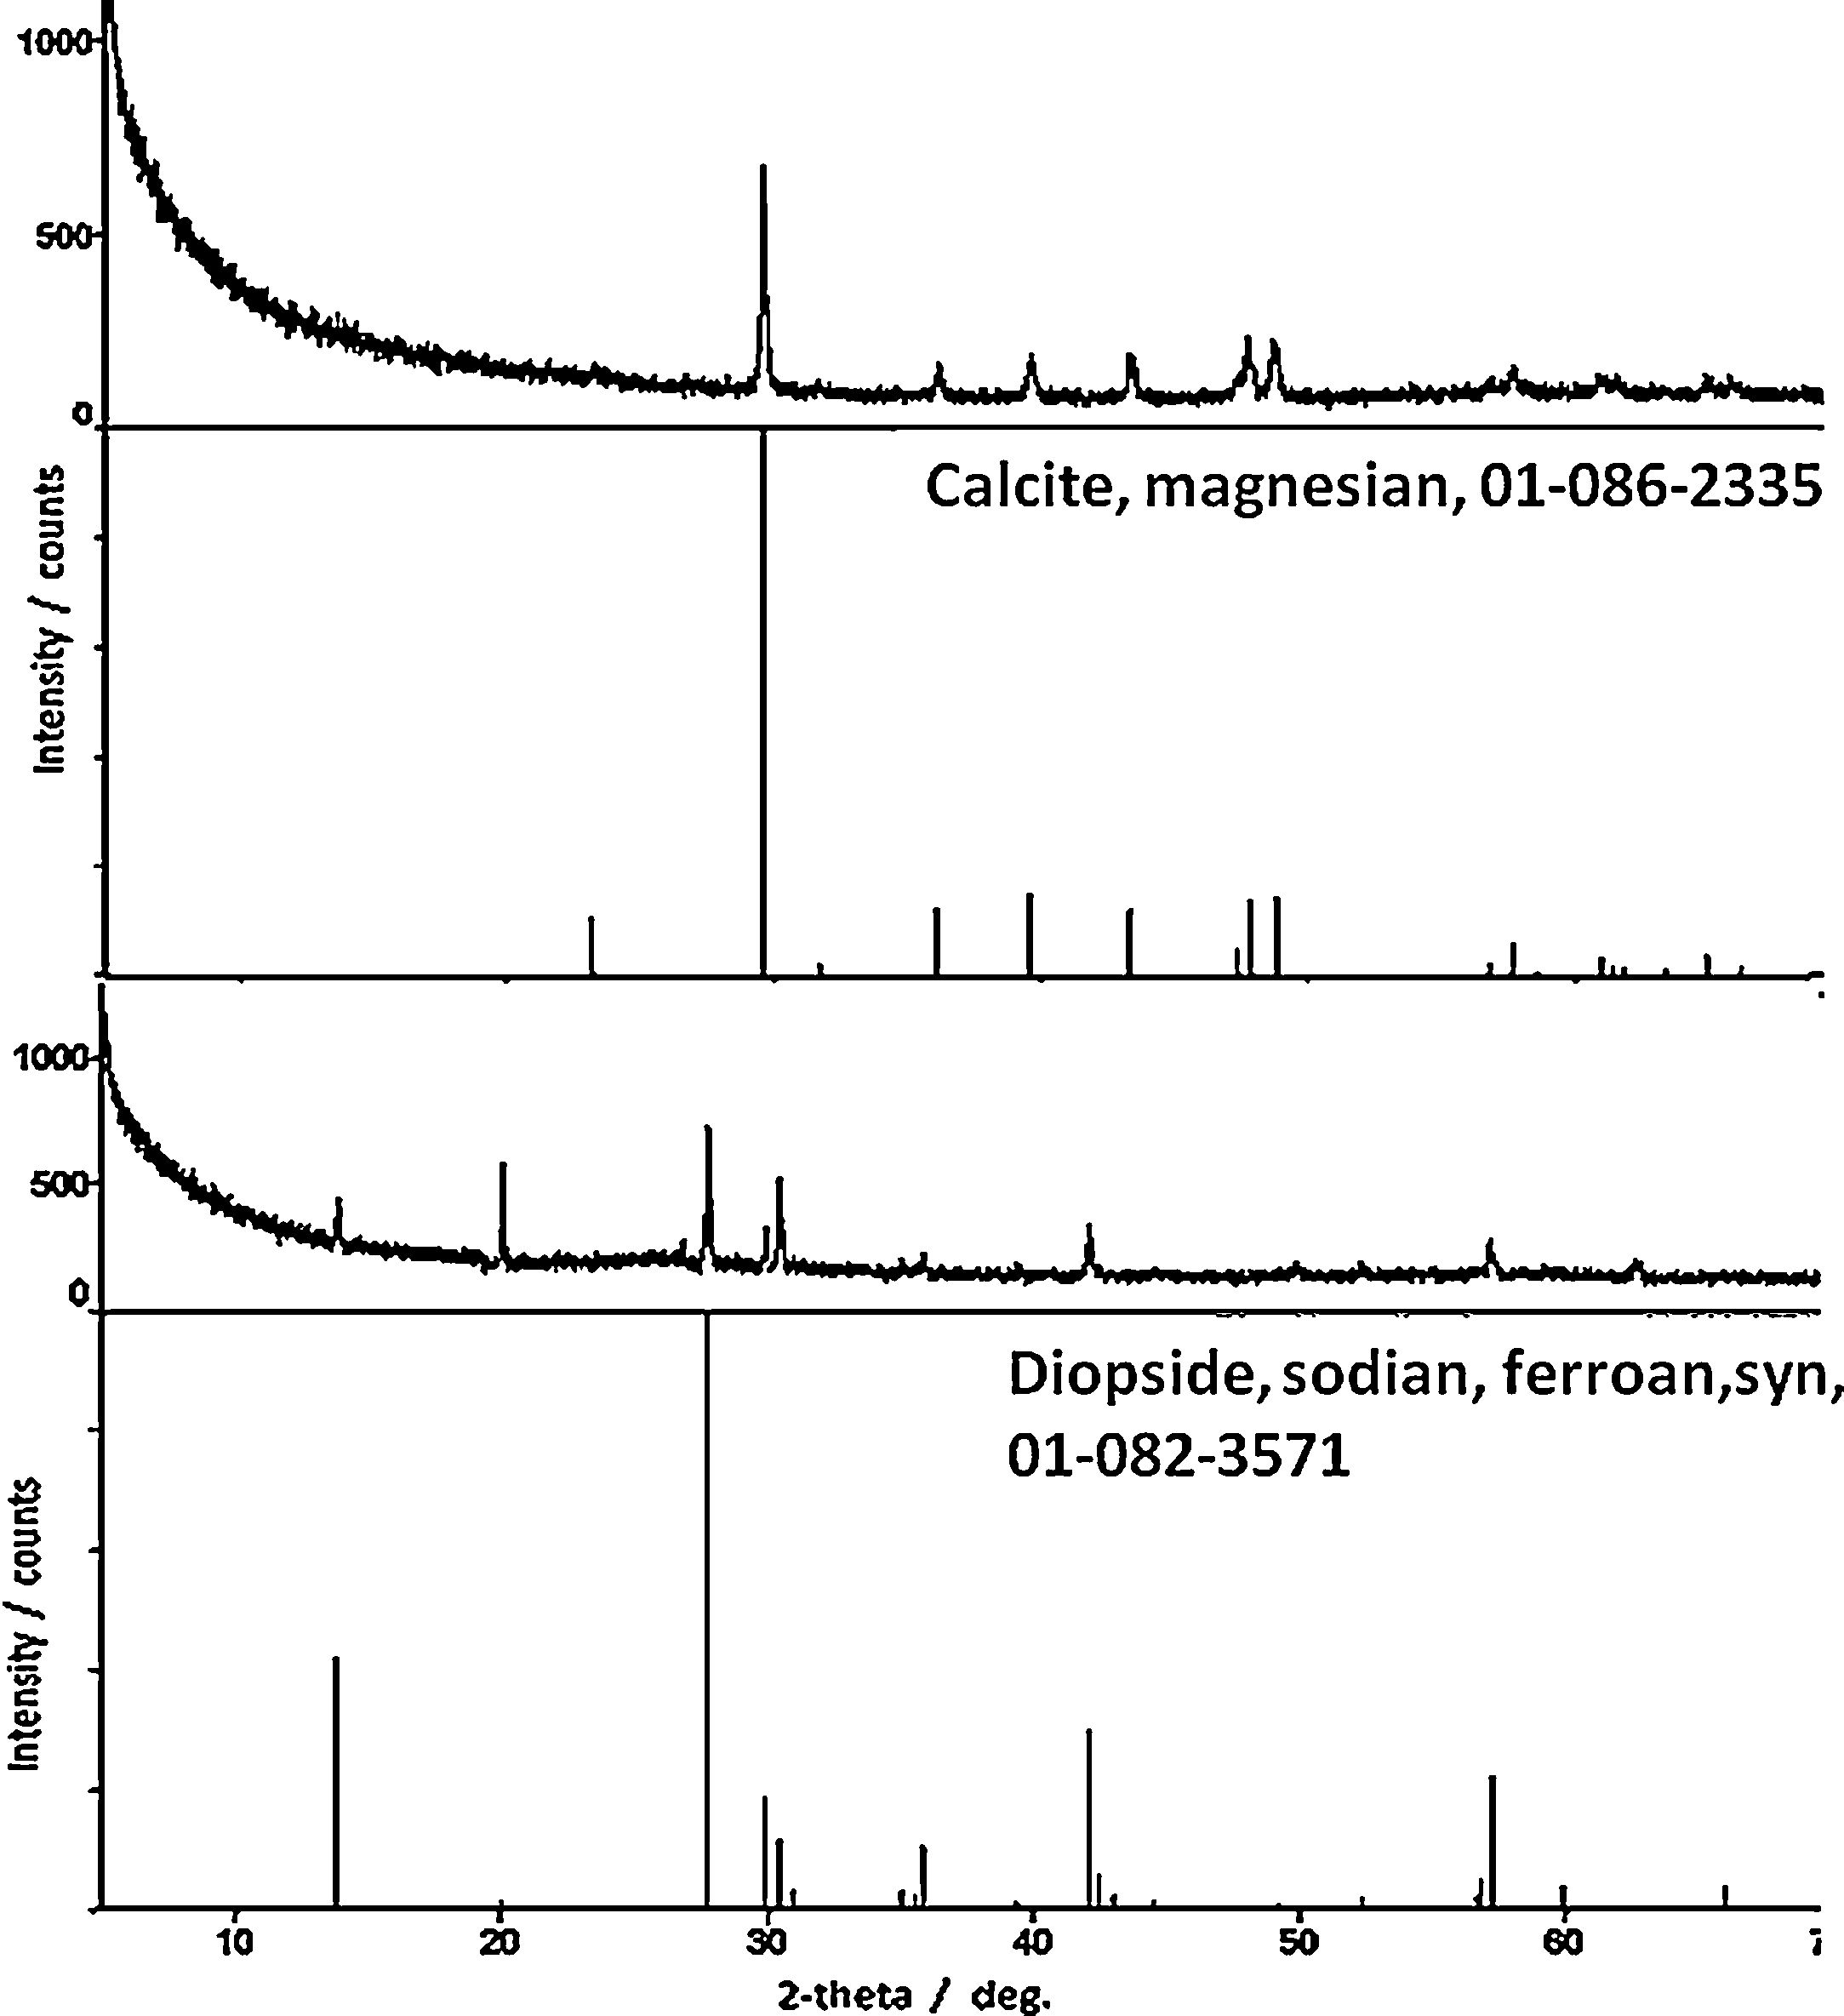
ResultsPhase identificationFor all samples of the two groups, XRPD patterns show the presence of three abundant mineral phases (Fig. 3): quartz (SiO2, PDF # 01-089-1961), augite (a pyroxene, (Ca,Mg,Fe,Ti,Al)2(Si,Al)2O6, PDF # 01-088-0856) and albite (a plagioclase feldspar, NaAlSi3O8, PDF # 01-089-6428). Only sample Qa12 contains quartz as the abundant mineral with augite and albite as moderately to minorly present minerals. Differentiation of the old Qa12 sample is thus obvious. Minor amount of paragonite 2M1 (a mica, NaAl2[(OH)2][AlSi3O10], PDF # 01-076-5968) was undoubtedly observed in sample 6. XRPD patterns for samples Ba21 and 6 are presented in Fig. 3. Due to the similarity with these results, XRPD patterns of the other pottery samples are not presented. Glaze and sub-glaze inter face layer for sample Ba21 is presented in Fig. 4. Amorphous XRPD patterns are usually obtained for glazes coloured in green or blue. However, for sample Ba21, two mineral phases were noticed such as diopside (CaMgSi2O6, PDF # 01-082-3571) (as reported in [8] for Late Islamic Arabic period productions) and calcite (CaCO3, PDF # 01-086-2335) (not reported in [8]). Mineral phases with minor amounts which were detected by Raman analysis (see further) were not detected by XRPD. Furthermore, from XRPD patterns, the content of each mineral phase could be estimated to be less than 5%.
 and 6 (bottom). Indexed phases of quartz (PDF# 01-089-1961), augite (PDF# 01-088-0856), albite (PDF# 01-089-6428) and paragonite 2M1 (PDF# 01-076-5968) are presented in the form of straight intensity lines at the bottom.")
 and calcite (PDF# 01-086-2335) are presented in the form of straight intensity lines at the bottom.")
Previous methodological investigations have demonstrated that Raman mapping could be more efficient than X-ray powder diffraction to identify the minor phases [11,12]. However, XRPD gives a more realistic view of the major crystalline phases. All results are summarized in Table 1.
‘Blue speckled’ waresBody: Samples of ‘Blue speckled’ group look rather similar with their red bodies. Examination of the cross sections (Fig. 1) showed that samples 5 and 8 appear darker (more red) in the core of the section and lighter towards the two sides, suggesting different firing conditions than the others. The number of pores and their dimensions were calculated by the observations under the optical microscope and the images taken at low magnification. Considering the number of pores present in the same area, bodies of the samples turn out to be similar with a medium level of porosity (24–58 pores per unit area) with the exception of sample 3 which is more compact; 24 pores were calculated for samples 1 and 8 while samples 5 and 6 Exhibit 58 and 40 pores per surface unit, respectively. The percentage of the pore size in all samples is comparable: around 60% large pores, around 25% medium pores and around 10% small pores. Sample 5 has a lower percentage (2%) of small pores and sample 3 differs from the others with the total absence of pores in the area considered. The dimension of the smallest pores is similar whereas some differences in the large pores were found. However, distribution of the pore size is analogous. Thus, macrostructures are very similar, except for sample 3 where the pore size is much smaller indicating a higher firing temperature or the use of finer particles or a composition with more flux. Regarding the body, no specificity can be identified for sample 5 which is assigned to a potential production of Iran on the basis of visual examination.
As reported above, the most frequent Raman spectrum collected in mapping analysis is assigned to quartz (SiO2, 460cm−1Table 1). The presence of dolomite is also confirmed by Raman scattering. The unusual presence of phosphate in almost all the samples is worth mentioning (except for sample 8), with the characteristic P-O mode peak at ∼960cm−1. This phase may arise from minerals or more likely from ashes of animal residues (dried animal dung) or contamination (soil, ingredients kept in the pottery). It should be noted that fish head and bone residues, likely used as fuel (due to oil-rich content) have been found close to Qahlât kilns [2]. Thus, pottery exhibiting a high level of phosphate such as samples 3 and also Qa12, Ba21, Sa18.1 may have been produced using similar raw materials and/or technology or may have had similar use. Only sample 8 does not exhibit the phosphate signature. Also, in all bodies of ‘Bluespeckled’ ware, frequent titanium oxide polymorphs such as anatase (140cm−1) and rutile (444 and 605cm−1[11,12]) are present, suggesting firing temperatures below 1200°C (i.e. under the temperature requested for the complete transformation of anatase into rutile from ∼900°C for nanometric grains to ∼1200°C for coarse grains). Anatase is abundantly present in samples 1,3,5 and 6. The rare presence of rutile was detected in samples 3, 5 and 8 (like in Mo20 and Sa18.2; totally absent in Ba21 and Sa18.1, see further (Table 1)).
Hematite (α-Fe2O3, 225–294 and 1327cm−1) and magnetite (Fe3O4, 665cm−1) [11,12] were found in all the samples (abundant in samples 1, 3 and 8), confirming the use of oxidizing firing atmosphere (as proposed by the observations of different colours between the core and sides of cross sections) while maghemite (γ-Fe2O3, 690cm−1) was detected in samples 3, 5 and 6. Maghemite transforms into hematite by heating above 800°C. Augite ((Ca,Mg,Fe)2Si2O6, 1006-666-388-320cm−1[11,12]) was only clearly found in sample 1 (like sample Sa18.1). Albite (NaAlSi3O8, 506-477-329cm−1[11,12]) and microcline (KAlSi3O8, 1124-613-512-474-455-412cm−1) are commonly observed. Calcite (CaCO3, 1087cm−1) and dolomite (MgCa(CO3)2, 1097cm−1[11,12]) present in some of the samples propose lower firing temperatures (below 1200°C). Traces of organic molecules (oleic acid, around 1400cm−1) probably resulted from food storage in the vessels or were found in sample 5.
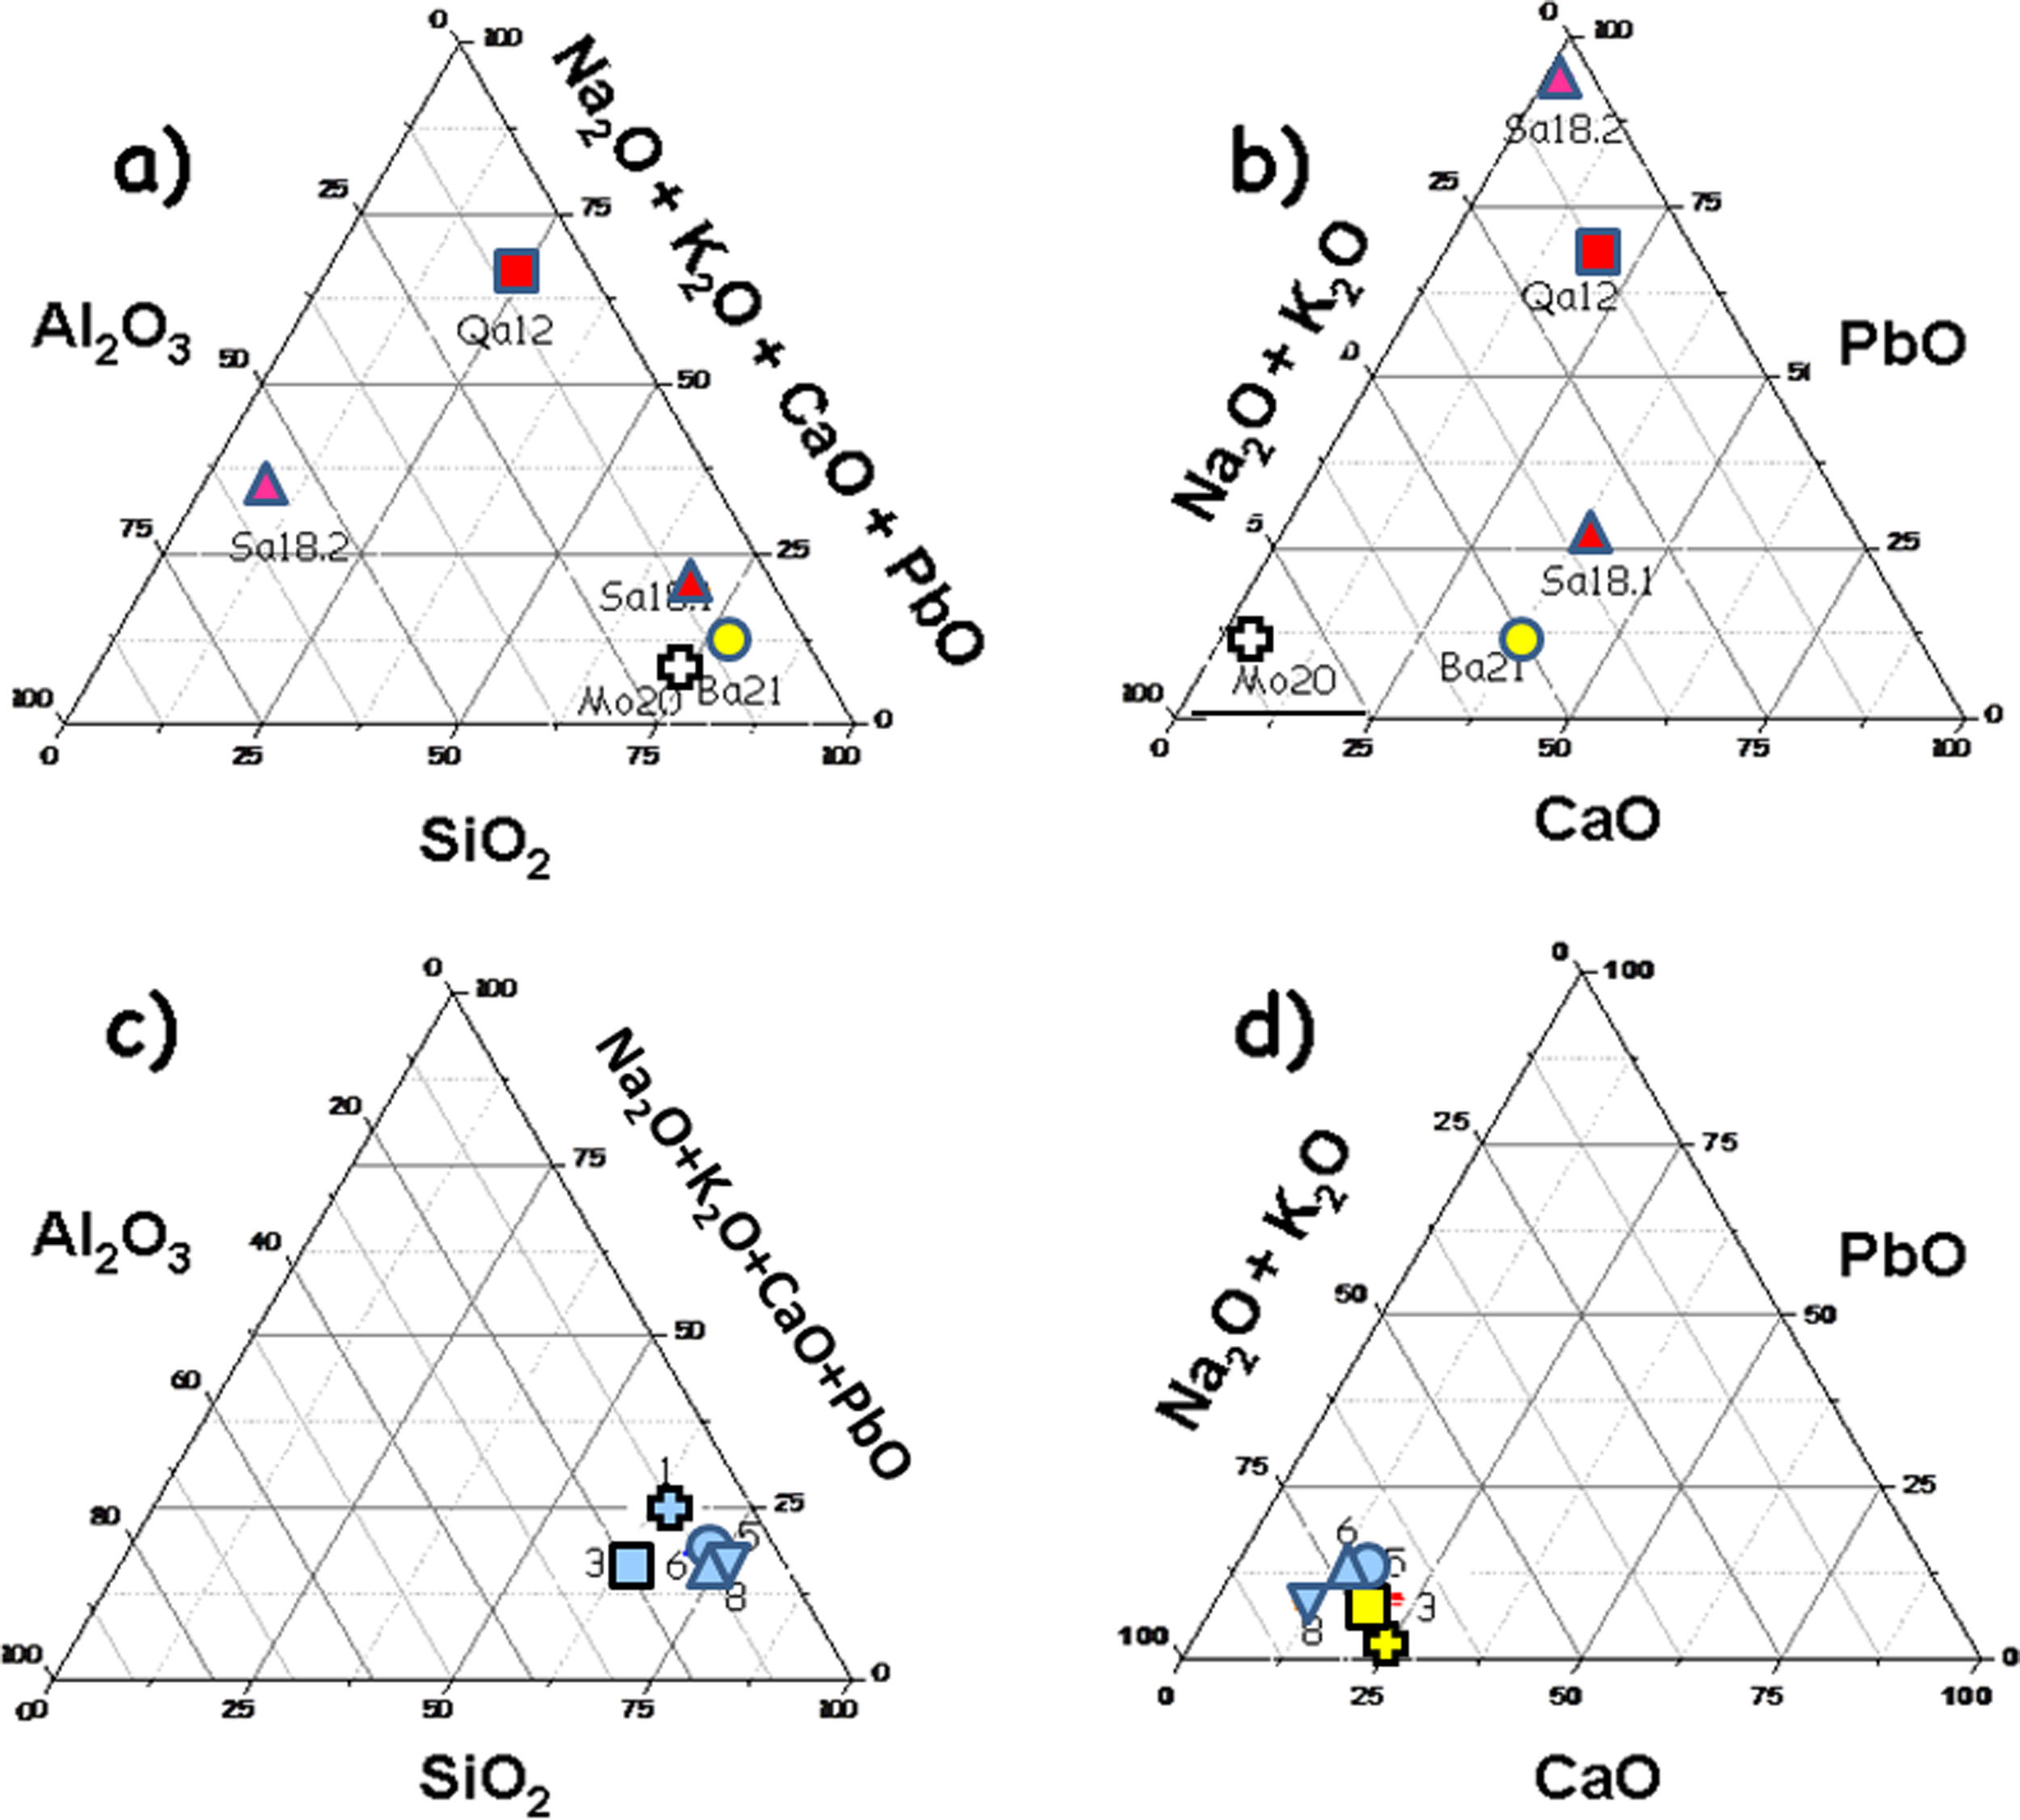
Glazes: Fig. 1 compares the cross sections of the shards. Compositions of the glazes are compared in Fig. 5. Glazes of samples 3 (Fig. 1b), and 8 (Fig. 1e and f) show a heterogeneous dispersion of the blue colour. Composition analyses (Fig. 5) show that Cu2O content ranges between 0.3 (sample 3) and 1.62wt% (sample 5). SnO2 content is relatively high (1.2–1.9%), in agreement with the possible use of bronze residues (cassiterite was not detected by Raman scattering, thus tin was dissolved within the glaze network and did not opacify). This could be due to the mixing of colourless and coloured glazes (anima/corpo technique) which could be consistent with the importation of the raw materials used for preparation of the glaze (or of the glaze powder) and the speckle distribution. Some bubbles were found in the glazes of samples 1, 3 and 5, which indicate the reaction with the body, suggesting a single step firing process of an enamelled green body. The number of bubbles for unit area is similar as well as dimensions of the pores for samples 1 and 5 while larger bubble diameters were measured for sample 3 (richer in alumina). No bubbles were observed in the glazes of samples 6 and 8 with ×5 magnification. The thicknesses of glazes are comparable for the top and bottom sides (Table 1) as well as between all the glazes. The above-mentioned technological differences (presence of bubbles, colour dispersion and mono- or multistep firing) may correspond to different productions (place or time?) or even different locations in the kiln, the gradient of temperature being rather big in an ancient kiln. The highest Cu2O content of the glaze of sample 5 explains the darker colour but no other significant differences were found regarding the body. As it can be seen in Fig. 5, the composition of all glazes is very similar, except the alumina concentration of sample 3 which is a little higher. Also, the variable content of potassium, an important criterion already noted in a previous study [3], should be noted (K2O=2.65 oxide wt% for sample 1; 4.32 for sample 3; 5.18 for sample 5; 3.5 for sample 6; 4.57 for sample 8). However, this is not associated to a high level of magnesium (MgO<0.6 oxide wt% for samples 1, 5, 6 and 8; 2.2–2.3 oxide wt% for sample 3) which could suggest the use of ashes as flux. The equal concentration of titanium (TiO2=0.3–0.6 oxide wt%) let us suppose the same type of sand as well as the comparable concentrations of barium (BaO=0.3 oxide wt% for samples 1, 5 and 8; 0.5–0.7 oxide wt% for samples 3 and 6). The glazes also contain a small amount of lead oxide (PbO=1–2wt% for samples 1, 3, 8; 2.5wt% for samples 5 and 6), tin oxide (SnO2∼1.8wt%) and copper oxide (Cu2O=<0.4wt% for all samples except 1.6wt% for sample 5). It should also be mentioned that cobalt was not detected in the glazes by SEM-EDXS, the turquoise colour being only due to Cu2+ ions. There are no arguments to discriminate sample 5 from the others and it can be concluded that all glazes are identical with a single origin of production.
 and ‘Bluespeckled’ wares (c, d); (a) and (c): refractory oxide content vs. flux, (b) and (d): flux composition.")
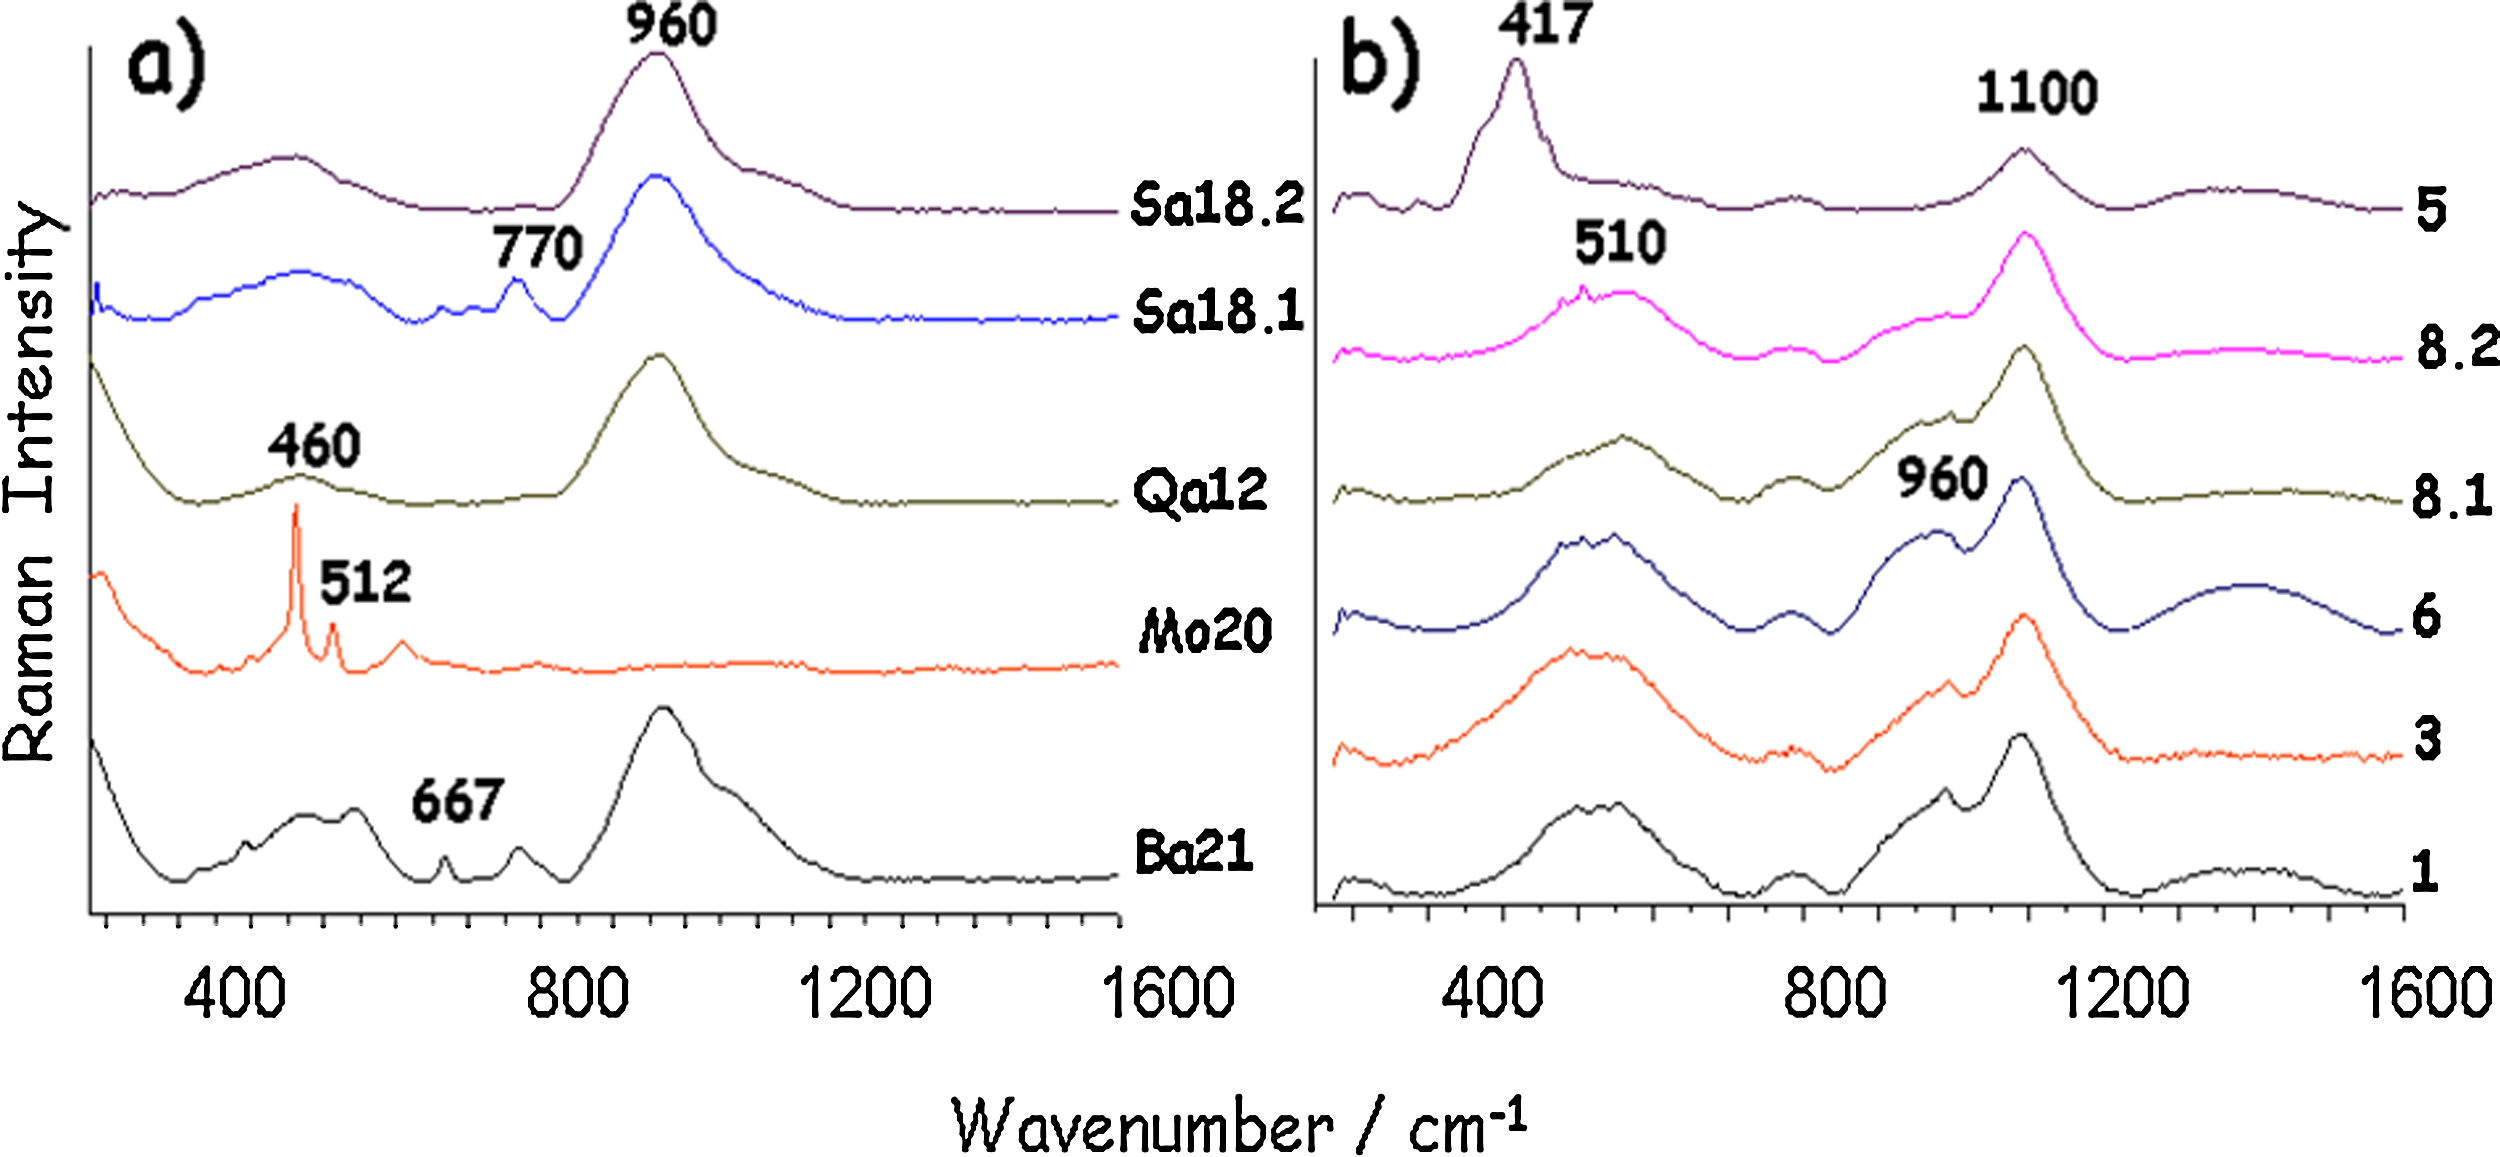
Fig. 6 shows Raman spectra of the glazes. All samples have the same Raman broad spectrum with the vibrational mode at ∼510cm−1 and the stretching mode at 1090cm−1, a signature assigned to alkali glass (Na2O+K2O+CaO flux) [18,19]. The intensity of the ca. 960cm−1 broad component, characteristic of poorly polymerized silicate network is consistent with a moderate firing temperature. In sample 5, the characteristic resonance Raman feature of the so-called amber FeS chromophore at ∼420cm−1[20] explains the strong darkening of the blue hue. The glaze structure is also different. The lack of the 960cm−1 component and the shift to 1100cm−1 of the SiO stretching mode indicate a different composition, as also confirmed by the highest silica and alumina contents measured by SEM-EDXS (Fig. 5). There are no differences between blue and grey glazes because only the glass signature was detected in the Raman signature implying that the colouring Cu2+ ions were dissolved in the glaze network [21].
 ‘Brownspeckled’, (b) ‘Bluespeckled’ wares.")
As conclusion, the homogeneity of the characteristics of ‘Bluespeckled’ ware is high which fits very well with a single production process.
‘Brown speckled’ waresBody: In the cross sections of the samples, a similarity was observed between Qa12 and Sa18.1 as well as Ba21 and Mo20. The grey core of the body develops a darker red layer towards the two opposite sides of the shards (Fig. 2), suggesting oxidizing firing atmosphere.
The red body of sample Sa18.2 shows a typical black core indicating the use of a clay rich in humic acids (such clays exhibit a better plasticity [13,14]). Pore dimensions, number and percentage of small, medium and large pores were calculated as for ‘Bluespeckled’ samples. The higher porosity levels measured for the modern samples Ba21 and Mo20 are consistent with a two-step firing process (glaze deposited on an already fired put porous body) while the matrix of the ancient sample Qa12 appears compact without any pores under the used magnification in the area analyzed. Usually, the heating rates used in ancient times are much lower than those presently used, which could lead to better sintering for a similar firing temperature and smaller bubble size due to the higher viscosity of the glaze. Samples Ba21 and Mo20 display about 150 pores for the area analyzed of comparable dimensions (Ba21: 51–128μm; Mo20: 35–250μm) taking into account that the range includes the smallest and the biggest pore found in the area. Intermediate porosity levels were calculated for the two shards of Salut samples (Sa18.1 and Sa18.2) respectively with 125 and 80 pores for the area analyzed. Samples Sa18.1 and Sa18.2 appear similar with the presence of small, medium or large pores while Ba21 is exclusively characterized by large pores.
Feldspars such as albite (NaAlSi3O8, characteristic triplet at 506-477-329cm−1[11,12]) and microcline (KAlSi3O8, 1124-613-512-474-455-412cm−1[11,12]) were detected in all the samples by Raman analysis, except samples Qa12 and Mo20. Microcline was also found in samples Ba21 and Sa18.1, Sa18.2 while albite signal is absent only in sample Qa12. Consequently, the sand used for samples Ba21, Sa18.1 and Sa18.2 is different from that used for samples Qa12 and Mo20. It is probable that no sand was specifically added for Qalhât shard Qa12. Thus, different raw materials have been used for these shards. Calcium phosphate (960cm−1[11,12]) was abundantly found in all the samples while it is scarcely present in samples Mo20 and Sa18.2. In fact, phosphate is rarely found in pottery body and this appears as a common characteristic common with ‘Bluespeckled’ wares. Rutile and anatase were also abundantly found in samples Qa12 and Sa18.2 and scarcely in sample Mo20 (rutile: 444 and 605cm−1; anatase: 140cm−1).
Iron oxide is present in the form of hematite, magnetite and maghemite. Magnetite and maghemite are absent in sample Sa18.1 and the latter was also not found in sample Ba21. The presence of hematite (α-Fe2O3: 225–294 and 1327cm−1[11,12]) in all samples is consistent with an oxidizing atmosphere during firing. A major presence of augite: 1006-666-388-320cm−1) was clearly found only in sample Sa18.1 by Raman analysis although augite was detected by XRPD in all samples. This demonstrated that one technique may not be sufficient to detect all the phases present. Augite is a type of pyroxene usually found in specific rocks such as ophiolites, lavas and gabbro. Ophiolites are common in Oman Mountains [22] and detection of augite could be a reliable marker of local production. Iranian geology also incorporates ophiolite and augite, but far away from Hormuz Detroit [23,25]. Calcite is absent in samples Qa12 and Sa18.2 while dolomite was only detected in sample Sa18.1 (Table 1).
Glazes: All the samples selected (Fig. 2) are covered by a glaze layer with colours of brown (Qa12 and Sa18.1), green (Ba21 and Mo20) and yellow-brown (Sa18.2) and similar thickness (∼150μm). Samples Qa12, Ba21 and Sa18.1 have glazes on both sides. Observation of the cross sections showed the similarity of samples Qa12 and Sa18.1 (no significant interphase between the body and the glaze, Fig. 1a and d) and also some similarity with sample Sa18.2. An intermediate layer of ∼80μm between the upper glaze layer and the paste can be distinguished for samples Ba21, Mo20 and Sa18.2 (Fig. 1b; c and e). Such an interlayer could result from a deposit (engobe?) or from a reaction zone due to a deposit of the enamel slurry on a green body and a single step co-firing process that promotes the extent of the reaction zone. No bubbles were found in any glazes, indicating a low viscosity at the firing temperature and a deposition on already pre-fired body.
The elemental analysis (Fig. 5a and b) shows two groups. On one hand, samples Ba21, Mo20 and Sa18.1 (very close in the values of refractory oxide content vs. flux) are coated with an alkali-containing glaze and on the other hand, samples Qa12 and Sa18.2 are glazed with a lead-based composition (more widespread in the graph than the others). Each value is the mean of data measured on three spots. The concentration of Pb in the latter two samples is variable and higher than 14wt% (the others below 4wt%). This indicates that the glazing technology of sample Sa18.2 is the most comparable to that of the mediaeval Qa12 shard. This is consistent with a technological change from lead-rich glaze for mediaeval and post-mediaeval periods to an alkali-rich glaze for the modern period. As usual, lead-based Cu2+-containing glaze is green. The high level of iron oxide measured for Qa12, Sa18.1 and Sa18.2 glazes explains the brown colour.
Raman spectra of the glazes are presented in Fig. 6 and assignments are summarized in Table 1. Raman signatures show the characteristic SiO bending (∼460cm−1) and stretching (∼960cm−1) broad modes of poorly polymerized amorphous silicates, i.e. glassy silicates with relatively low temperature of melting [19,20]. Due to the incomplete reaction between the raw materials used to prepare the glaze, signatures of quartz and feldspars were recorded in many places. For instance, in sample Mo20, the contribution of unreacted α-quartz (460cm−1) and feldspar (512cm−1) grains [11,12] is shown, hindering the observation of the glaze signature (broad components). It should be noted that the size of the probed volume by the Raman microspectrometer (∼5μm×5μm×15μm) is much smaller than the glaze thickness, which guarantees the lack of contamination by the signature of body phases and the possibility to identify the glaze heterogeneity. Raman spectra of Qa12 and Sa18.2 glazes are similar, without features at ∼750cm−1, according to a significant lead content [19], in agreement with the glaze composition.
Additional iron oxide signature with spinel structure, likely magnetite (∼670cm−1) [11,12] was found in Ba21 and Sa18.1 glazes, which indicates firing under reducing atmosphere or the use of a clay rich in humic acids. The green colour of samples Ba21 and Mo20 is however not only related to a high level of copper. The colouration is likely due to the combination of Fe2+ and Fe3+ ions, but clear observation of the Raman signature of spinel could indicate the presence of ions promoting the spinel structure such as chromium. The very surprising high level of BaO (∼12wt%) detected in Ba21 glaze is interesting according to the recent reference [9]. The narrow 667cm−1 peak indicates traces of CaSb2O6 opacifier [25].
The analyzed samples obviously belong to different productions. Samples Sa18.2 and Qa12 are very different from the others, both regarding the body and especially the lead-rich glaze. On the other hand, the glaze of other shards is alkali-rich and this can be interpreted as a technological change between the mediaeval/post mediaeval and modern period.
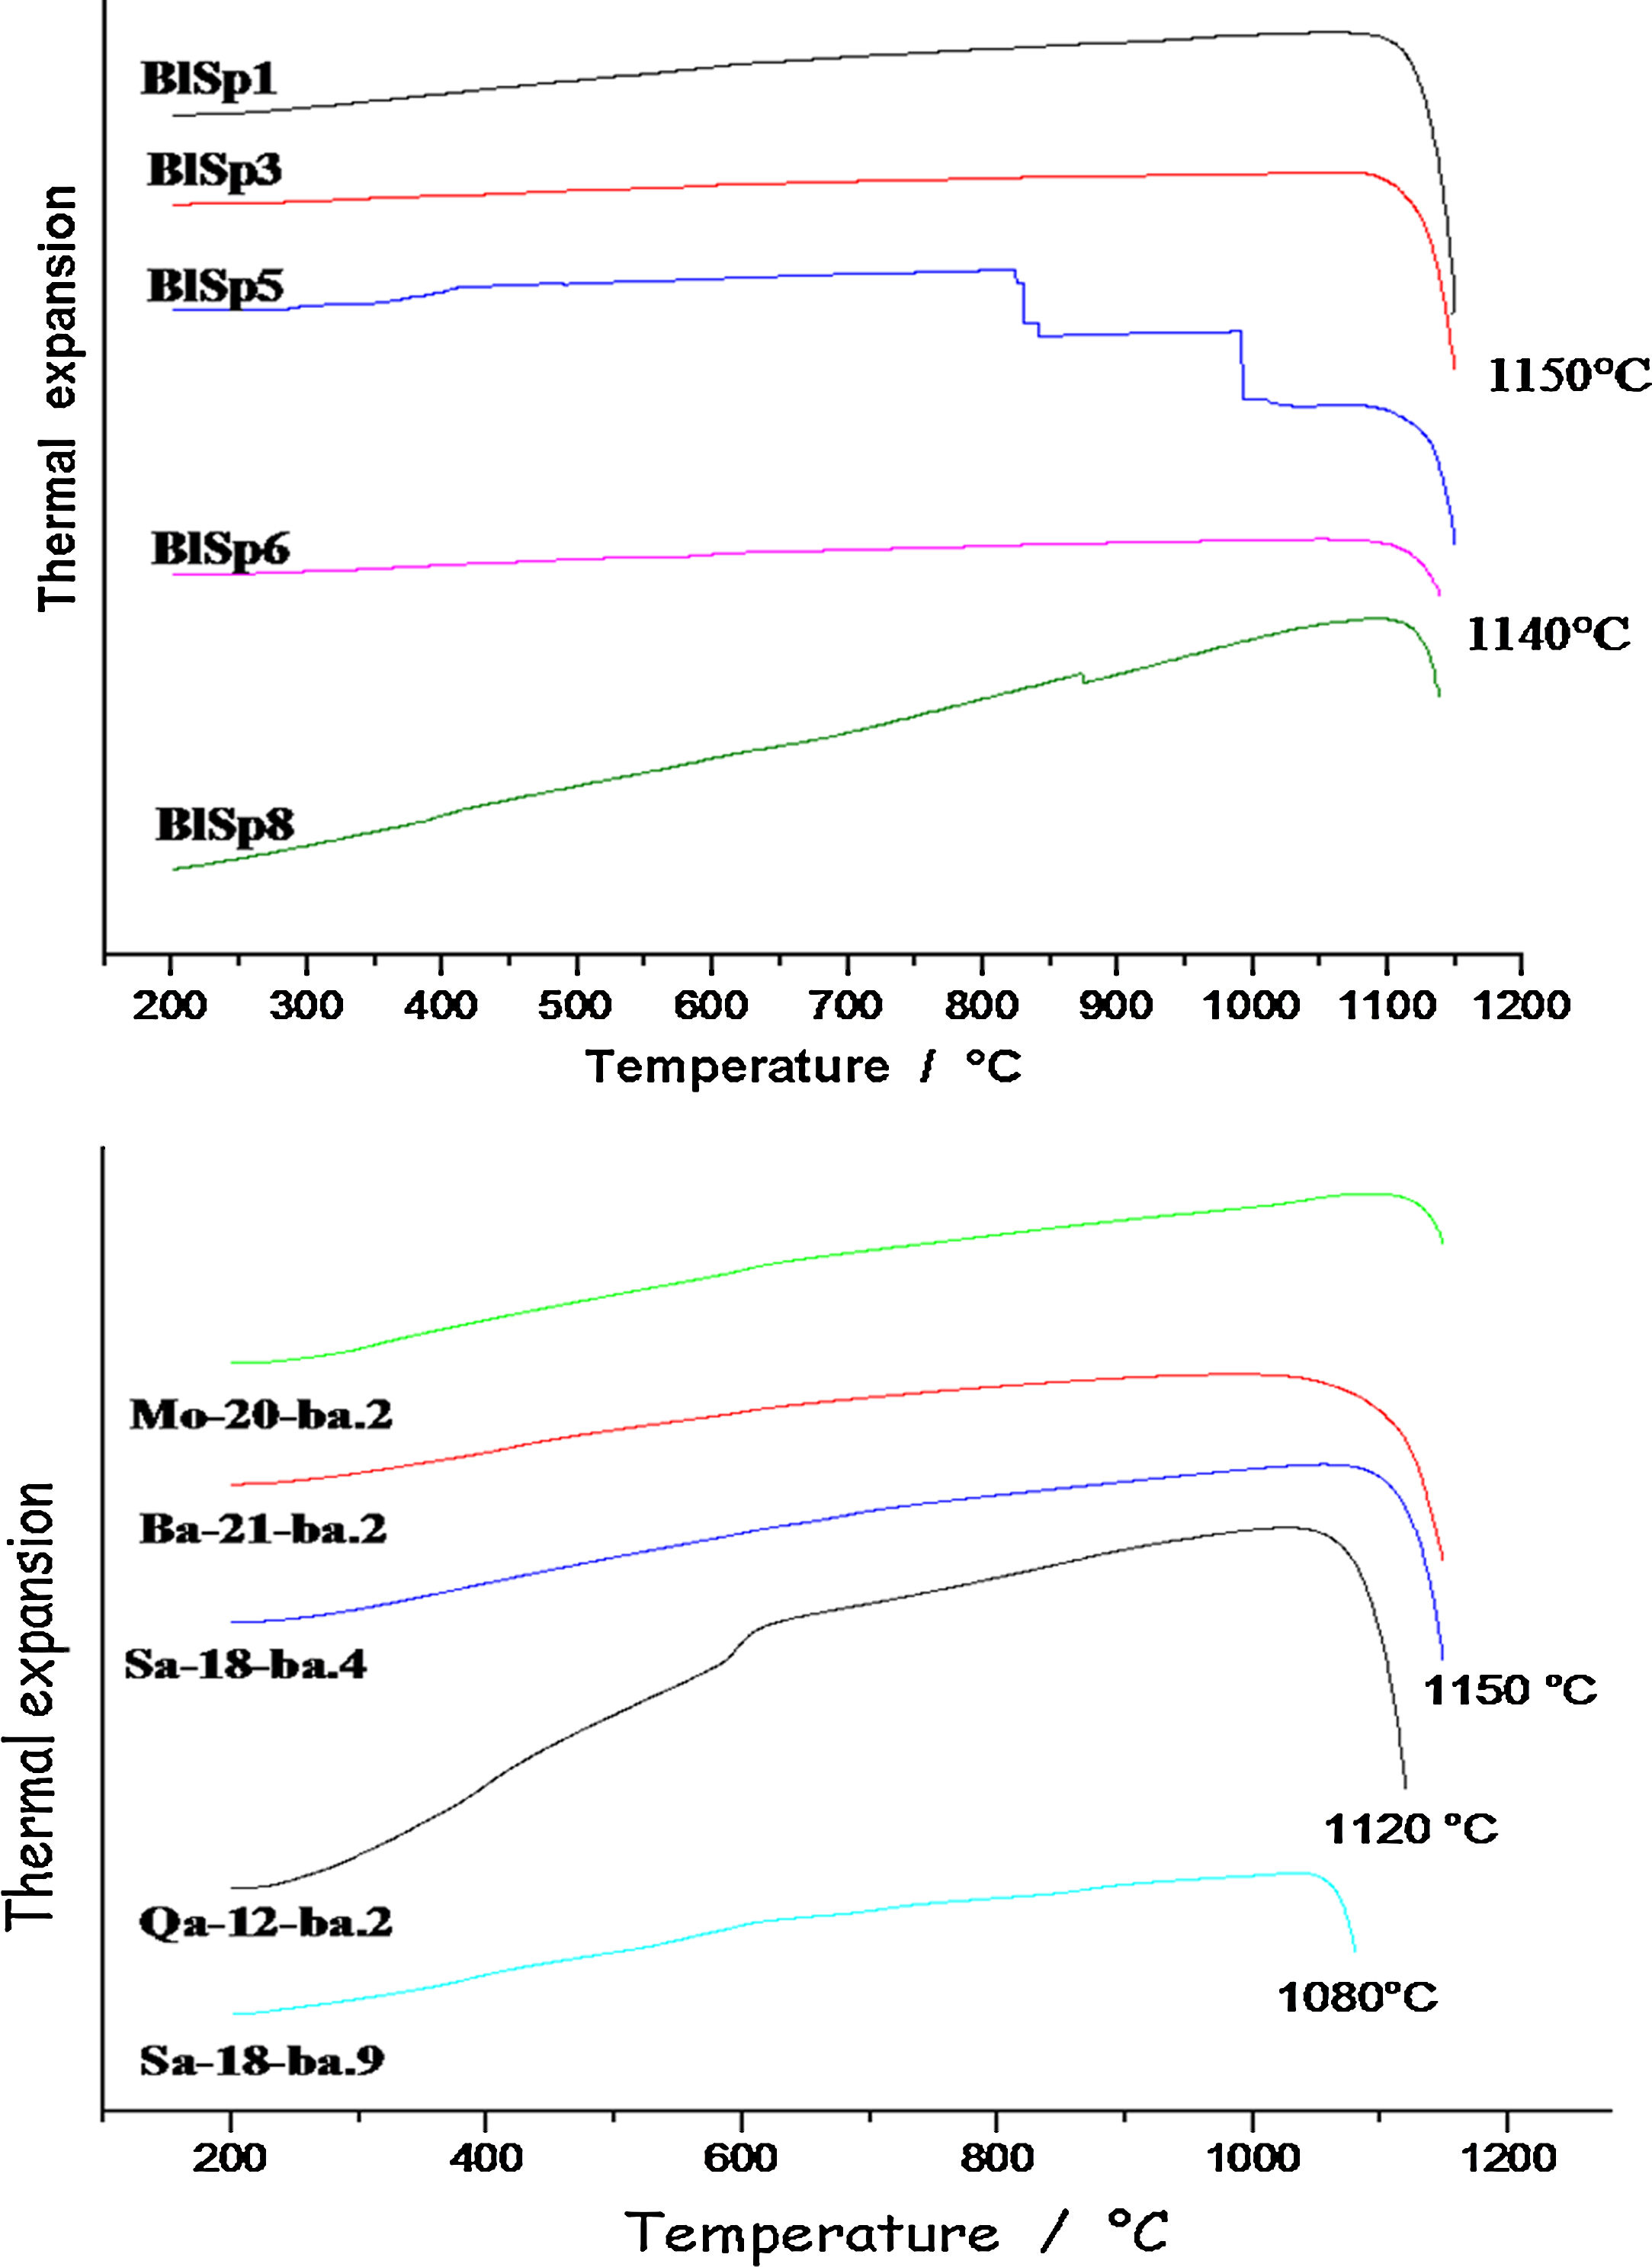
Firing technologyThermal expansion analysis (Fig. 7) was pursued to make the precise estimation of the firing temperatures. Thermal expansion measurement has been one of the favourite techniques to control ceramic production and qualify raw materials and glazes [13,14]. The onset of the thermal expansion jump is considered at the firing temperature.

The curves obtained indicate that the ceramics were fired around 1140°C for samples 6 and 8 and at a little higher temperature, 1150°C for the others. The closer values may clearly indicate the same type of kiln. In accordance with the identification of glaze compositions and phases, thermal expansion curves confirm the homogeneity of the group. Sample 5, with dark glaze coloured both by Cu2+ ions and Fe-S amber chromophore (Fe2O3 content ∼3.1wt% vs. 2–2.5wt% for the other) shows small events at ∼300–500°C which were not detected in the other samples (traces of cristobalite? [13]).
‘Brown speckled’ waresThermal expansion analysis shows the firing temperature ranges from ca 1080°C for sample Sa18.2 to 1120–1150°C for other samples. Ancient sample (Qa12) was fired at 1120°C. The firing temperatures are fully consistent with the number of pores measured per unit area, the lowest number for the lowest firing temperature and the highest number for the highest firing temperature, except for sample Qa12. Thermal expansion curve of sample Qa12 exhibits a strong event at ∼600°C which is characteristic of the α to β-quartz transition [13,14], according to the large amount of quartz in the body, i.e. consistent with the use of coarse sand and/or raw earth, without specific preparation. This finding also demonstrates that more recent pottery samples are different from the 16th century ones.
ConclusionsRepresentative archaeological shards excavated at Qalhât and collected at the important active neighbouring site of Bahlâ were analyzed and compared to modern pottery produced in a regional pottery production centre. Augite was detected in all the shards by XRPD and in some of them by Raman. Local production of pottery with body having a high content of augite is thus very likely but more information on the geology of the Oman Sultanate and Iran is needed. Identification of phosphate in almost all the samples (except sample 8) suggests the same procedure of firing, the use of phosphate-containing raw materials or water, or the same type of contamination in relation with the use as vessel or the conservation in the soil. Recording of the oil signature by Raman scattering in some shards is consistent with contamination and a further chromatographic study of the soluble food residues to be extracted from the pottery body would be interesting to identify the organic matter and document the function of the utensils.
‘Bluespeckled’: Elemental compositions of the glazes are more or less similar with some differences only found in sample 3 (higher level of alumina) and sample 5 (the amber Fe-S chromophore darkens the turquoise colour obtained by Cu2+ ions according the higher Cu2O and Fe2O3 content). Considering the different characteristics, the shards appear very similar and may have the same local origin of production. Many other common minerals were found such as anatase (the firing temperature below 1200°C) and rutile (high temperature polymorph, consistent with a firing temperature close to 1150°C) in samples 1, 3, 5, 6 and 8. Whatever the very homogeneity of the bodies at visual examination, specific characteristics can also be identified such as the presence of unreacted feldspar and other particular minerals (e.g. dolomite). The main differentiation can be made by considering the glaze. Importation of the glaze (or glaze precursor(s) only) is possible, the high similarity of the glazes contrasting with the variation of characteristics regarding the body.
‘Brownspeckled’: Considering the glazes, cross sections of samples Qa12 (mediaeval) and Sa18.1 (absence of an interface, consistent with single step firing) and Ba21, Mo20 and Sa18.2 (presence of an interface, pre-firing of body before enamelling?) have different characteristics while the glaze thickness is comparable. Elemental and Raman analyses identified samples Mo20 and Ba21 as alkali glazed (Ba21, barium-based glaze), as in the case of ‘Blue speckled’ glazes. However, samples Qa12 and Sa18.2 are covered by mixed lead-rich glazes. Feldspar-containing sand appears typical of Bahlâ productions. On the contrary, rather high levels of rutile and anatase are characteristics of Qalhât samples. Important similarity was remarked in compositional and technological aspects between the mediaeval Qalhât shard (Qa12) and samples from the ruined village near Salut (in particular Sa18.2), with the use of similar technological procedures (lead-rich glaze, single firing in similar kilns) which fit with a slightly lower temperature of firing. The other modern samples (Mo20 and Ba21) belong to another technological procedure (multi-firing?); this can be interpreted as a technological change between the mediaeval/post mediaeval and modern period. Sample Ba21 is characterized with its very special barium-based glaze. Finally, Qalhât sample Qa12 and Salut sample Sa 18.2 are glazed with lead-rich glazes whereas alkaline glazes are used for the others. In conclusion, modern Bahlâ pottery cannot be considered as a continuation of Qalhât production (stopped around 1508 with the destruction of the city).
The authors thank HE Hassan Mohammad Ali Al Lawa, Advisor to the Minister, General Directorate for Archaeology of the Ministry of Heritage and Culture of the Sultanate of Oman and Mr Sultan Saif Nasser al Bakri, Assistant, for their help and support. Dr. A. Rougeulle is kindly acknowledged for her help along all the work. The grant to L.G. was given by MiChem Labex, a French fund managed by ANR within the Investissement d’Avenir programme under reference ANR-11-Idex-0004-02.

