


This study aims to investigate zircon (ZrSiO4) formation during thermal treatment and its influence on the structure and properties of the ceramic glazes. Four raw ceramic glazes with the addition of 5, 9, 13, and 17wt% of ZrO2 (<5μm) at the expense of SiO2 were prepared by the ceramic traditional route. To obtain homogeneous melting and consequently a high-quality surface, 5wt% of colemanite (2CaO·3B2O3·5H2O) was added to the ceramic glazes formulation. XRD, NMR, Raman spectroscopy and FTIR measurements revealed the formation of ZrSiO4. An increase of ZrSiO4 from 35 to 86wt% with an increase of ZrO2 content in the composition of ceramic glazes was observed. 29Si solid-state MAS NMR measurements also showed that with successive increases of ZrO2 concentration the relative intensity of zircon resonance increases. The evaluation of the chemical resistance revealed the beneficial effect of ZrSiO4 on this property.
Este estudio examina la formación de circón (ZrSiO4) durante el tratamiento térmico y su influencia en la estructura y propiedades de los esmaltes cerámicos. Cuatro esmaltes cerámicos fueron preparados con la adición de 5, 9, 13 y 17% en peso de ZrO2 (<5μm) a expensas de SiO2 utilizando técnicas tradicionales. Para obtener una fusión homogénea y, en consecuencia, una superficie de alta calidad, se añadió un 5% en peso de colemanita (2CaO-3B2O3-5H2O) a la formulación de los esmaltes cerámicos. Las mediciones de XRD, NMR, espectroscopia Raman y FTIR revelaron la formación de ZrSiO4. Se observó un aumento de ZrSiO4 del 35 al 86% en peso con un aumento del contenido de ZrO2 en la composición de los esmaltes cerámicos. Las mediciones de NMR del 29Si estado sólido también mostraron que con los incrementos sucesivos de la concentración de ZrO2 aumenta la intensidad relativa de la resonancia del circón. La evaluación de la resistencia química reveló el efecto beneficioso del ZrSiO4 sobre esta propiedad.
Ceramic glazes are used to form a layer over a ceramic body and are prepared from a mixture of natural minerals. They play an important role in the esthetical aspect and durability of the final ceramic products [1,2]. Generally, the ceramic glazes are constituted of an amorphous phase and one or more crystalline phases [3–5]. The chemical composition of the glazes and their thermal treatment cycle from the sintering temperature to cooling plays an important role on ceramic glaze crystallization.
Both they determine the final phase composition of the glass-ceramics, the quantity of the crystalline phase, and properties of the final materials; surface smoothness, gloss, color, thermal expansion coefficient, wear-resistance and also chemical durability [2].
For corrosive solutions, chemical durability is an important factor in assessing a glaze lifetime duration, and it is a key reason for applying ceramic glazes on ceramic products. Chemical stability has been frequently reported in terms of the corrosion of the glassy phase in various pH environments and to a lesser extent to the crystalline phases, stresses, and chemical gradients at crystal-glass boundary [4]. Thus, lowering the content of alkali and high alumina additions improves the glassy phase durability. It is known that zircon [6] highly influences the surface properties of ceramic glazes [7] as well as the main crystalline phases developed in ceramic glazes (mullite, Al2Si2O13, anorthite, CaAl2Si2O8, and wollastonite, CaSiO3).
Zircon is used in the composition of ceramic glazes due to its performance such as increase opacity and brightness, thermal stability, good resistance to chemical attack, and high wear resistance [6,8]. To promote in situ zircon crystallization monoclinic zirconia can be used in ceramic glaze formulations as a nucleation agent [5].
As was aforementioned, the thermal treatment cycle plays an important role in the final properties of the ceramic product and cost. Conventionally ceramic glazes are obtained from glaze compositions prepared with frits that increase considerably the energy cost.
Nowadays, researchers have focused on finding alternatives to lower the synthesis temperature and eliminate the glaze melt fritting process resulting in the reduction of energy consumption during the manufacturing process [9–11]. In contrast to fritted glaze compositions, raw ceramic glazes are cost-effective and less time-consuming replacements for application to ceramic substrates.
In the current work, in order to obtain a homogeneous melting and improved properties of the ceramic glazes, 5wt% of colemanite was added in the ceramic glazes formulation. Colemanite is a natural source of insoluble boron that can be considered an alternative to boron precursor in raw ceramic glaze since it has the glass-forming ability and reduces the melting point, provides homogeneous melting and stable structure, and positively influence the chemical and physical properties of the final ceramic product [10]. Not many research studies exist related to the use of colemanite as a boron precursor in raw ceramic glazes [9]. Its addition (3wt%) to the hard porcelain formulations resulted in a decrease of firing temperature and reduction of porosity and water absorption as was reported by S. Akpinar et al. [10].
This work aimed to understand the influence of compositional variation on the type of crystalline phases formed (with emphasis on zircon) during thermal treatment and their effect on the structure and chemical durability of the ZrO2 containing ceramic glazes.
ExperimentalCeramic glaze preparationIn the present study, four raw ceramic glazes with the addition of 5, 9, 13, and 17wt% respectively of ZrO2 at the expense of SiO2 (Table 1) were prepared by ceramic traditional route. The starting materials were feldspar (KAlSi3O8), quartz (SiO2), kaolin (Al2Si2O5(OH)4), wollastonite (CaSiO3), zinc oxide (ZnO), colemanite (2CaO–3B2O3–5H2O) (industrial grade-Clayman Supplies-UK), and ZrO2 (Sigma Aldrich). The detailed synthesis procedure has been described in our previous works [12,13]. In brief, the raw materials were wet milled (balls: material: water ratio of 1.5:1:0.6) up to 0.1% residue on a sieve of 63μm. The resulted slurry was applied on the unfired ceramic substrate followed by thermal treatment with a ramp rate of 10°C/min up to 1250°C for 1h plateau in an electrical furnace. The obtained samples were labeled as following: G5Z, G9Z, G13Z, and G17Z. The theoretical oxide composition of ceramic glazes expressed in weight % is presented in Table 1.
Characterization methodsXRD patterns were collected using a Rigaku UltimaIV diffractometer (Cu Kα radiation, λ=1.5406Å) operating at 40kV and 30mA, in the range of 10–80° with a step size of 0.02 and a speed of 2°/min. Qualitative and quantitative phase analyses were performed using Rigaku's PDXL software, connected to ICDD PDF-2 database. The XRD patterns of the obtained ceramic glazes were refined by the whole Pattern Powder Fitting (WPPF) method using the split-pseudo Voigt function and the B-spline background model. The following parameters confirm the fitting quality of the experimental data: the goodness of fit S that should be closed to 1 for a good fit and, Rwp (weighted differences between measured and calculated values) that should close to or less than 10%.
The microstructure of the samples was analyzed using a Zeiss SUPRA 55VP Scanning Electron Microscope equipped with energy dispersive X-ray analysis (EDX) capability.
The 29Si solid-state MAS NMR spectra were recorded using a Varian Infinity Plus spectrometer with a 7.05T magnet at a Larmor frequency of 59.6MHz. The powder samples were packed into 7mm zirconia rotors and spun at 4kHz. All collected spectra were referenced to tetramethylsilane at 0ppm. Simulations using four and five Gaussian peaks were carried out using the Dmfit software [14].
27Al solid state MAS NMR spectra were acquired at MAS frequency of 18kHz on a Bruker Advance II+spectrometer equipped with a magnet of 14.1 T (Larmor frequency of 156.37MHz). The powder samples were packed into 3.2mm zirconia and Y3Al5O12 was used as a reference with the AlO6 resonance set to 0.7ppm.
Micro-Raman data were measured by means of a LabRam HR800 spectrometer from Jobin–Yvon–Horiba, equipped with a 532nm laser line and a grating of 1800 lines. The backscattered light was collected through the 50x LWD/0.55 objective (∼1.18μm spot size) of an Olympus microscope. To improve sensitivity in detecting surface structure of the glazes under investigation, UV-Raman spectra were collected by a 325nm laser line, through a 40×/0.47 NUV objective, from a sample spot size less than 1μm. Grating of 2400 lines was used in the latter configuration. Edge filter prevent us recording UV-Raman spectra at low wavenumbers.
Infrared transmission spectra were recorded using Nicolet 6700 spectrophotometer in the 400–1400cm−1 range. The same weight of the ceramic glaze powder was dispersed in KBr pellet.
The chemical resistance of the prepared ceramic glazes was evaluated based on DIN 12116 for acid resistance and ISO 695 for alkali resistance respectively. In brief for acid resistance evaluation, the glaze surface to be tested is boiled for 6h in 20% hydrochloric acid [c (HCI)=6mol/l], and the weight loss is determined in mg/100cm2. In the case of alkali resistance assessment (ISO 695), glaze surface is subjected to a 3h treatment in a boiling aqueous solution consisting of equal volumes of sodium hydroxide, c (NaOH)=1mol/l and sodium carbonate, c(Na2CO3)=0.5mol/l.
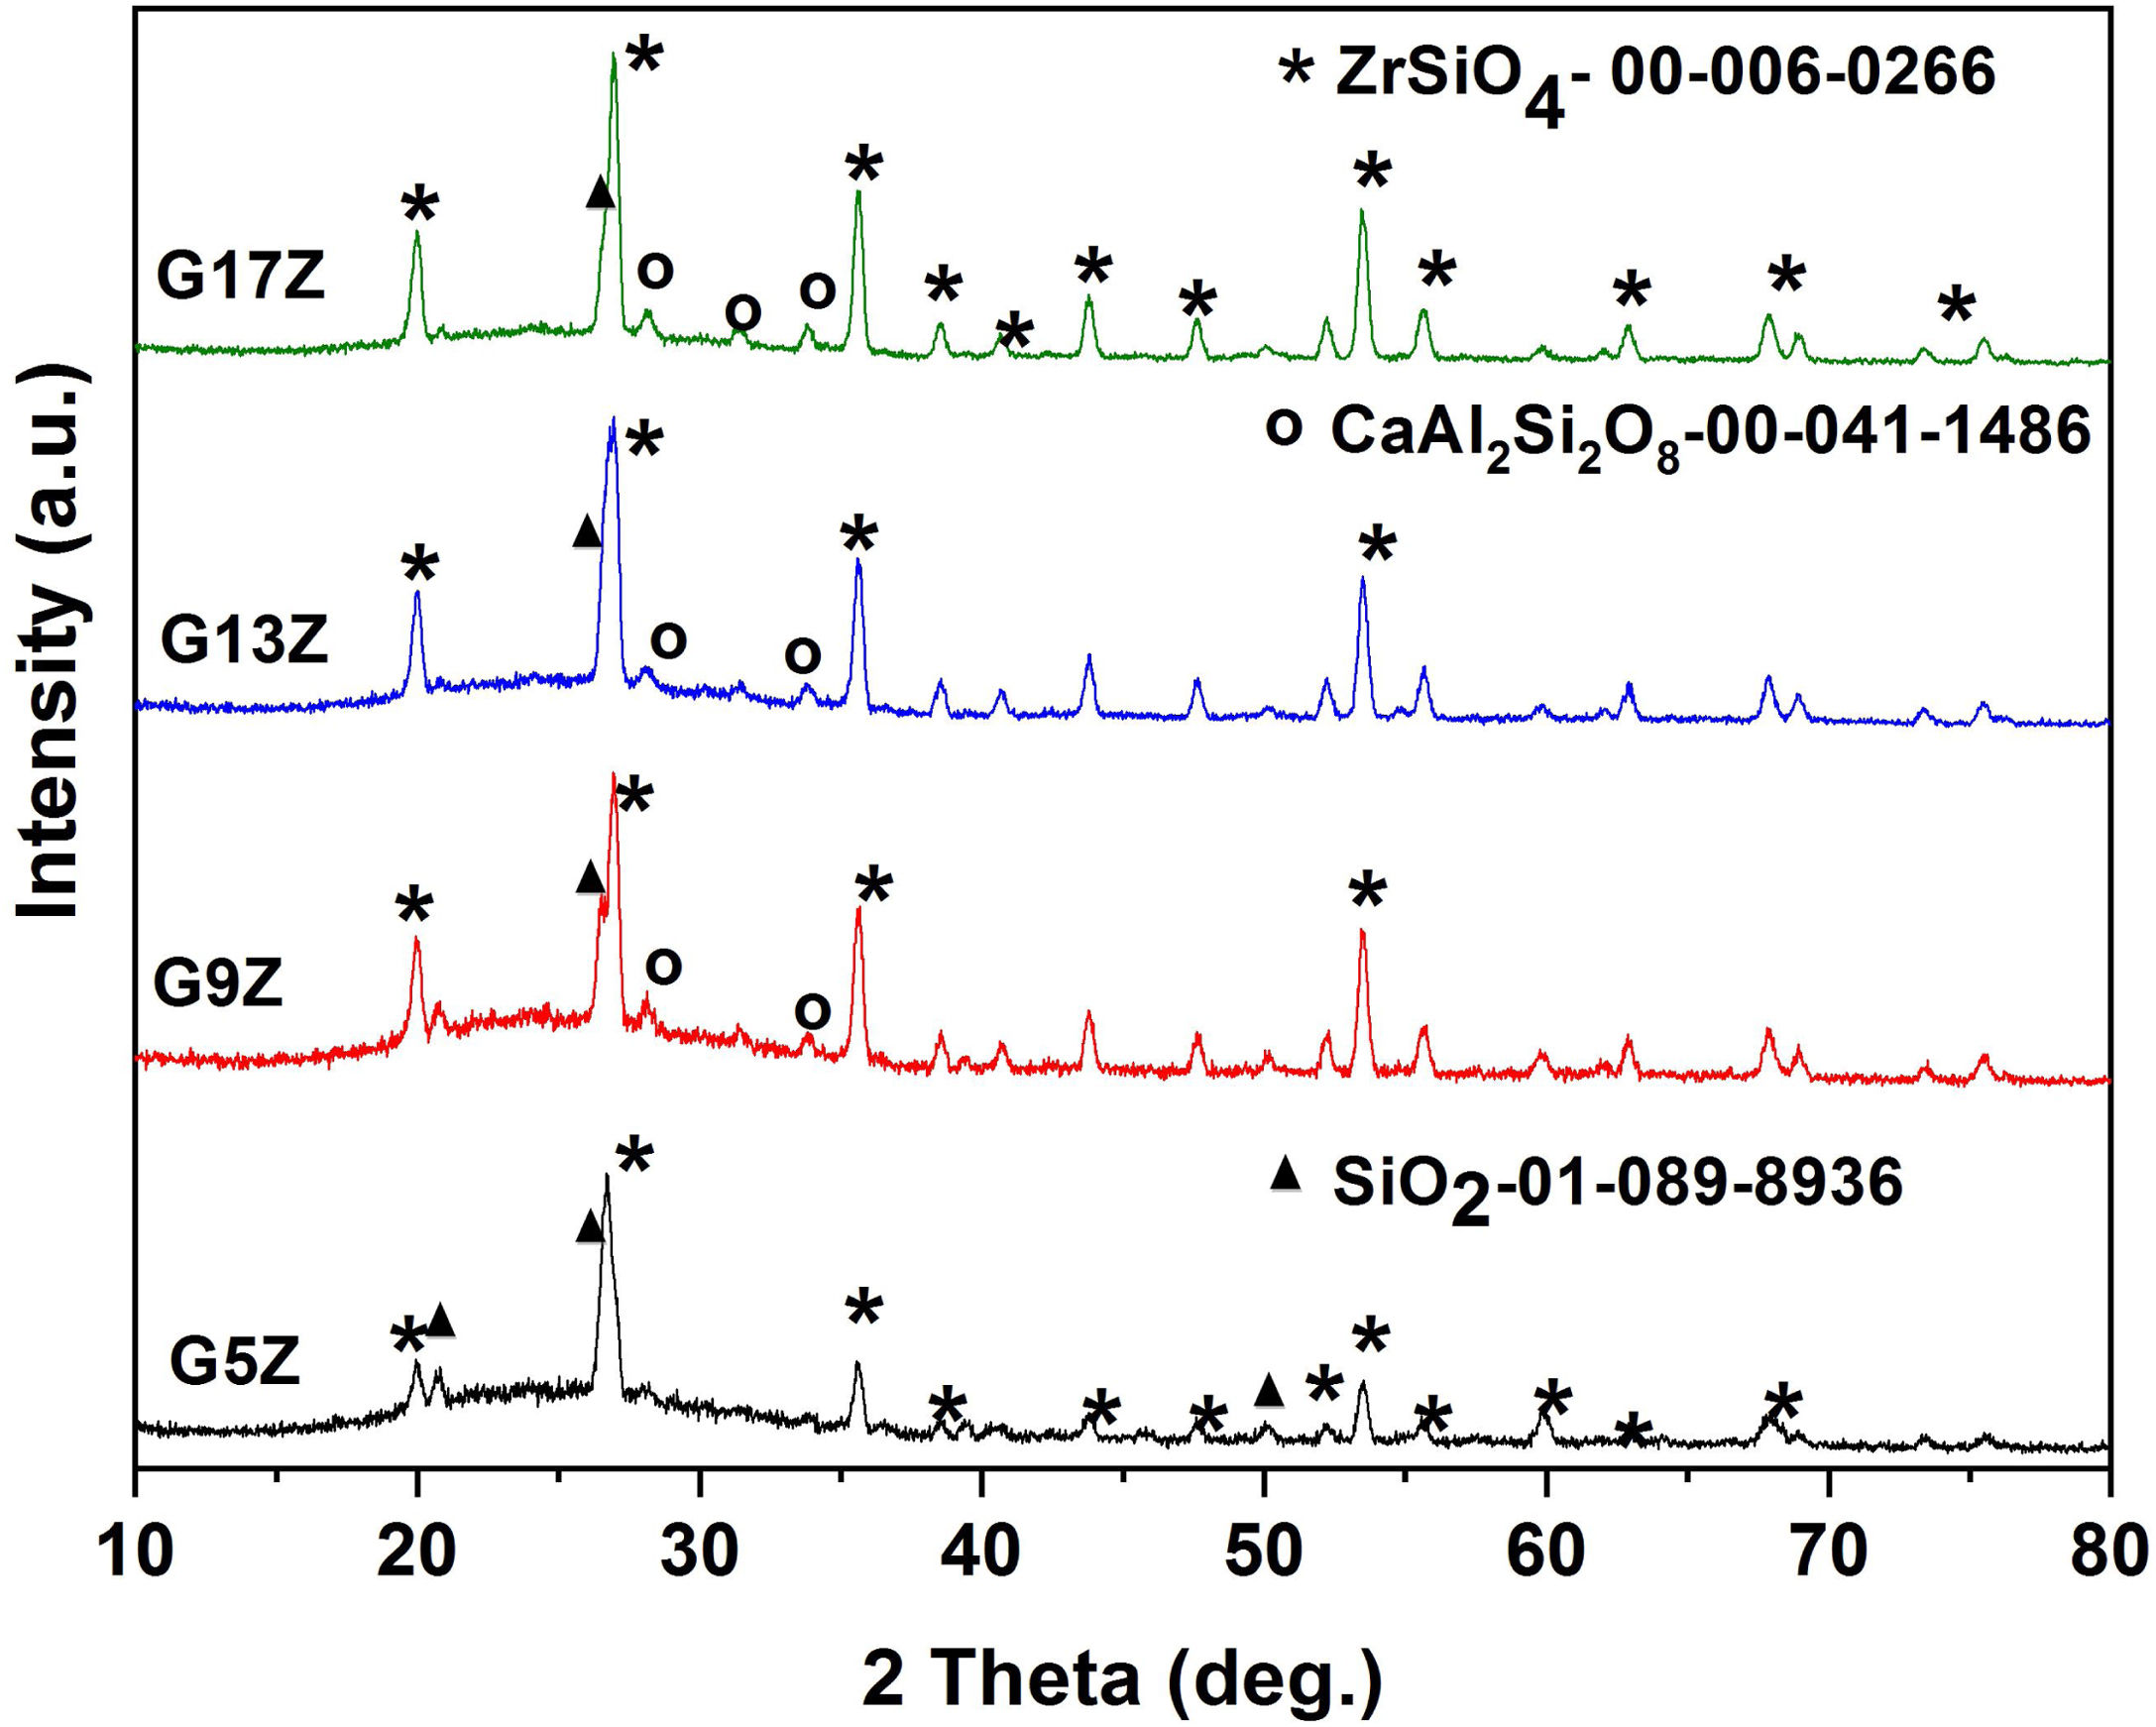
Results and discussionX-ray diffraction XRDX-ray analysis of the prepared ceramic glazes was carried out to assess the crystallization of zircon. Fig. 1 shows the XRD patterns corresponding to ceramic glazes after thermal treatment at 1250°C. In all investigated glazes, the formation of zircon-ZrSiO4 (JCPDS card no. 00-006-0266) as a major phase occurs. In addition, anorthite-CaAl2Si2O8 (JCPDS card no.00-041-1486) and quartz-SiO2 (JCPDS card no. 01-0850794) were also identified beside the amorphous halo between 2theta 20–35°. As can be observed from Table 2 the amount of zircon continuously increases, from 35wt% (G3Z) to 86wt% (G17Z) with the increase of ZrO2 concentration. A similar trend was also observed for the glaze degree of crystallinity. A crystallinity of 87% was determined for the glaze with the highest ZrO2 content (17wt%).
MAS NMR spectra29Si MAS NMR
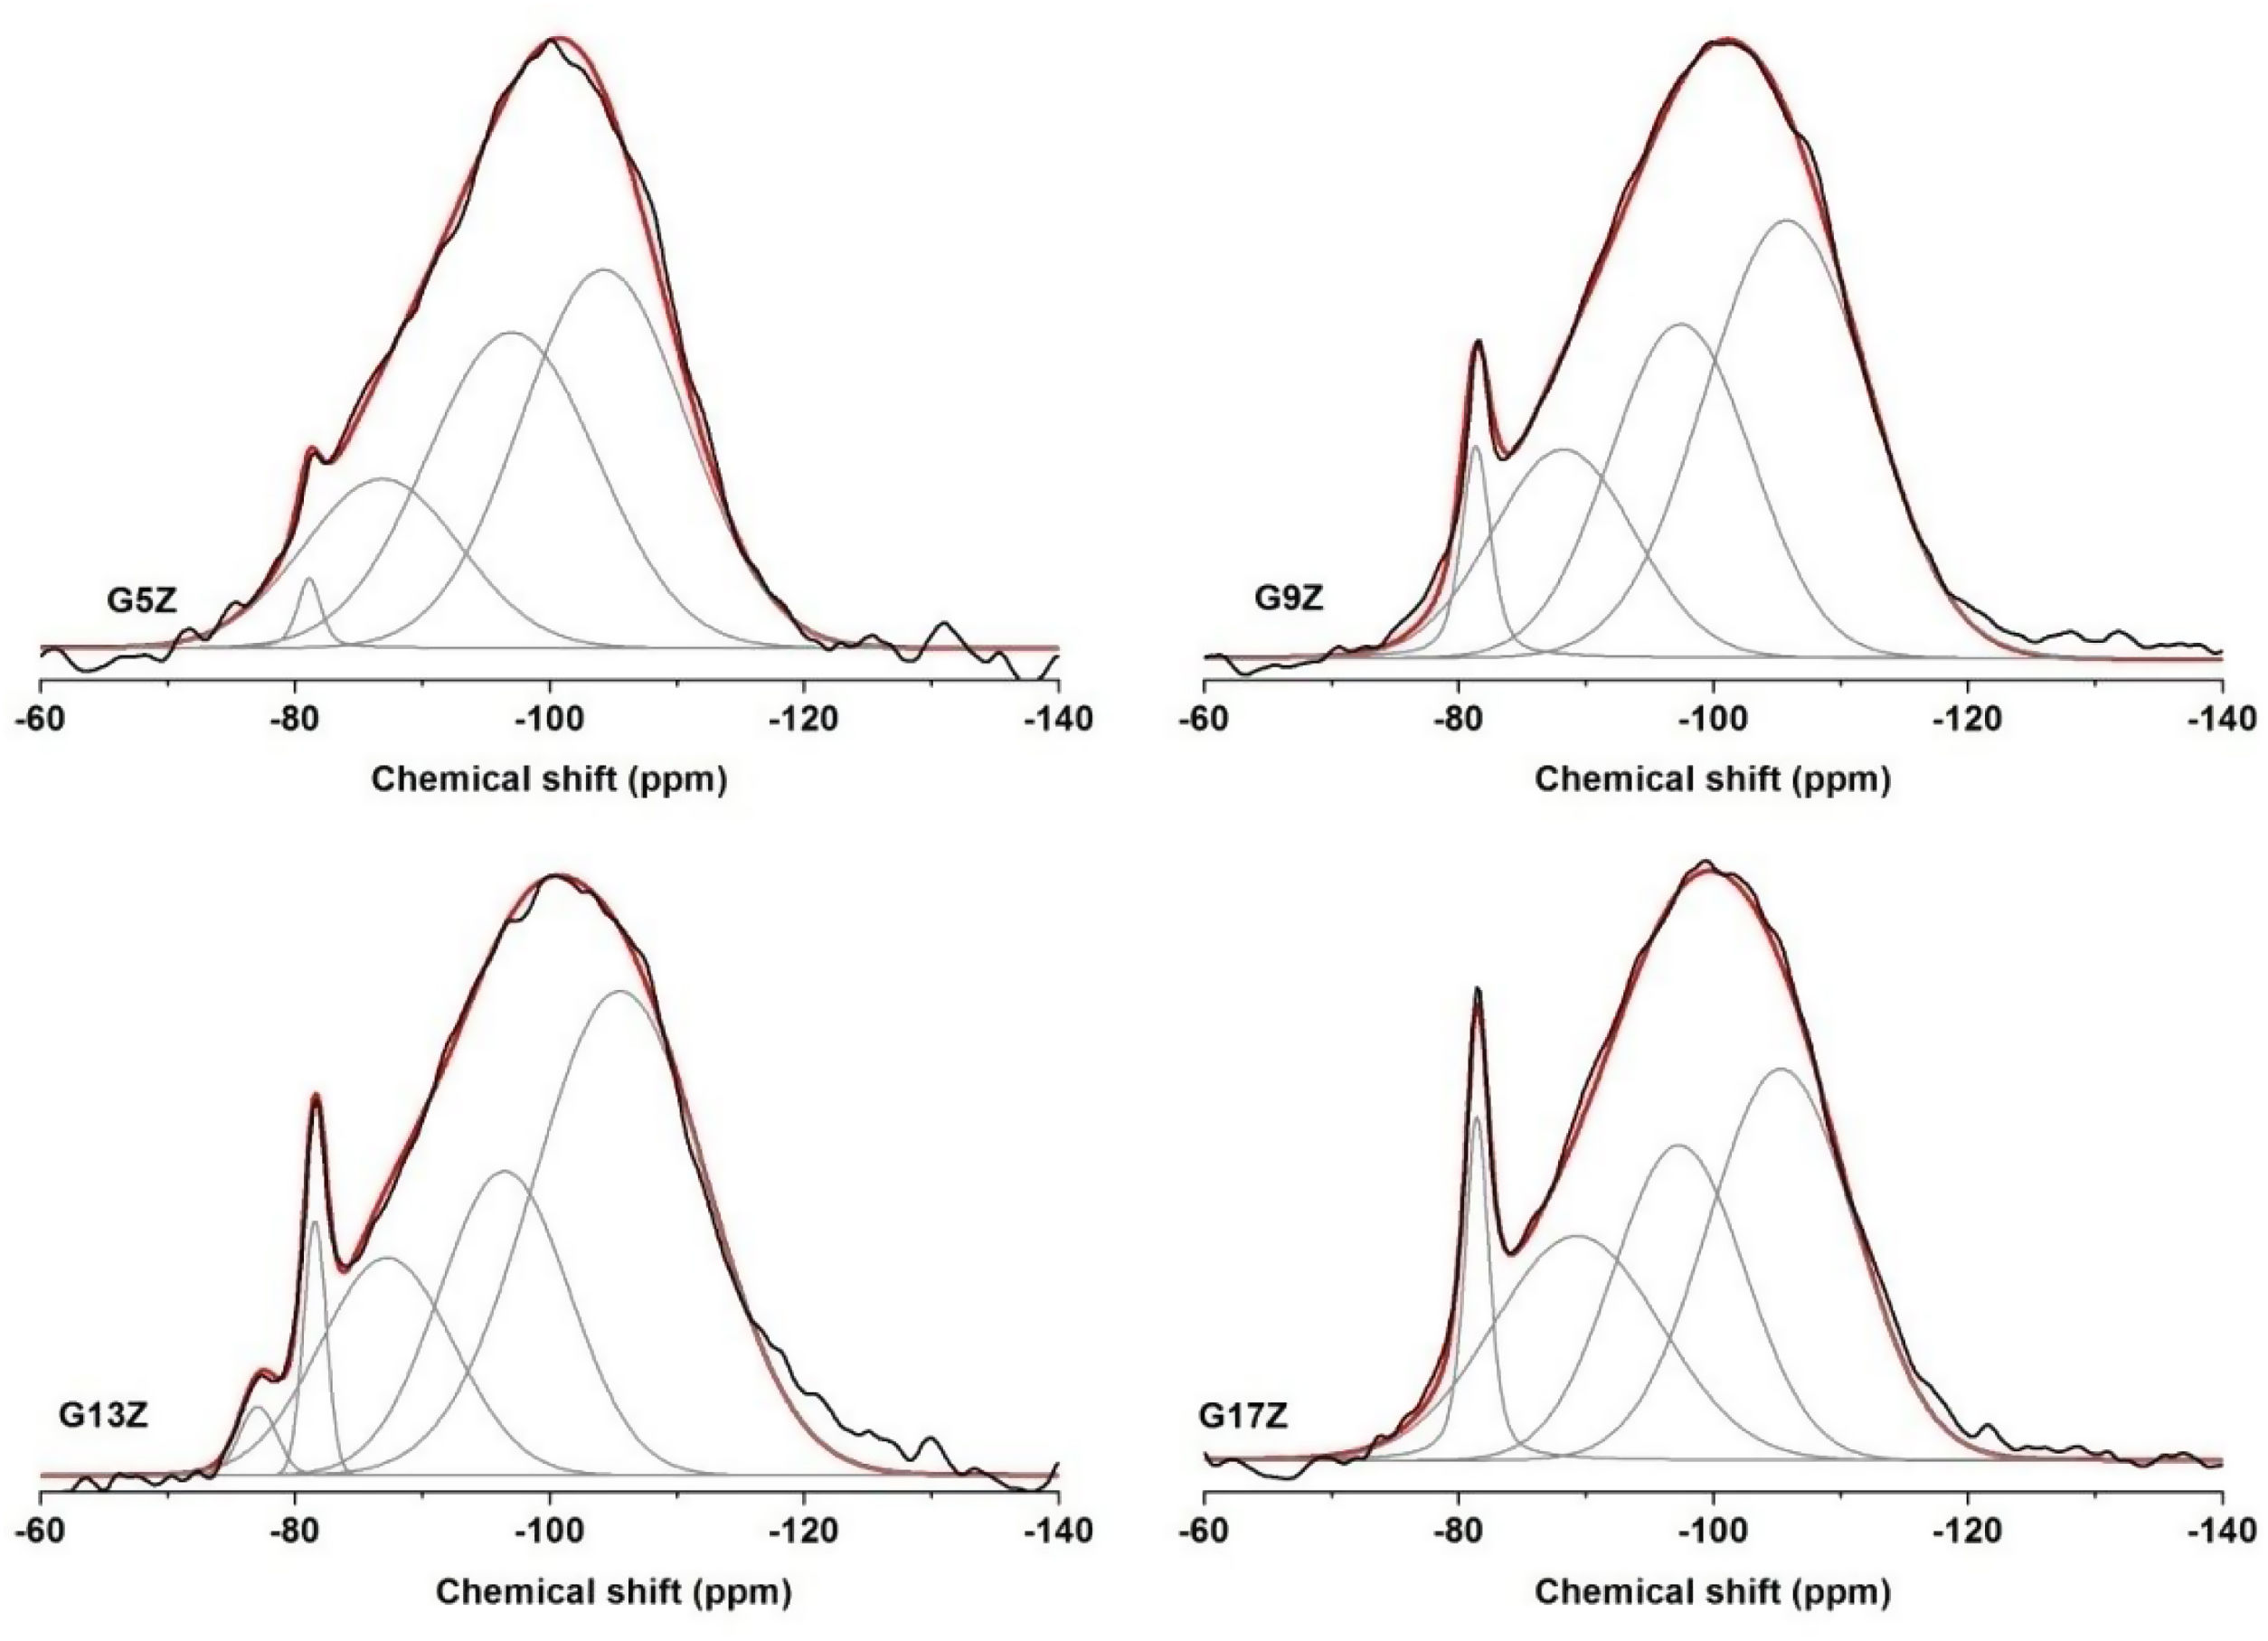
29Si solid-state MAS NMR is a useful method for determining the state of silicon polymerization. The 29Si chemical shifts for SiO4 (Q4) units range from 60 to 110ppm. The silicon environment in aluminosilicates can be designated as Qn(mAl), where n denotes the number of bridging oxygen (BO) for each Q unit and m represents the number of attached AlO4 (m≤n). The substitution by Al of each of the four silicons surrounding the central Si determines the displacement of the chemical shift of about 5ppm toward less negative values.
All the studied ceramic glazes exhibit broad featureless spectra indicating a disordered structure (Fig. 2). The deconvolution of the 29Si MAS NMR spectra (Table 3) yielded resonances at approx. −105, −98, 89 and −81ppm. In the case of G13Z ceramic glazes an additional peak resonance at −76ppm that represents the Q1 site of silicon environment, was observed. The peaks located at −105, −98, and −89ppm are assigned to Q4(1Al), Q4(2Al), and Q4(3Al) units while the narrow peak at −81ppm corresponding to zircon. I. Farnan and E.K.H. Salje reported [15] that crystalline undamaged zircon shows a single sharp 29Si NMR resonance at a chemical shift of −81.5ppm. Quantification of the relative intensity of zircon resonance in the 29Si MAS NMR spectra of ceramic glazes increases from 1.37% for G5Z sample to 7.10% for G17Z sample with the highest content of zircon as was revealed by XRD measurements.

Solid state 29Si MAS NMR data.
| Sample | Q4(1Al) | Q4(2Al) | Q4(3Al) | ZrSiO4 | Q1 | ||||||||||
|---|---|---|---|---|---|---|---|---|---|---|---|---|---|---|---|
| δ | Δ | % | δ | Δ | % | δ | Δ | % | δ | Δ | % | δ | Δ | % | |
| G5Z | −104 | 1.5 | 43.26 | −97 | 1.4 | 37.12 | −87 | 18.25 | 1.2 | −81 | 0.2 | 1.37 | – | – | – |
| G9Z | −105 | 1.5 | 45.84 | −98 | 1.3 | 27.29 | −89 | 23.92 | 1.3 | −81 | 0.2 | 2.95 | – | – | – |
| G13Z | −105 | 1.6 | 52.04 | −97 | 1.2 | 24.42 | −87 | 18.63 | 1.3 | −82 | 0.2 | 3.47 | −76 | 0.3 | 1.44 |
| G17Z | −105 | 1.4 | 39.06 | −97 | 1.2 | 28.18 | −89 | 25.66 | 1.5 | −81 | 0.2 | 7.10 | – | – | – |
δ – chemical shift, ±1ppm; Δ – peak width, ±0.5kHz; % – integrated intensity, ±2.
As can be noticed from 29Si MAS NMR results the quartz determined by XRD measurements could not be identified by NMR probably due to the much longer T1 relaxation time observed in crystalline systems mostly for spin-1/2 nuclei such as 29Si [16].
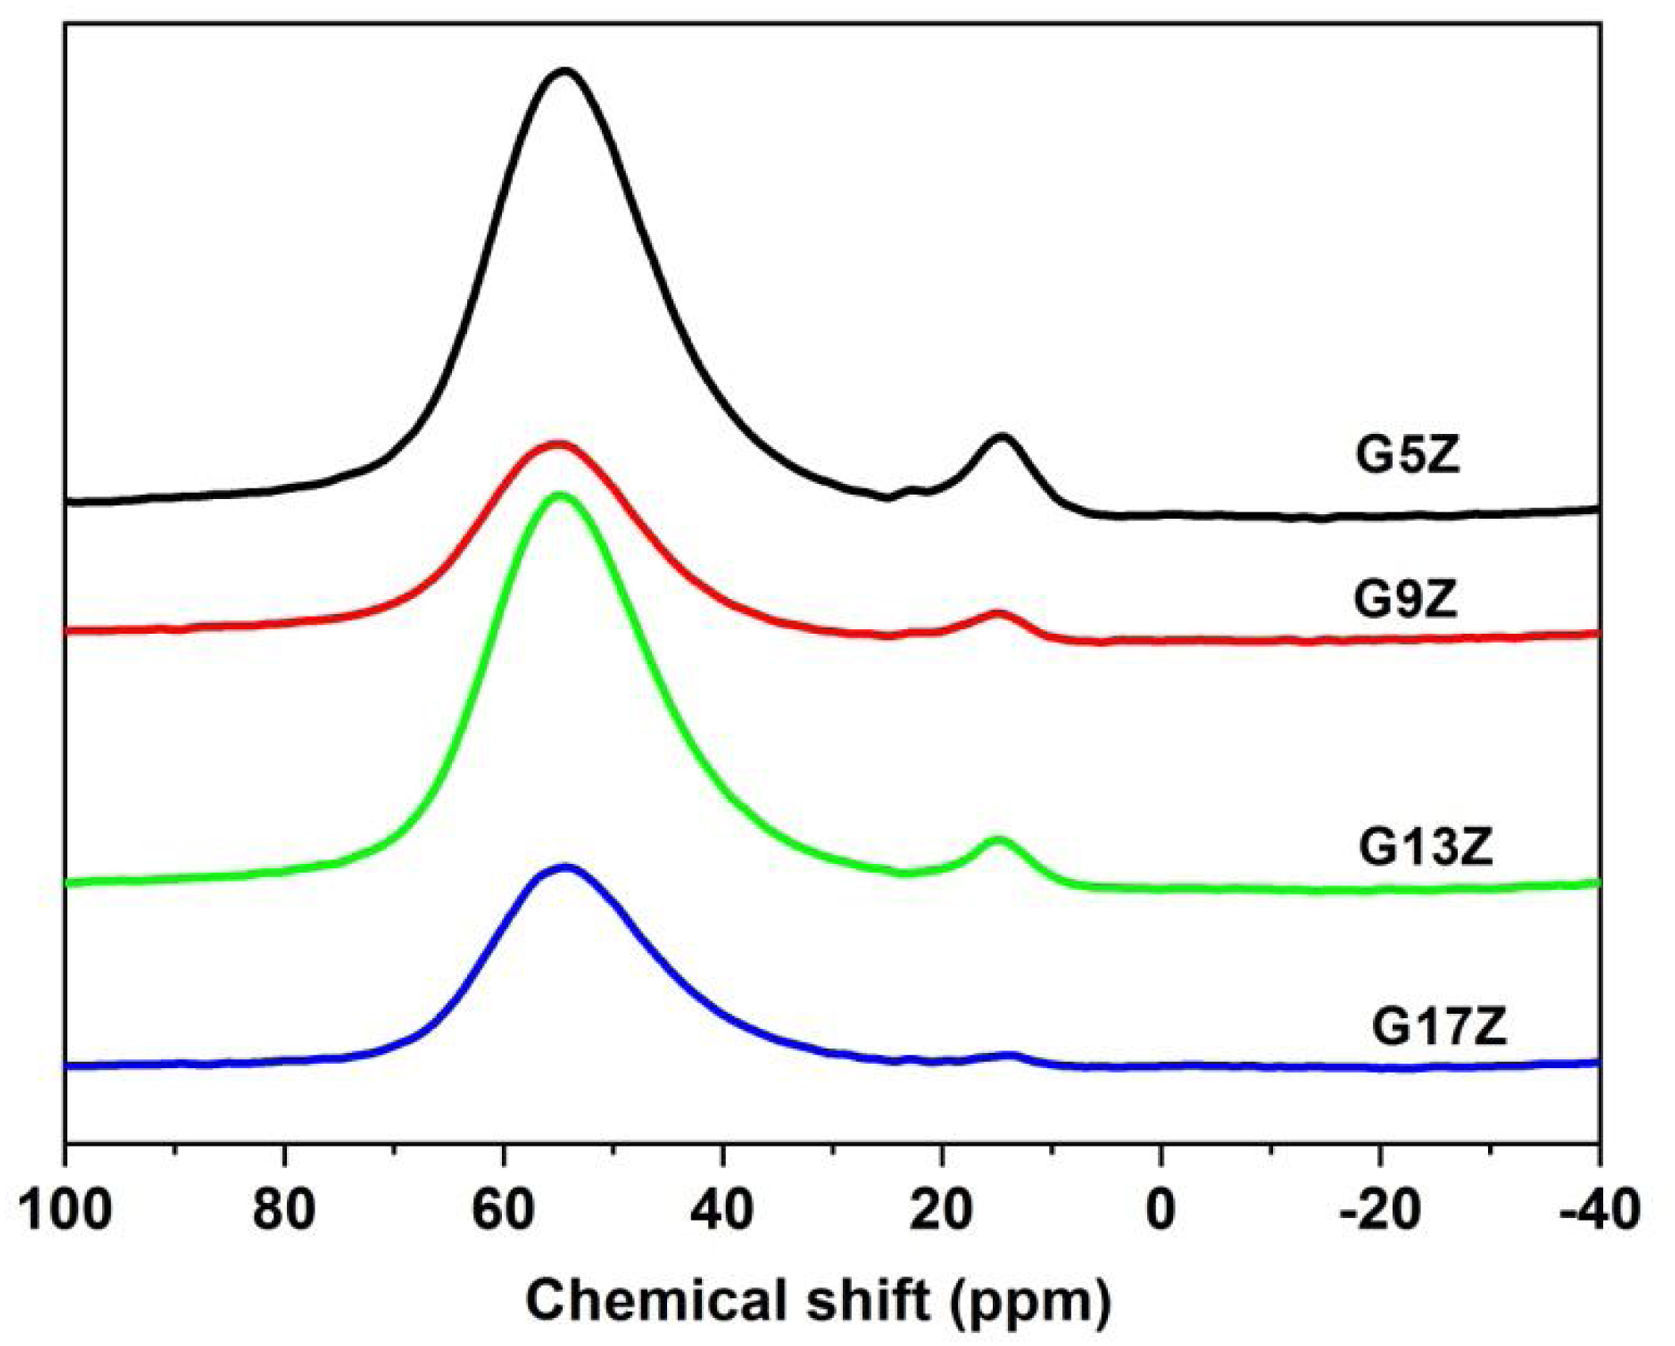
27Al MAS NMR27Al solid-state MAS NMR spectra of the studied ceramic glazes are presented in Fig. 3 and the deconvolution results are listed in Table 4. The FWHM of the 27Al MAS NMR resonance is not reported, due to the second-order quadrupolar peak broadening of this nucleus [16]. The 27Al MAS NMR spectra of ceramic glazes display two resonances at ca. 54ppm and 13ppm respectively. The first resonance corresponds to AlO4 (over 90%) suggesting that aluminum acts mainly as a network former in the ceramic glazes under investigation. A small quantity of AlO6 form, indicating that to some extend aluminum acts a network modifier as well, was also identified. This finding is well correlated with the structural role of aluminum and its intermediate behavior. When Al acts as a network former, the equilibrium of electric charge, is usually achieved by charge compensating alkali or alkaline-earth cations (one Me+ ion in a neighbor of one AlO4−, one Me2+ ion in a neighbor of two AlO4− or one non-bridging oxygen NBO as well as one AlO4−). If such ions are not available for charge compensating the neutrality of negatively charged AlO4− tetrahedra is achieved by changing Al coordination to a higher number that assumes a positive charge. Non-framework alkali or alkaline-earth cations can act as either charge-balancing or network modifying cations depending on composition leading to the formation of NBO and as a result decreases the degree of polymerization.
Raman spectroscopy
Raman spectroscopy has enabled structural investigation of both crystalline and vitreous phases present in silicate glass-ceramics.
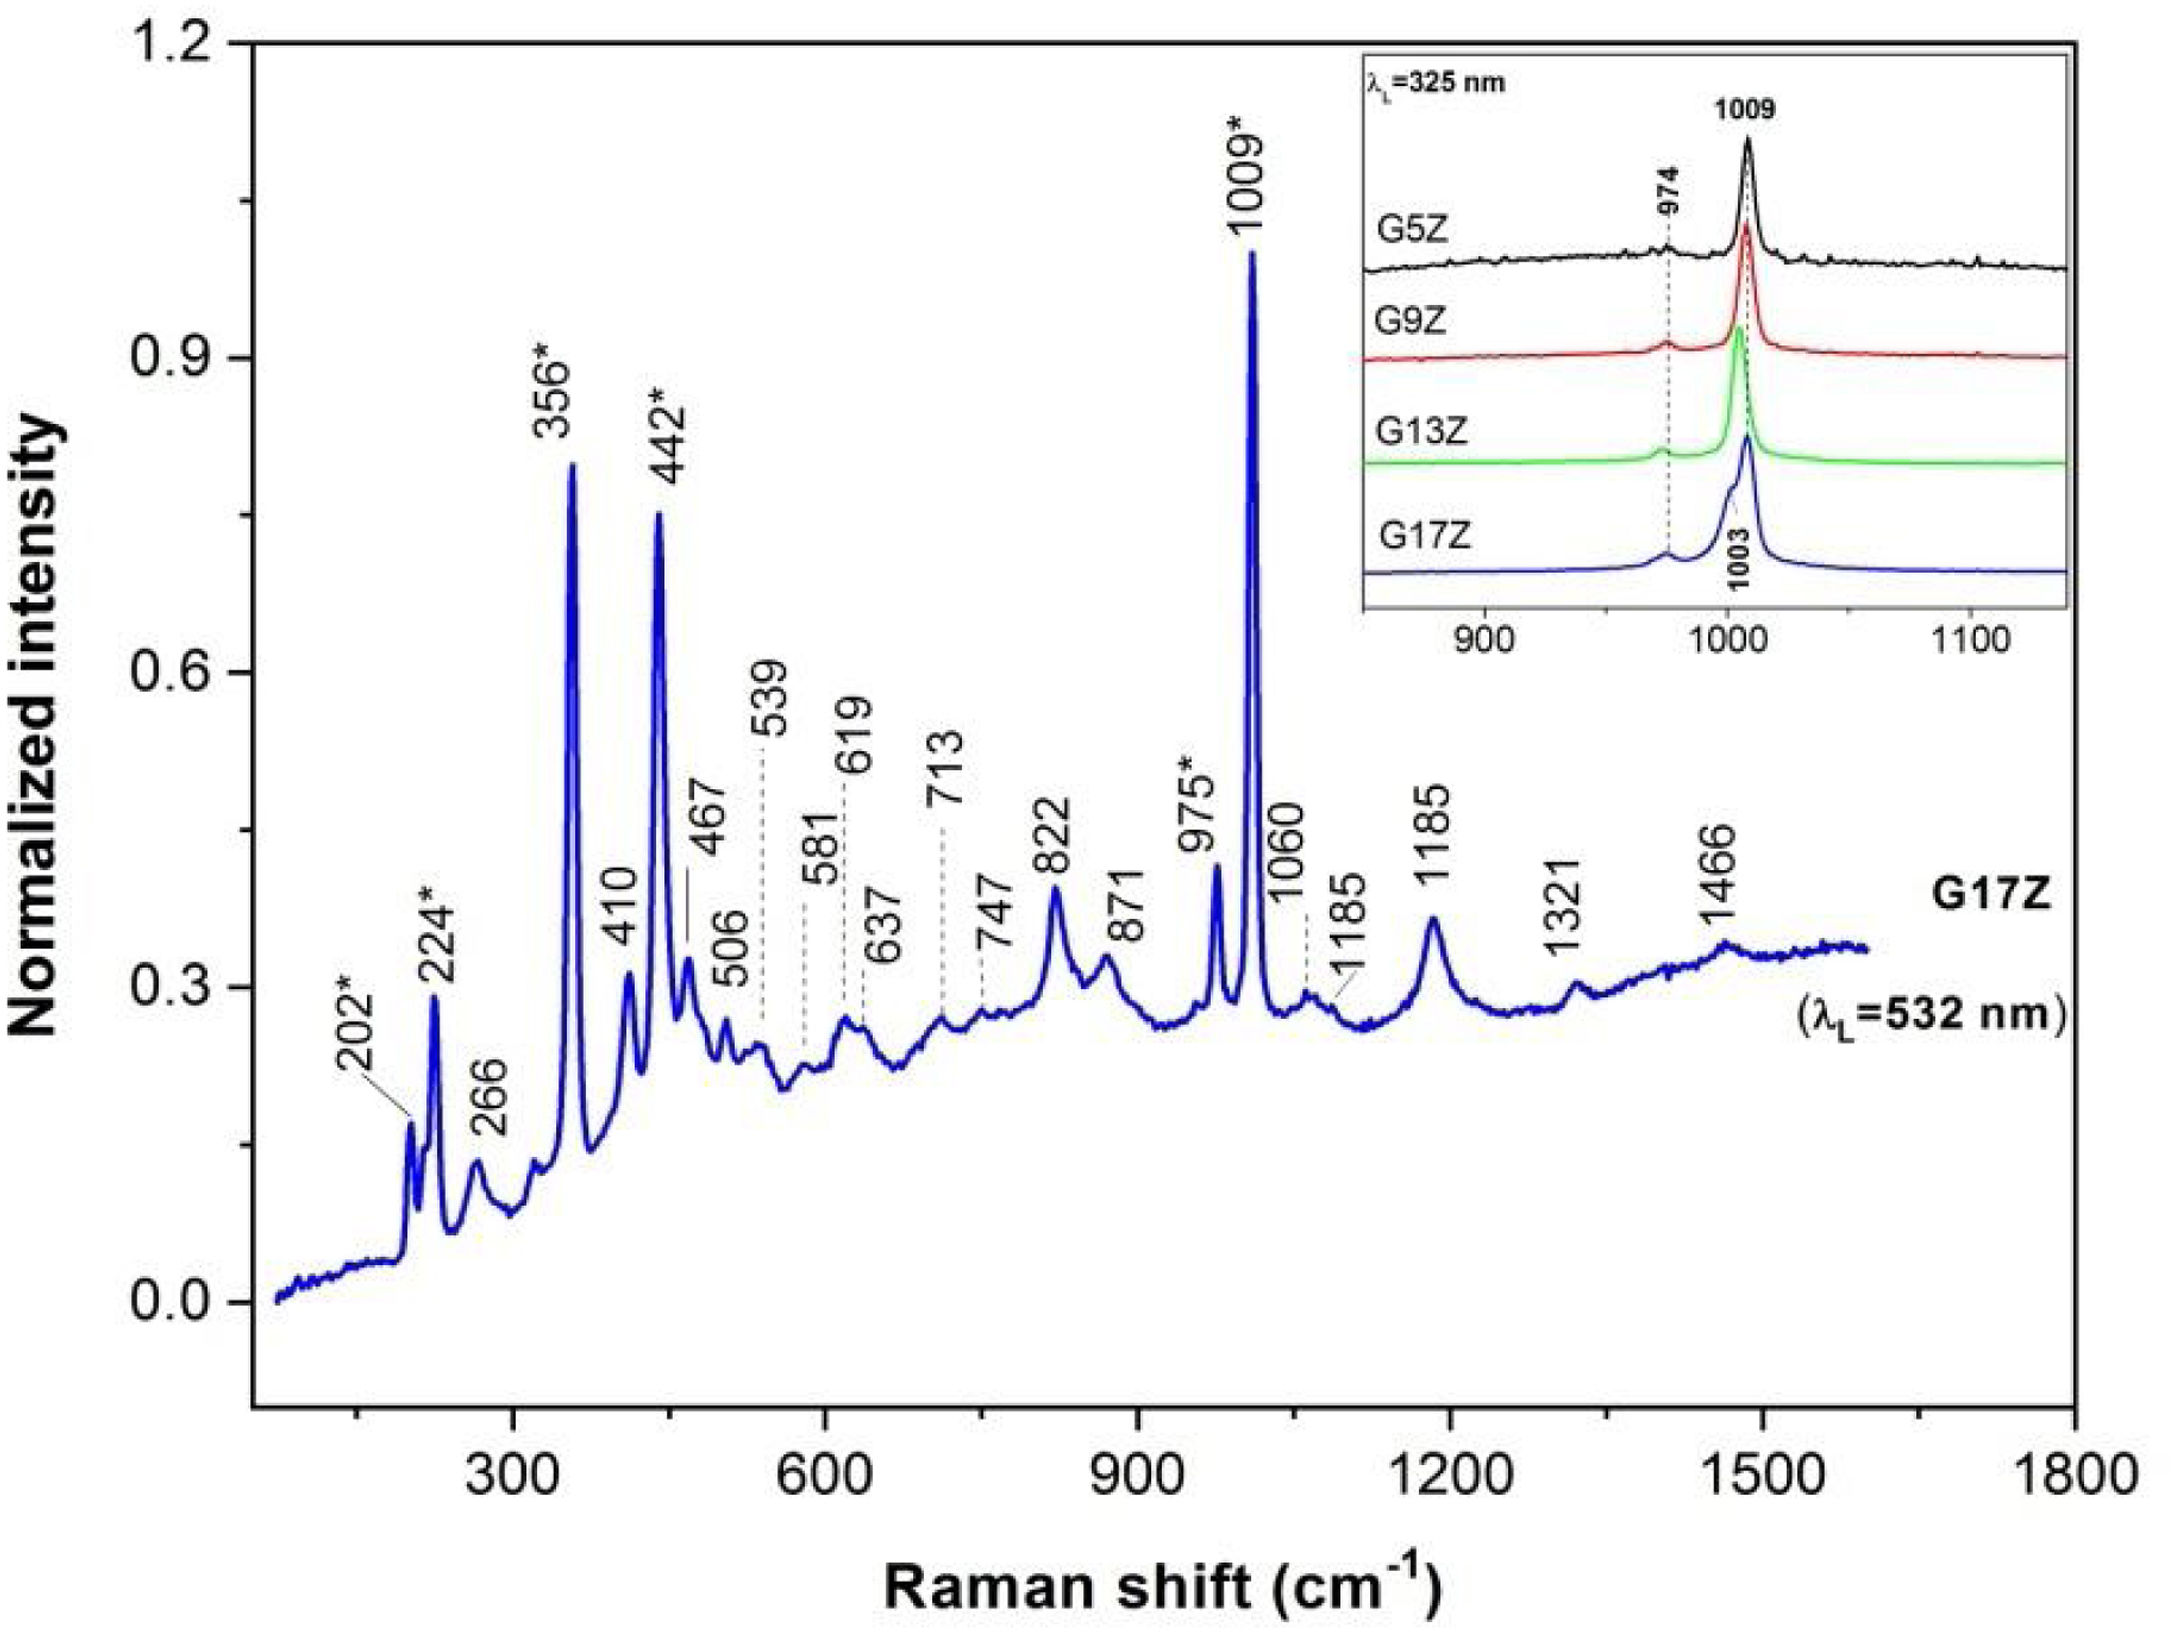
Spectral features of zircon, ZrSiO4, at 1009cm−1 (ν3 modes of SiO4 with B1g symmetry), 975cm−1 (ν1 modes with A1g symmetry), 440cm−1 (ν2 symmetric bending in isolated SiO4, Q°, with A1g symmetry) and 269cm−1 (B2g, ν2 bending) and less intense external modes (356, 224 and 202cm−1) [17,18] prevail in the Raman spectrum of G17Z in Fig. 4. More intense zircon spectral features are present in the UV-Raman spectra of the G (5/9/13/17) Z glazes either due to higher zircon content at the surface and/or resonant Raman effect (see inset of the Fig. 4). Lowering of the zircon symmetry in the G13Z spectrum caused shifting of the ν1 and ν3 modes toward lower wavenumbers (inset of the Fig. 4). Moreover, G17Z glaze contains both zircon and lowered symmetry zircon (the 1009cm−1 band and its shoulder at 1003cm−1). Lack of the doublet at ∼179/191cm−1 invalidates formation of monoclinic zirconia [19] in case of G17Z. Much wider and less intense peaks at 142, 266 and 478cm−1 (shoulder of the 467cm−1 peak) might originate from amorphous zirconia [19]. Presence of α-quartz in the G17Z might be signaled by the peak at 467cm−1[20].
. Inset represents UV-Raman spectra of the G(5/9/13/17)Z ceramic glazes over 850–1140cm−1 range.")
Despite low content of the B2O3 in the G (5/9/13/17) Z glazes, tinny bands at 1321 and 1466cm−1 might belong to BØ2O− linked to AlØ4− in aluminum metaborates (Ø is bridging oxygen) and BO stretching mode in (BO3)− metaborate rings and/or chains, respectively [21,23]. Wide peaks at 822, 871, 1059, 1089 and 1185cm−1 are attributable to symmetric SiO stretching of the Q0, Q3 and Q4 units (0, 3 and 4 stand for number of bridging oxygen per SiO4 tetrahedra) in silicate glasses [22–24]. The other two regions of the Raman spectra of the silicate glasses, e.g. <400cm−1 due to lattice modes and network modifying cations as well as 400–800cm−1 range originating from SiOSi bending modes among SiO4 tetrahedra [25], are rather overwhelmed by the strong zircon modes (Fig. 5).
IR spectroscopy
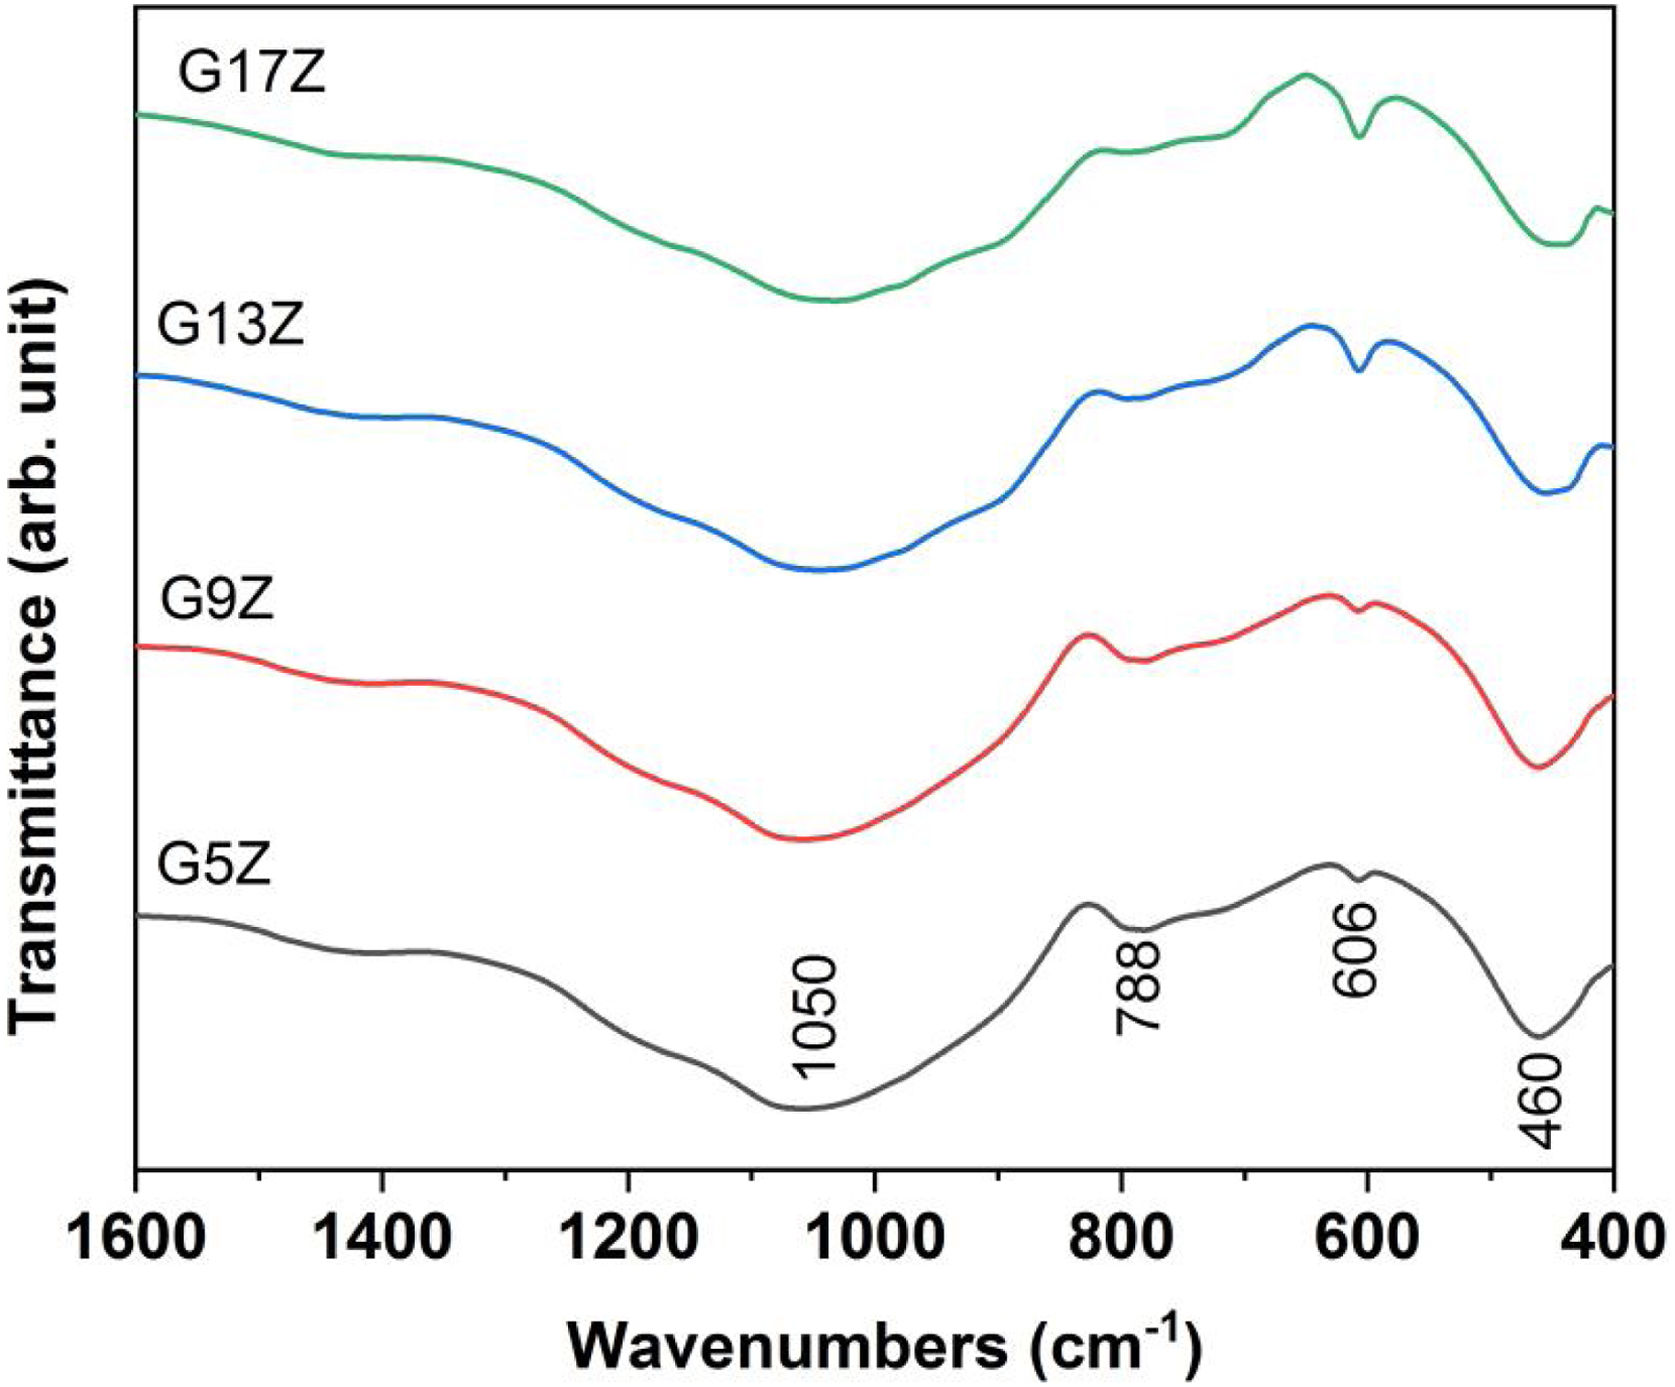
FTIR spectra displayed in Fig. 5 reveal the presence of three vibration bands corresponding to SiOSi bonds: the broad one at 1050cm−1(asymmetric stretching vibration), at 788cm−1 (symmetric stretching vibration) and 460cm−1 (bending vibrations) respectively [26]. The displacement of the first two bands regarding to those of silica (1080 and 800cm−1) is due to the presence of network modifiers (K2O, Na2O, CaO, ZnO) in ceramic glazes formulation. Along with the vibration bands related to the silica network, a vibration band at 606cm−1 attributed to SiOZr bond of ZrSiO4 was also noticed [27]. An increase of the band intensity located at 606cm−1 with the increasing amount of formed zircon was observed.
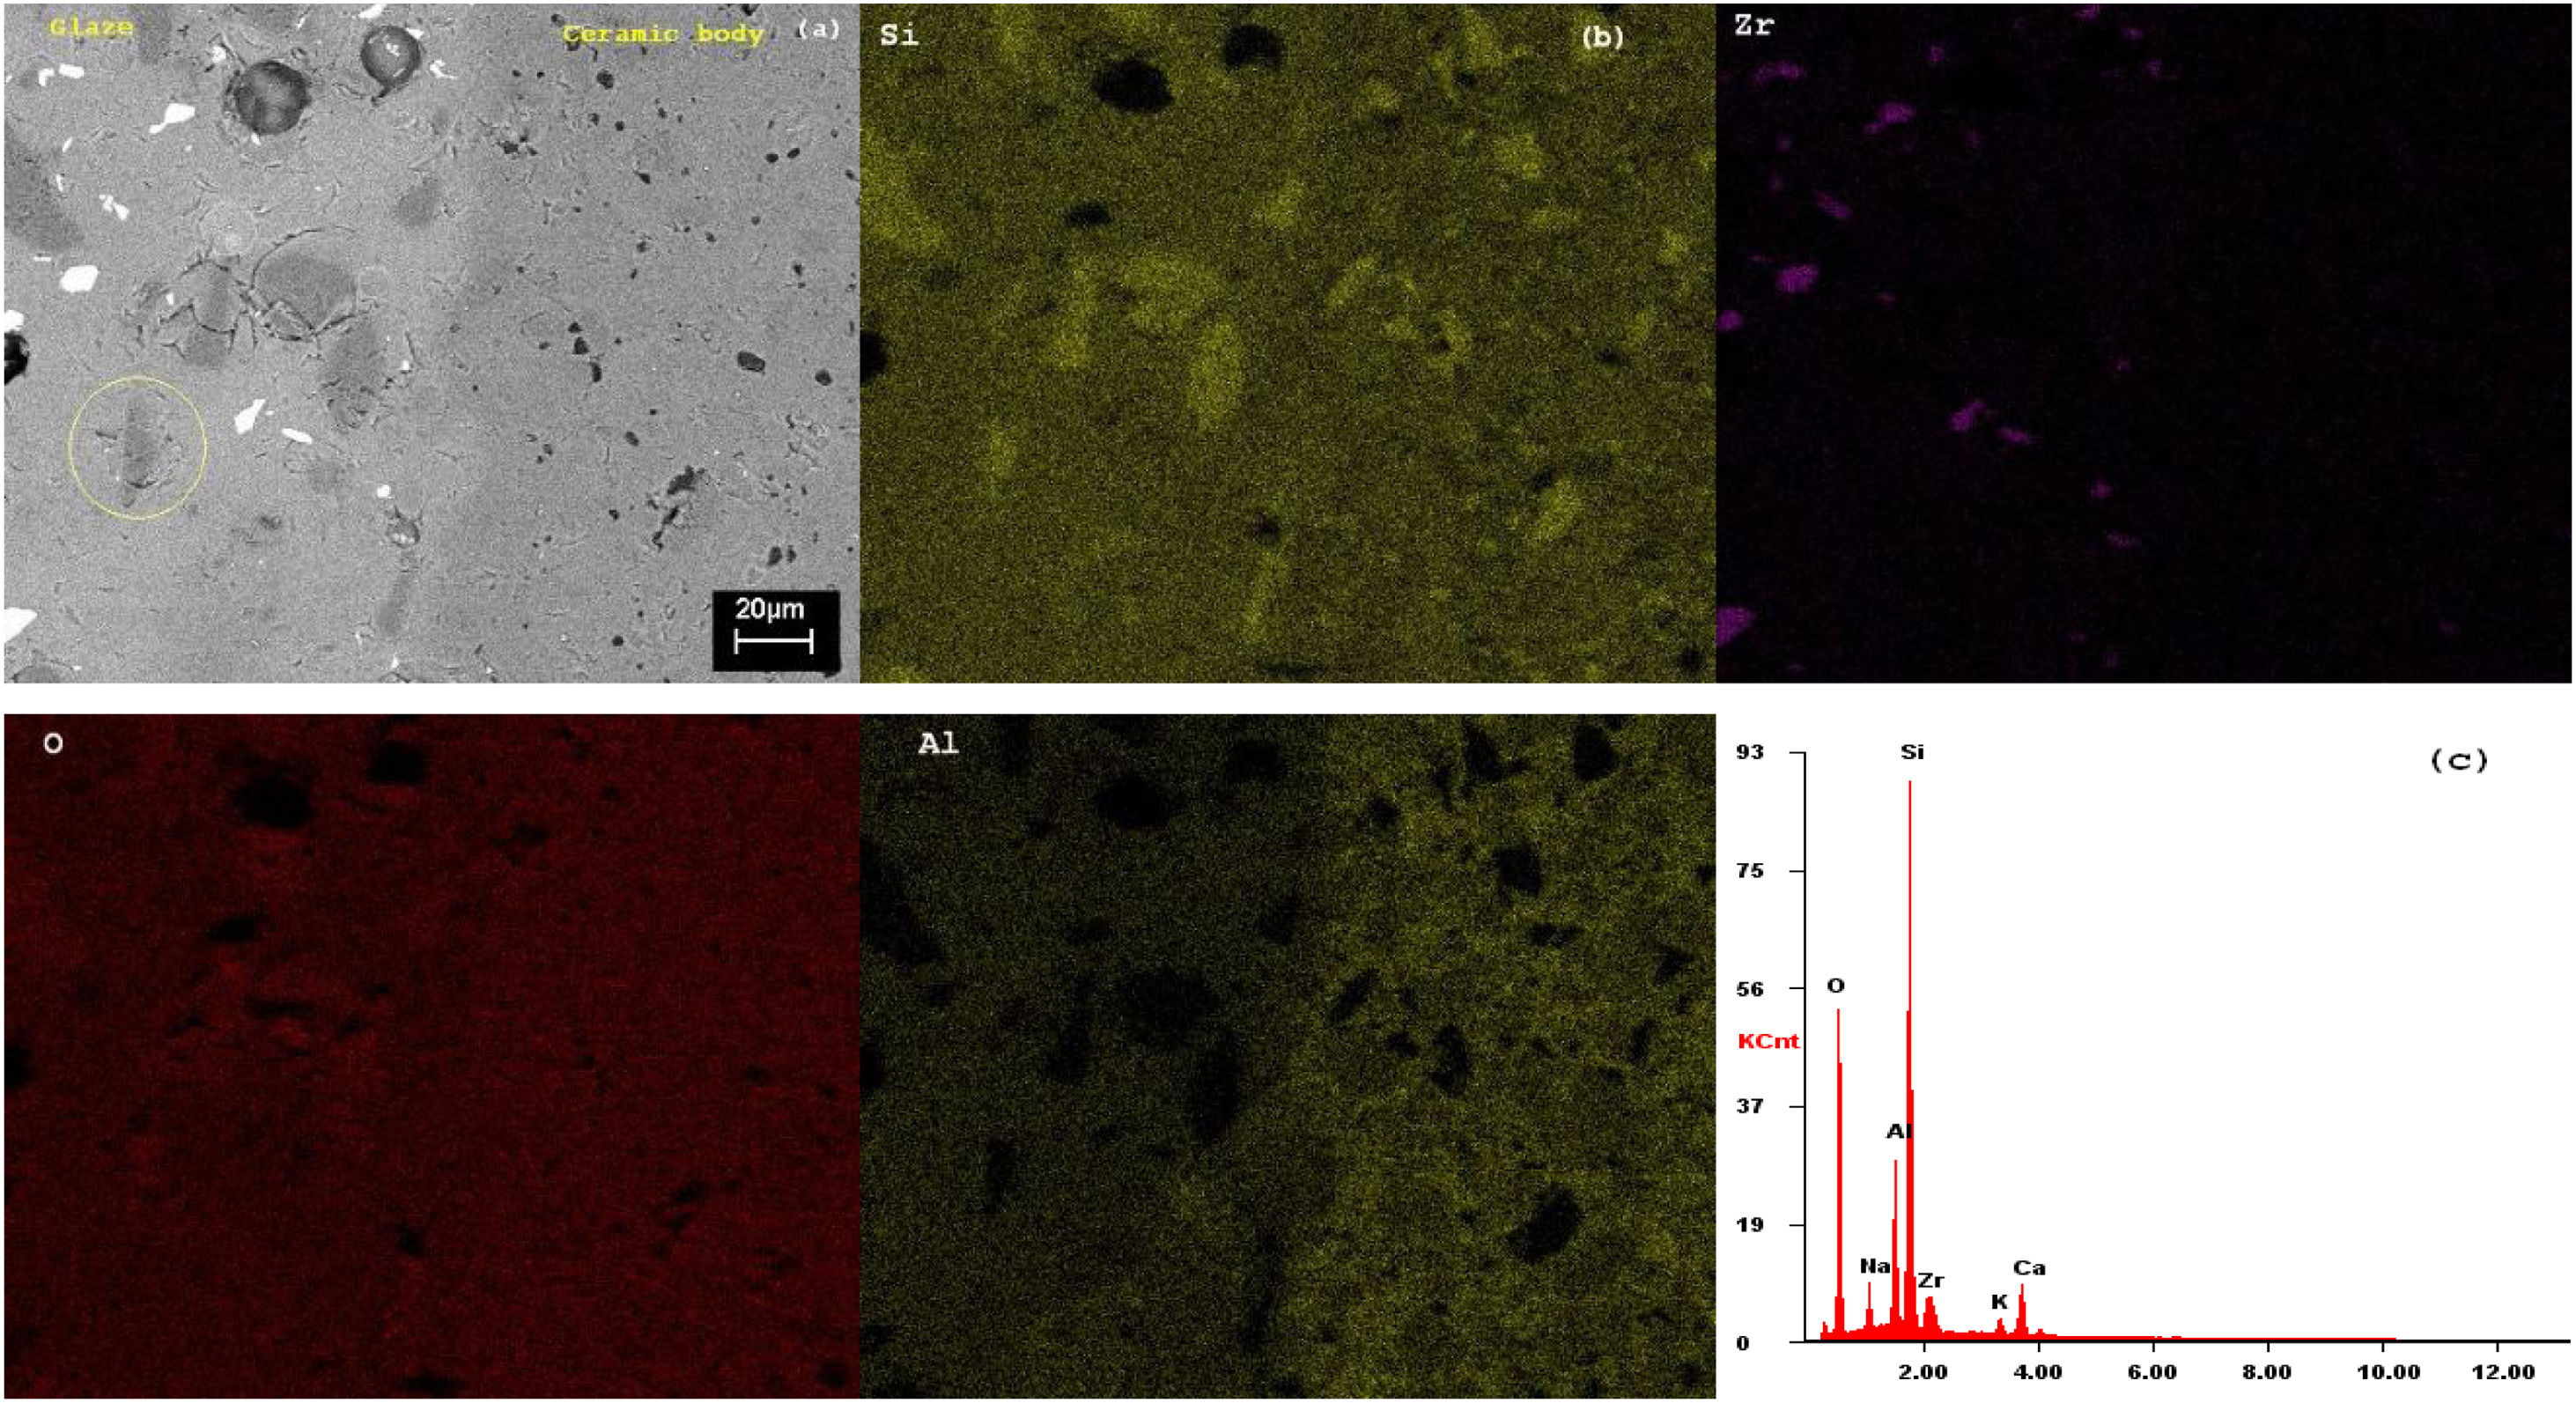
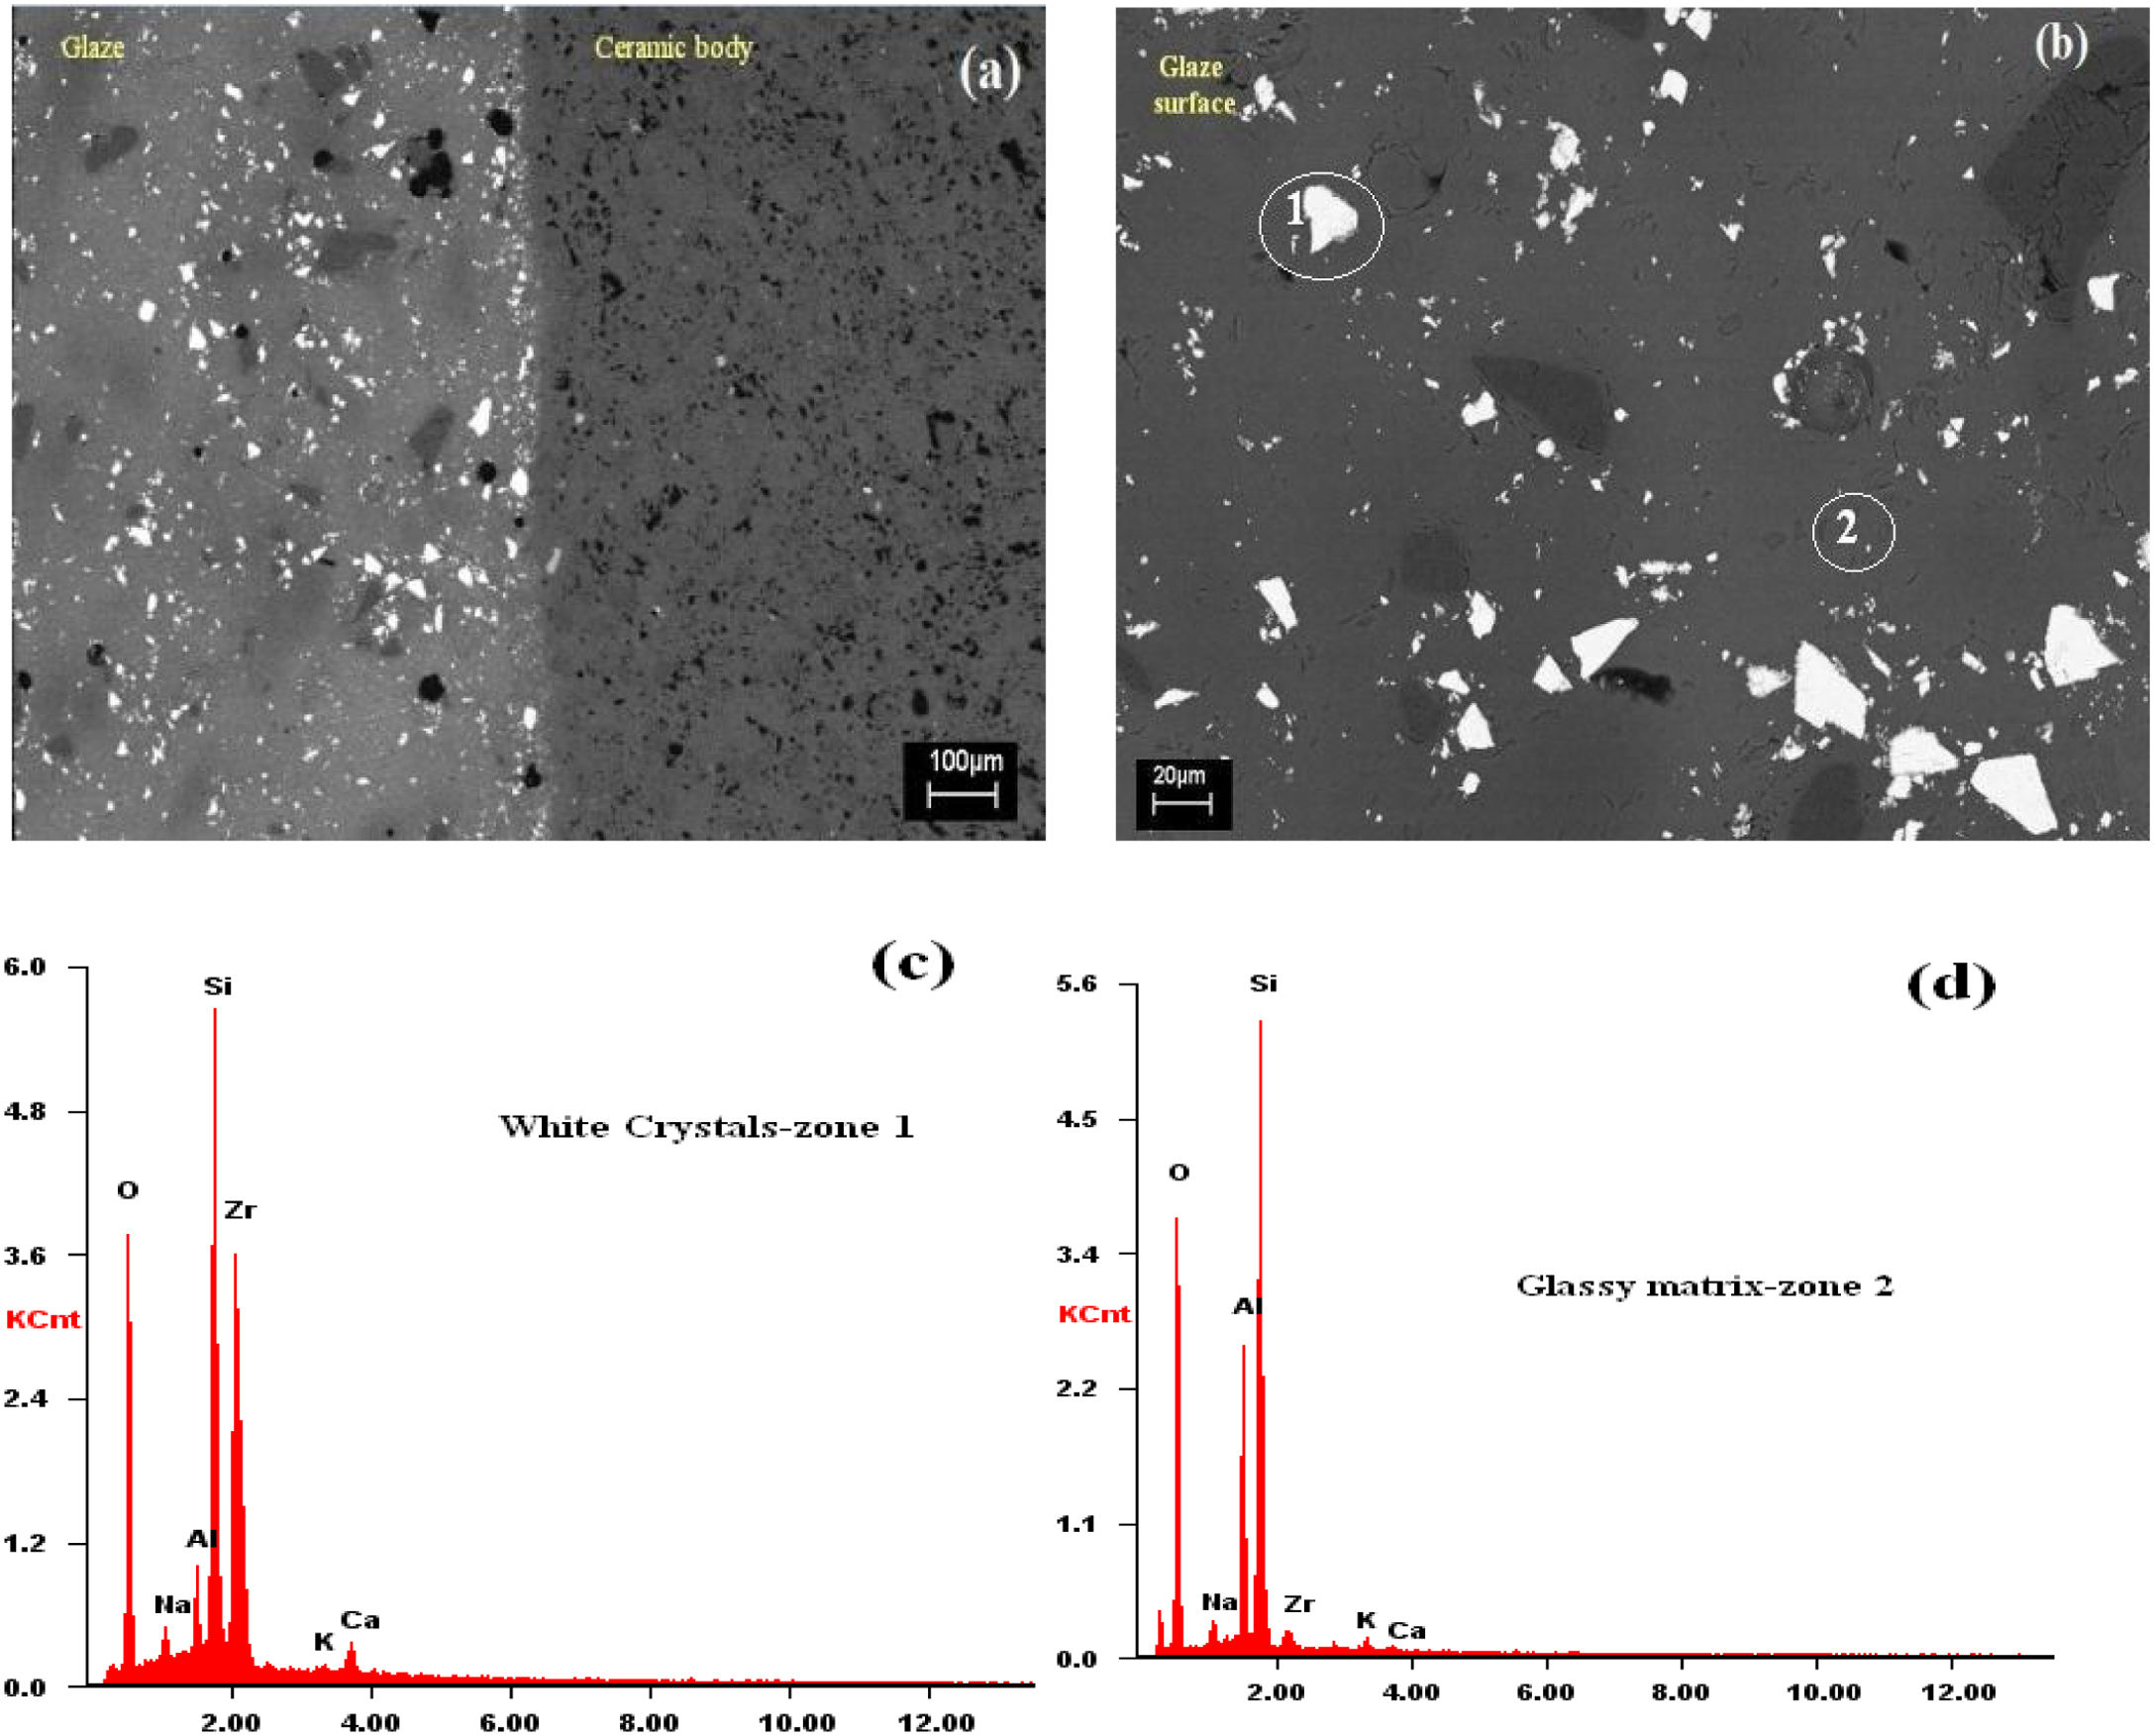
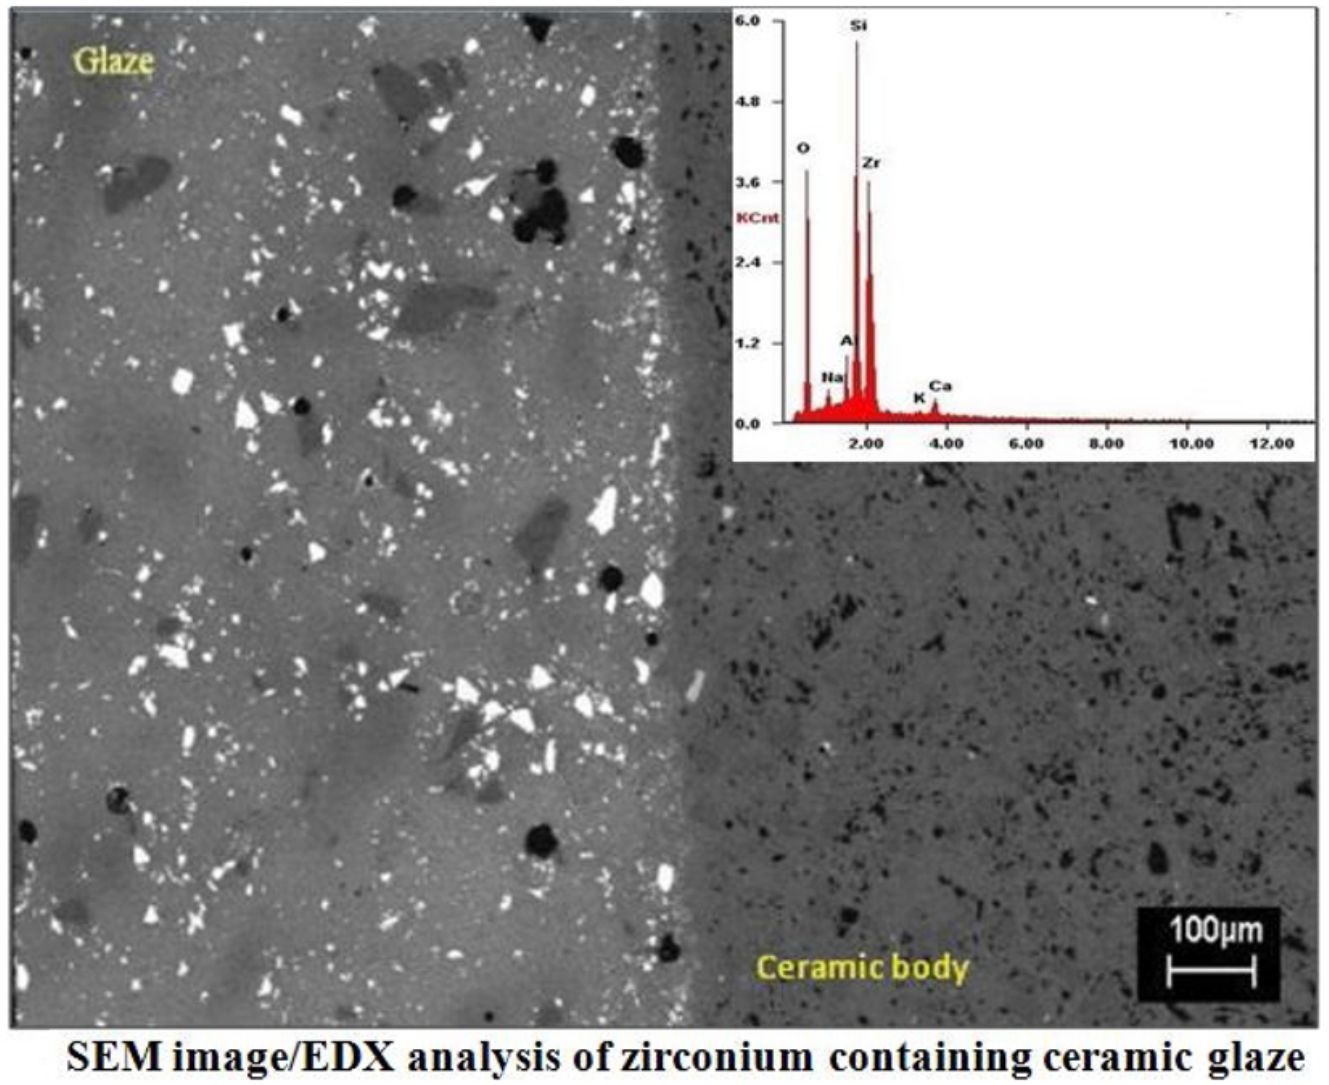
SEMSEM investigations of the G5Z and G17Z ceramic glazes are shown in Figs. 6 and 7. The microstructure of the glaze surface is quite heterogeneous consisting of crystalline phases and residual glassy matrix which appears in dark contrast. The EDX analysis of the glassy matrix (Fig. 7b) exhibited the presence of silicon, aluminum and oxygen as predominant constituents. The white crystals are assigned to ZrSiO4 as a result of zirconia reaction with silica while the darker crystals (indicate by the circle in Fig. 7a) seem to correspond to quartz as was revealed by EDX element map (Fig. 7b) and in good agreement with XRD results. Si accumulation constitutes a part of the ceramic body as well as the glaze. The white crystals are all enriched in Zr indicating the formation of zircon. Moreover, the EDX spectra of the surface of ceramic glazes (Figs. 6c and 7c) confirm also zircon crystallization.
 EDX mapping for Zr, Si, Al, and O (b) and EDX analysis of the surface of ceramic glaze (c).")
 glaze surface (b) and the EDX analyses of the white crystals (c) and, glassy matrix (d).")
The chemical durability of the prepared ceramic glazes in acidic and alkaline solutions was determined according to DIN 12116 and ISO 695 respectively. The obtained results are presented in Table 5. As can be observed, a very good chemical resistance against the hydrochloric acid solution was obtained for G13Z and G17Z ceramic glazes with the highest zircon content and degree of crystallinity. In contrast, the G5Z and G9Z ceramic glazes with lower content of ZrSiO4 received chemical acid resistance classification (class 2). Standard DIN 12116 divides glass types into four classes. If half the weight loss of the surface removal is less than 0.7mg/100cm2 glass type is classified as class 1 highly acid resistance, above 0.7 up to 1.5mg/100cm2 class 2 acid resistance, above 1.5 up to 15mg/100cm2 slight acid attack and above 15mg/100cm2 high acid attack [27]. Further, all studied ceramic glazes received class 1 chemical alkali resistance (solution, consisting of equal volumes of sodium hydroxide and sodium carbonate). According to DIN ISO 695 if the weight loss of the glass after 3h of boiling is less than 75mg/100cm2, the glass is alkali resistance class 1. Between 75 and 175mg/cm2 slight alkali attack, above 175mg/cm2 high alkali attack [28].
An improvement of the chemical resistance to acid attack (from class 3 to class 2) was achieved in the present study compared to our previous work when ZrSiO4 was added as raw materials in glaze formulation [29]. It is known that the chemical resistance of ceramic glaze is related to its chemical composition and structure being a combination of the resistance of the glassy matrix, crystalline phases as well as the interfacial layer between them [30].
Depending on the properties as described above and exposure conditions (the type of solution, temperature, and time of exposure), the glaze surface can undergo ion exchange, dissolution or absorption reactions. Usually, ceramic glazes are resistant to acidic attack (excepting hydrofluoric acid) and alkalis attack. Alkali cations from the ceramic glaze network associated with less extent polymerized SiO4 tetrahedral network are released to the acidic solutions by ion exchange with H+ or H3O+[29]. This reaction leads to the formation of a silica gel layer on the surface that acts as a barrier for further reactions. Furthermore, the alkali ions compensate for the negative charge such as AlO4− and in this role are strongly bounded and cannot be easily detached during the corrosion process. The rate of the process is controlled by the diffusion rate of the ions, and decreases with time.
When the glaze surface is exposed to alkaline attack the dissolution of the glass network takes place by rupture of the SiO bonds at a constant rate [31].
The substitution of SiO2 by ZrO2 improves the chemical resistance of the glaze and makes it less sensitive to changes in pH solution. Zirconia can take part in glaze structure as a network former or network modifier leading to an increase of bridging oxygen atoms per silicon and as a result ceramic glazes in the presence of Zr4+ will have a more packed structure and higher resistance [32].
ConclusionsIn the present study, raw ceramic glazes with the addition of 5, 9, 13, 17wt% ZrO2, and 5wt% of colemanite as a fluxing agent were prepared to evaluate zircon formation and its effect on glaze properties.
XRD, 29Si MAS NMR, SEM-EDX, FTIR, and Raman Spectroscopy confirm the formation of ZrSiO4 during the firing temperature of 1250°C. XRD reveals an increase of ZrSiO4 amount from 35 to 86wt% with the increase of ZrO2 content. Quantification of the relative intensity of zircon resonance in the 29Si NMR spectra of ceramic glazes increases in the G5Z-G17Z series from 1.37 to 7.10%.
The chemical resistance results showed that the formation of ZrSiO4 has a positive effect on the chemical resistance of the studied ceramic glazes.
The obtained results recommend the raw ceramic glazes prepared and investigated in the present study to be used as a cost-effective replacement to fritted compositions for ceramic substrates.
E.M.A. thanks Dr. Marius Enachescu for access to the Raman facilities.

