


Respiratory monitoring is important in the care of children with acute respiratory failure. Therefore, its proper use and correct interpretation (recognizing which signals and variables should be prioritized) should help to a better understanding of the pathophysiology of the disease and the effects of therapeutic interventions. Also, ventilated patient monitoring, among other determinations, allows evaluating various parameters of respiratory mechanics, knowing the status of the different components of the respiratory system and guiding the adjustments of ventilation therapy.
In this review, the utility of several techniques of respiratory monitoring including conventional respiratory monitoring and more recent methods are described. Moreover, basic concepts of mechanical ventilation, their interpretation and how the appropriate analysis of the information obtained can cause an impact on the clinical management of the patient are defined.
La monitorización respiratoria representa un importante rol en el cuidado del niño con falla respiratoria aguda. Por tanto, su apropiado uso y correcta interpretación (reconociendo qué señales y variables deben ser priorizadas) deberían ayudar a un mejor entendimiento de la fisiopatología de la enfermedad y de los efectos de las intervenciones terapéuticas. Asimismo, la monitorización del paciente ventilado permite, entre otras determinaciones, evaluar diversos parámetros de la mecánica respiratoria, conocer el estado de los diferentes componentes del sistema respiratorio y guiar los ajustes de la terapia ventilatoria.
En esta actualización se describe la utilidad de diversas técnicas de monitorización respiratoria incluyendo métodos convencionales y otros más recientes, se definen conceptos básicos de mecánica ventilatoria, su interpretación y cómo el adecuado análisis de la información puede ocasionar un impacto en el manejo clínico del paciente.
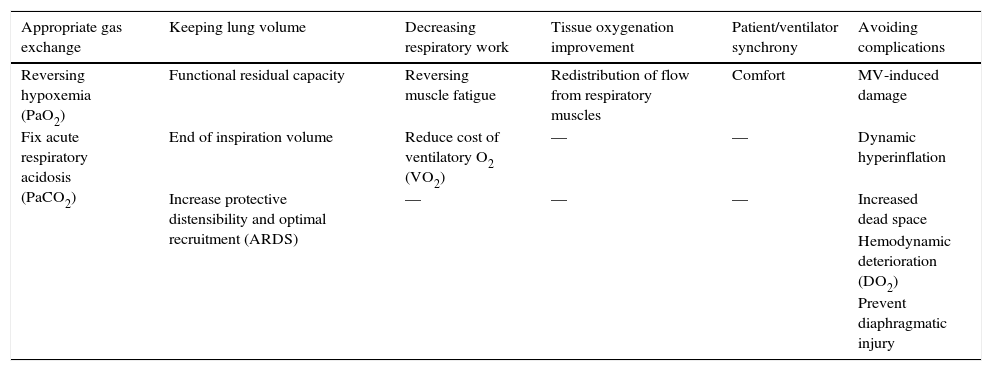
The objectives of mechanical ventilation (MV) have changed over the course of the last few decades1–5 (Table 1). Since they are beyond the exclusive adequacy of gas exchange, the treating physician should achieve the monitoring of a set of physiological parameters, in addition to the possible alterations that cause lung damage or distant organic dysfunction.
Clinical and laboratory objectives and complications to monitor in mechanical ventilation.
| Appropriate gas exchange | Keeping lung volume | Decreasing respiratory work | Tissue oxygenation improvement | Patient/ventilator synchrony | Avoiding complications |
|---|---|---|---|---|---|
| Reversing hypoxemia (PaO2) | Functional residual capacity | Reversing muscle fatigue | Redistribution of flow from respiratory muscles | Comfort | MV-induced damage |
| Fix acute respiratory acidosis (PaCO2) | End of inspiration volume | Reduce cost of ventilatory O2 (VO2) | — | — | Dynamic hyperinflation |
| Increase protective distensibility and optimal recruitment (ARDS) | — | — | — | Increased dead space | |
| Hemodynamic deterioration (DO2) | |||||
| Prevent diaphragmatic injury |
PaO2, oxygen arterial pressure; MV, mechanical ventilation; PaCO2, carbon dioxide arterial pressure; VO2, oxygen consumption; ARDS, acute respiratory distress syndrome; DO2, oxygen delivery.
The ideal clinical monitoring should describe anatomical and physiological changes at the regional level, should be noninvasive, fast processing and available at the patient bedside.
Currently, multiple parameters deliver objective data, which allow to evaluate specific therapeutic interventions, establish diagnoses, goals and avoid complications caused by dynamic changes in the patient.
In the critical patient, the monitoring of respiratory mechanics is emphasized to adjust the strategy and personalize the prescription of the MV. However, this is just one of the aspects to be evaluated.
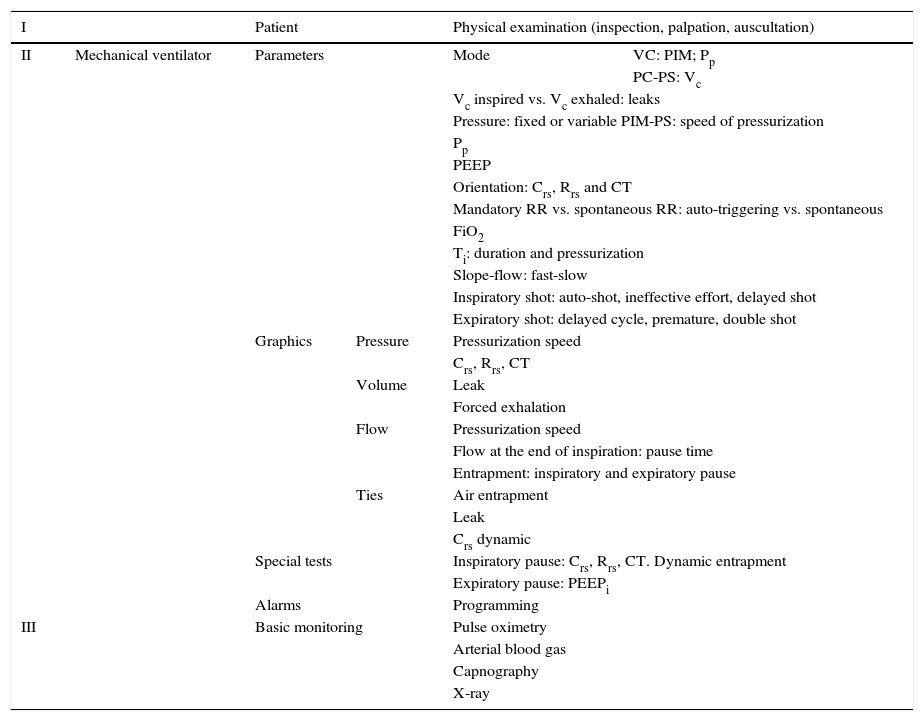
The objective of the present study was to review the evaluation of gas exchange, the main available monitoring techniques, maneuvers and respiratory mechanics calculations and studies in the pediatric patient. Multimodal monitoring to consider in the ventilated patient is summarized in Table 2. Finally, future modalities of monitoring, particularly biomarkers, are discussed.
Multimodal monitoring to consider in the mechanically ventilated patient.
| I | Patient | Physical examination (inspection, palpation, auscultation) | |||
|---|---|---|---|---|---|
| II | Mechanical ventilator | Parameters | Mode | VC: PIM; Pp | |
| PC-PS: Vc | |||||
| Vc inspired vs. Vc exhaled: leaks | |||||
| Pressure: fixed or variable PIM-PS: speed of pressurization | |||||
| Pp | |||||
| PEEP | |||||
| Orientation: Crs, Rrs and CT | |||||
| Mandatory RR vs. spontaneous RR: auto-triggering vs. spontaneous | |||||
| FiO2 | |||||
| Ti: duration and pressurization | |||||
| Slope-flow: fast-slow | |||||
| Inspiratory shot: auto-shot, ineffective effort, delayed shot | |||||
| Expiratory shot: delayed cycle, premature, double shot | |||||
| Graphics | Pressure | Pressurization speed | |||
| Crs, Rrs, CT | |||||
| Volume | Leak | ||||
| Forced exhalation | |||||
| Flow | Pressurization speed | ||||
| Flow at the end of inspiration: pause time | |||||
| Entrapment: inspiratory and expiratory pause | |||||
| Ties | Air entrapment | ||||
| Leak | |||||
| Crs dynamic | |||||
| Special tests | Inspiratory pause: Crs, Rrs, CT. Dynamic entrapment | ||||
| Expiratory pause: PEEPi | |||||
| Alarms | Programming | ||||
| III | Basic monitoring | Pulse oximetry | |||
| Arterial blood gas | |||||
| Capnography | |||||
| X-ray | |||||
VC, ventilation controlled by volume; MIP, maximal inspiratory pressure; Pp, plateau pressure; PC, ventilation controlled by pressure; PS, support pressure; Vc, tidal volume; PEEP, positive end expiratory pressure; Crs, compliance of the respiratory system; Rrs, resistance of the respiratory system; CT, constant of time; RR, respiratory rate; FiO2, fraction of inspired oxygen; Ti, time of inspiration; PEEPi, intrinsic PEEP.
As in any medical act, the adequate inspection of the patient in MV is significant. Once the endotracheal intubation is performed and the patient is connected to the ventilator, chest expansion, pulmonary auscultation, and peripheral tissue perfusion must be evaluated. The physician can assess whether the ventilation support is suitable for the demand of the patient through the verification of indirect signs, such as sweating, tachycardia, and hypertension (adrenergic response).
It is important to note that auscultation should be understood as a complement to more accurate diagnostic methods. Two centuries have passed since René Théophile Hyacinthe Laënnec (1781-1826) invented the stethoscope,6 which became an element of immediate availability and diagnostic support. Nevertheless, it presents some drawbacks since the interpretation of the information obtained is subjective and of scarce consistency.7 Therefore, it is considered as a more descriptive than a quantitative instrument in pulmonary assessment.
2.1Basic respiratory monitoringConsidering that acute respiratory failure is one of the main causes of admission in the pediatric intensive care units (PICU), the continuous monitoring, reliability, and accuracy of different respiratory parameters both in the admission and the posterior follow-up of the patient allow the early detection of an acute respiratory failure. Also, the evaluation of the need of ventilator support, the response to treatment, the decrease in the associated complications with MV, the optimization of the patient/ventilator interaction, and the determination of the moment when the patient is in condition to weaning. However, the monitoring by itself does not imply a specific management for the patient nor leads to a determined therapeutic result. Everything will depend on the knowledge and the ability of the person who interprets the information.
In general terms, indicators of gas exchange, such as oxygenation, ventilation, dead space and those relating to pulmonary mechanics should always be assessed.
3Fundamentals of mechanical ventilation monitoring3.1Mechanical properties of the respiratory systemThree basic concepts will be defined to understand the behavior of the respiratory system: the unit of volume displaced per unit of time, referred to as flow; the opposition to the flow of air caused by the friction forces, as resistance; and the force that a gas exerts on a surface, as pressure. Considering that the displacement of a gas always occurs in response to pressure gradients—whether caused by the contraction of the respiratory muscles, or by the action of a mechanical ventilator, the transrespiratory pressure gradient between the upper airway (Pao, airway opening pressure) and the existing at the alveolar level (Palv) determine the magnitude of both inspiratory (Pao>Palv) and expiratory flows (Palv>Pao) (Fig. 1A).

Determining elements of the trans-respiratory pressure. A. Schematic representation of the determining elements of the trans-respiratory pressure. B. The equation of motion of the respiratory system. Pvent corresponds to the pressure generated by the ventilator and Pmus to pressure generated by the respiratory muscles to expand the rib cage and lungs. When Pvent=0, it corresponds to a spontaneous ventilation and when Pmus=0, it corresponds to a controlled mode. The partial ventilatory support group is located in between these two.
As is well known, the Hagen-Poiseuille law designates that a relative decrease in the radius (r) produces a noticeable increase in the resistance of the respiratory system (Rsr) (Fig. 2). The constant of proportionality is a mechanical property of the respiratory system called resistance (R=ΔP/V’, where ΔP corresponds to the pressure gradient and V’ to the flow).
. This equation shows the relation between viscosity (Visc), length (Length), and the radius (r4).")
Hooke's law, which designates that ΔP is proportional to the flow change (ΔV), is useful to analyze the properties of elastic structures. The constant of proportionality is the mechanical property of the respiratory system known as elastance of the respiratory system (Ers) and is defined as the pressure per unit of volume (Fig. 3A). Usually, in clinical monitoring, its reciprocal value, compliance (Crs), is calculated (Fig. 3B). This property determines the value of the Palv at any time during the respiratory cycle, and it is the cause of the elastic retractive force of passive expiration.
. Mechanical property of the respiratory system that relates volume (ΔV) and pressure changes (ΔP). Pp: plateau pressure; PEEPt: total positive end expiratory pressure; Vc: tidal volume. B. Equation of the compliance of the respiratory system. Compliance corresponds to the inverse of the elastance. Vc: tidal volume; Pp: plateau pressure; PEEPt: total positive end expiratory pressure.")
Mechanical properties of the respiratory system. A. Equation of elastance of the respiratory system (Ers). Mechanical property of the respiratory system that relates volume (ΔV) and pressure changes (ΔP). Pp: plateau pressure; PEEPt: total positive end expiratory pressure; Vc: tidal volume. B. Equation of the compliance of the respiratory system. Compliance corresponds to the inverse of the elastance. Vc: tidal volume; Pp: plateau pressure; PEEPt: total positive end expiratory pressure.
Finally, inertia is the resistance to deformation of the pulmonary parenchyma and chest wall, which is almost negligible in most clinical situations.
Altogether, these variable constitute the mechanical properties of the respiratory system; therefore, the characterization of each respiratory cycle (measured in the magnitude of ΔV or V’, as well as airway and alveolar pressure changes) is the outcome of the interaction of forces that originate air motion and mechanical properties.
3.2Equation of motion of the respiratory systemAs mentioned previously, the respiratory system pressure at any time has an elastic component necessary for the distension of the pulmonary parenchyma, a resistance component as the air flows through the airway, and an inertial component (negligible for respiratory frequencies less than 1Hz).8
In the spontaneous mode ventilation, the pressure generated by the respiratory muscles (Pmus) is directly proportional to the tidal volume (Vc), to the flow with which that volume is mobilized, to the resistance offered by the airway, and inversely proportional to the Crs. This interaction is described in the mathematical expression known as the equation of motion of the respiratory system (Fig. 1B), which establishes the relationship between the pressure in the airway (Pa), the elastic component, the resistance component and the effort of the inspiratory muscles.9 Thus, the interaction between the ventilator and the patient is ruled by this equation. Therefore, the importance of the equation of motion is based on the following principles:
- 1)
It expresses the volume and V’ at any moment of the respiratory cycle (determined by Crs and Rrs, as explained previously)
- 2)
It indicates the Pmus or the ventilator pressure in a certain inspiratory time (Ti) with a particular V’ to cause an increase in lung volume exceeding the load (Crs and Rrs).
In simple terms, the positive pressure created by a ventilator opposes another force of different magnitude: on the one hand, related to the air flow resistance offered by the tracheobronchial tree [resistance component, including the instrumental pressure (trans-airway pressure)]. On the other hand, related to the increase in the volume of the functional residual capacity (FRC), which corresponds to the strength of elastic retraction of the pulmonary parenchyma and chest wall [elastic component (trans-thoracic pressure)].
It should be considered that in a partial or assisted ventilation mode, the respiratory work is shared by the respiratory muscles as well as the mechanical ventilator, and it increases with the presence of an intrinsic positive end expiratory pressure (PEEPi).
Therefore, the following variables and constants can be identified:
- •
Variables: Pressure, V’ and Vc, which change constantly (are manipulated by the ventilator).
- •
Constants: Crs and Rrs, which usually remain unchanged in the healthy patient.
Regardless of the use of any ventilation mode, the operator should consider that “if the ventilator controls the volume, the pressure should be monitored” or “if the ventilator controls the pressure, the volume should be monitored.”
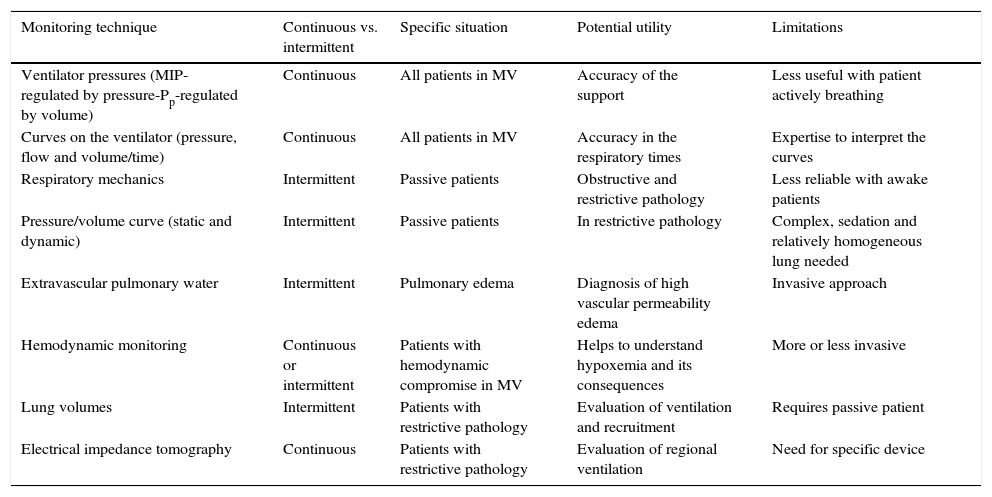
4Monitoring techniquesCurrently, it is feasible to have different monitoring techniques for the patient with acute respiratory failure, although there is still a lack of consensus on the correct prioritization of both signal and variable acquired, the moment (continuous versus intermittent) and the mode used (statics versus dynamics). These techniques are useful in specific situations and have potential advantages as well as limitations (Table 3).
Characteristics and limitations of available techniques for monitoring ventilation.
| Monitoring technique | Continuous vs. intermittent | Specific situation | Potential utility | Limitations |
|---|---|---|---|---|
| Ventilator pressures (MIP-regulated by pressure-Pp-regulated by volume) | Continuous | All patients in MV | Accuracy of the support | Less useful with patient actively breathing |
| Curves on the ventilator (pressure, flow and volume/time) | Continuous | All patients in MV | Accuracy in the respiratory times | Expertise to interpret the curves |
| Respiratory mechanics | Intermittent | Passive patients | Obstructive and restrictive pathology | Less reliable with awake patients |
| Pressure/volume curve (static and dynamic) | Intermittent | Passive patients | In restrictive pathology | Complex, sedation and relatively homogeneous lung needed |
| Extravascular pulmonary water | Intermittent | Pulmonary edema | Diagnosis of high vascular permeability edema | Invasive approach |
| Hemodynamic monitoring | Continuous or intermittent | Patients with hemodynamic compromise in MV | Helps to understand hypoxemia and its consequences | More or less invasive |
| Lung volumes | Intermittent | Patients with restrictive pathology | Evaluation of ventilation and recruitment | Requires passive patient |
| Electrical impedance tomography | Continuous | Patients with restrictive pathology | Evaluation of regional ventilation | Need for specific device |
MIP, maximal inspiratory pressure; Pp, plateau pressure; MV, mechanical ventilation.
Multimodal monitoring should always be preferred. Ideally, oxygenation, ventilation efficiency, chest wall function, patient-ventilator interaction, vascular permeability should be evaluated. Specifically, in patients with acute respiratory distress syndrome (ARDS), the potential for alveolar recruitment, alveolar overstretching and the cyclic opening and closing of alveoli should be evaluated as well.
5Monitoring of gas exchange5.1Pulse oximetry. Arterial oxygen saturationPulse oximetry (SpO2) is considered as an essential form of monitoring in all patients with respiratory problems or at risk. However, its use has not shown to affect the prognosis of the patient. It is a non-invasive method of continuous monitoring of percutaneous oxygen saturation (SatO2), which utility relies on the early detection of hypoxemia.10,11
As is well known, oxygenated hemoglobin (HbO2) and deoxygenated or reduced hemoglobin (Hb) absorb and transmit certain wavelengths of the light spectrum: around 660nm for a red light and around 940nm to the infrared light. These variations are measured by a pulsatile system based on Beer-Lambert's law, which correlates the intensity of incoming light with the outgoing intensity after the absorption in a certain medium, where two LEDs are lit alternatively (one for each wavelength). Thus, the light passes through the arterial tree, and the SpO2 is determined by the proportion of red and infrared light reaching the detector (R/Ir), which allows the estimation of the SatO2 in blood.12
For an optimal interpretation, an adequate perfusion is essential,13 as well as light and temperature conditions.14 Sensitivity is usually better with the digital device than with the handset14; “false” alarms are very frequent in children, usually because of their body movements.
This method is known for being low-cost, widely available and it presents few limitations on the reliability of its information. Regarding its intrinsic disadvantages are the insensitivity to changes in arterial oxygen pressure (PaO2) facing high levels of it, and not distinguishing between normal Hb and carboxyhemoglobin or methemoglobin.
In relation to oxyhemoglobin dissociation curve, it is almost linear when the SatO2 is between 80-97%. Therefore, the magnitude of the hypoxemia could be efficiently quantified by using the relationship between the saturation and the fraction of inspired oxygen (SatO2/FiO2 index).
The relationship between the SatO2/FiO2 and the PaO2/FiO2 (or Kirby index) has been validated in a heterogeneous sample of critically ill children, and a strong correlation between both was found.15 Therefore, SatO2/FiO2 can be used as a non-invasive diagnostic parameter in ARDS. It is worth mentioning that it has a good correlation in both adult and pediatric patients,16 and it can be useful to detect noninvasive mechanical ventilation (NIMV) failures.17,18
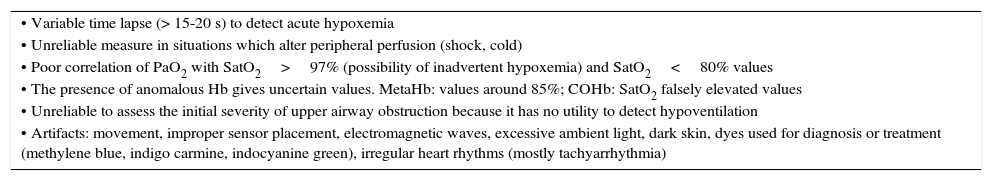
Finally, it is important to keep in mind that this technique does not replace arterial blood gases in patients with severe acute respiratory failure. Some limitations of pulse oximetry are summarized in Table 4.
Pulse oximetry limitations.
| • Variable time lapse (> 15-20 s) to detect acute hypoxemia |
| • Unreliable measure in situations which alter peripheral perfusion (shock, cold) |
| • Poor correlation of PaO2 with SatO2>97% (possibility of inadvertent hypoxemia) and SatO2<80% values |
| • The presence of anomalous Hb gives uncertain values. MetaHb: values around 85%; COHb: SatO2 falsely elevated values |
| • Unreliable to assess the initial severity of upper airway obstruction because it has no utility to detect hypoventilation |
| • Artifacts: movement, improper sensor placement, electromagnetic waves, excessive ambient light, dark skin, dyes used for diagnosis or treatment (methylene blue, indigo carmine, indocyanine green), irregular heart rhythms (mostly tachyarrhythmia) |
SatO2, percutaneous oxygen saturation; PaO2, arterial partial pressure of oxygen; MetHb, methemoglobin; COHb, carboxyhemoglobin; Hb, hemoglobin.
Near-infrared spectroscopy (NIRS) is a form of non-invasive optical diagnosis, which provides information about oxygen delivery and demand. Using non-pulsating oximetry, SatO2 is continuously monitored from the fraction of oxyhemoglobin and deoxyhemoglobin in a volume of tissue.19 The regional saturation of O2 (rSO2) is calculated from the records of the electrodes on the patient using the following equation:

Variations of rSO2 reflect changes in the demand or metabolic supply of the explored region, which depends on the cardiac output (CO) and the blood content of O2 (CaO2). Therefore, a decline of the rSO2 means a decrease in perfusion or an increase in the extraction of O2. On the other hand, high values of rSO2 can indicate an increase in the perfusion or a minor extraction of O2. In the clinic, both situations can reveal pathological states, although the trend would be more useful than the absolute number.20
The exact role in the care of the critical patient21,22 still needs to be defined; however, it can be effective and beneficial as a hemodynamic monitor.23
5.3Arterial blood gasDespite there are non-invasive methods for the assessment of gas exchange, the arterial blood gas measurement is fundamental the diagnosis and monitoring of the adequacy of the respiratory system in critically ill patients, especially those at risk of developing respiratory failure. The measurement of arterial gases allows the evaluation of the oxygenation, ventilation and metabolic state. The correct interpretation is crucial; however, it should be considered that the arterial punction is intermittent and it requires the operator skill.
5.4Partial pressure of oxygen in arterial bloodSeveral indexes have been used to measure hypoxemia, such as the alveolar-arterial difference of O2 (A-aDO2), Fick index (PaO2/PAO2), PaO2/FiO2, and blood content of O2.24 The most widely used is the PaO2/FiO2 index, currently incorporated in the definition of ARDS.25 The latter varies with the magnitude of the shunt, patient hemodynamics (mixed venous pressure of oxygen, PvO2), the value of Hb, the difference in the arterial-venous oxygen content, and FiO2.26,27 It should be evaluated in the context of the ventilatory support employed because it is influenced by MV and positive end expiratory pressure (PEEP).27–33
Another indicator is the oxygenation index (OI), which shows the “cost of oxygenating” or the intensity of the ventilatory support. The formula (OI=[Pma x FiO2 x 100]/PaO2) includes the mean airway pressure (Pma), which best correlates with the degree of alveolar distension and oxygenation (properly representing the mean alveolar pressure, except in conditions of increased airway resistance).34 In patients without vascular access, the oxygen saturation index (OSI=[FiO2 x Pma x 100]/SatO2) can be used as an alternative to evaluate hypoxemia.16
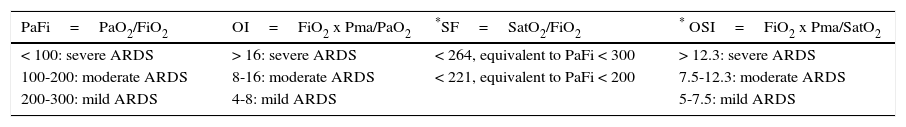
A recent consensus of acute lung injury in pediatrics recommends OI over the PaO2/FiO2 as a primary measure of severity to define pediatric ARDS. If this is not available, the use of the OSI to stratify the risk is recommended.18 The classification of the severity of ARDS according to the PaFi, OI, OSI, and SatO2/FiO2 can be observed in Table 5.
Classification of severity of the acute respiratory distress syndrome (ARDS) in pediatrics according to the degree of hypoxia.
| PaFi=PaO2/FiO2 | OI=FiO2 x Pma/PaO2 | *SF=SatO2/FiO2 | * OSI=FiO2 x Pma/SatO2 |
|---|---|---|---|
| < 100: severe ARDS | > 16: severe ARDS | < 264, equivalent to PaFi < 300 | > 12.3: severe ARDS |
| 100-200: moderate ARDS | 8-16: moderate ARDS | < 221, equivalent to PaFi < 200 | 7.5-12.3: moderate ARDS |
| 200-300: mild ARDS | 4-8: mild ARDS | 5-7.5: mild ARDS |
These indexes should not apply to children with cyanotic congenital heart disease.
PaFi, blood pressure of oxygen/inspired oxygen fraction ratio; OI, oxygenation index; PaO2, partial pressure of blood oxygen; FiO2, fraction of inspired oxygen; Pma, mean pressure of airway; SF, oxygen saturation/inspired fraction of oxygen ratio; OSI, oxygenation based on saturation index.
The alveolar pressure of CO2 (PACO2) is the parameter that best defines the pulmonary ventilation status, and depends directly on CO2 production and inversely on alveolar ventilation. Since CO2 spreads quickly through the alveolar membrane (20 times faster than oxygen), PACO2 is in equilibrium with the blood pressure of CO2 (PaCO2). Therefore, PaCO2 is considered as the simplest method to evaluate ventilation.35
5.6Transcutaneous monitoring of CO2Transcutaneous monitoring of CO2 (transcutaneous carbon dioxide, tcPCO2) emerged from the need to continually assess alveolar ventilation without requiring the repeated evaluation of blood gas (standard procedure). Since the correlation of partial pressure of CO2 end-expiratory (end-tidal CO2 concentration, EtCO2) with the PaCO2 can be affected by several factors, such as alterations in the ventilation-perfusion relationship (V/Q), use of small Vc, etcetera, it is also an alternative method.
In relation to technical aspects, tcPCO2 sensors heat the skin at a temperature of 42-43°C, which generates a vasodilation of the capillary bed, and leads to an approximation of the arterial and capillary pressure of CO2. In addition, this vasodilatation facilitates the dissemination of CO2 from the capillary to the membrane of the monitor, resulting in the reading of the tcPCO2. Externally applied heat alters the solubility of CO2 in blood, and increases the metabolic rate of the tissue in about 4-5% per Celsius degree; therefore, the local production of CO2 increases, which is corrected using a factor.
Although it has been most frequently used in the newborn patient, technological development has led to its application outside the neonatal population, specifically in the continuous evaluation of ventilation for respiratory failure in patients requiring intubation, as well as during high-frequency oscillatory ventilation, where surveillance of the EtCO2 is not feasible.36
5.7CapnographyCapnography is the standard method that allows monitoring the blood elimination of CO2 during the respiratory cycle, continuously and in real-time. Its graphical representation corresponds to the capnogram, which provides qualitative information about the ventilation and perfusion scan.
Usually, four phases are described (Fig. 4A). Phase III (often referred to as plateau) shows EtCO2, which represents the removal of CO2 from the alveolar gas and provides an indirect measure of PaCO2.
. Phase II: rapid rise of CO2 at the beginning of exhalation by the elimination of CO2 of the dead space mixed with alveolar CO2. Phase III: alveolar plateau. The exhalation of the CO2 from the alveoli takes place. It reaches a peak where the partial pressure of CO2 is the highest. Phase IV: partial pressure of CO2 decreases rapidly at the beginning of the inspiration. PCO2 corresponds to the partial pressure of CO2 and EtCO2 (end tidal CO2 concentration) to the partial pressure of CO2 at the end of the exhalation. B. Morphologic changes in the capnogram and the percentage of CO2 in time according to the magnitude of the airway blockage.")
Capnogram graphics. A. Normal capnogram. Phase I: end of inhalation and beginning of exhalation (dead space ventilation). Phase II: rapid rise of CO2 at the beginning of exhalation by the elimination of CO2 of the dead space mixed with alveolar CO2. Phase III: alveolar plateau. The exhalation of the CO2 from the alveoli takes place. It reaches a peak where the partial pressure of CO2 is the highest. Phase IV: partial pressure of CO2 decreases rapidly at the beginning of the inspiration. PCO2 corresponds to the partial pressure of CO2 and EtCO2 (end tidal CO2 concentration) to the partial pressure of CO2 at the end of the exhalation. B. Morphologic changes in the capnogram and the percentage of CO2 in time according to the magnitude of the airway blockage.
The normal difference between the PaCO2 and the EtCO2 (arterial-alveolar gradient of CO2, a-ACO2) is 2-3mmHg (PaCO2 40mmHg and PACO2 37-38mmHg). When ventilation and pulmonary perfusion are adequate, the a-ACO2 is small; therefore, EtCO2 can be used to monitor the patient since it reflects the PaCO2.
It should be remembered that the pulmonary heterogeneity creates regional differences in the concentration of CO2 and that gases from areas with a high V/Q are the first to appear in the upper airway during exhalation. This sequential emptying contributes to the increase of the slope of the alveolar plateau. The greater the heterogeneity V/Q, the steeper the slope of the alveolar plateau (“shark fin” form), which correlates with severity of airway obstruction37 (Fig. 4B). The gradient between PaCO2 and EtCO2 is greater in patients with ARDS and is correlated with different levels of physiological dead space.38 In addition to the ventilator monitoring, capnography can be used to ensure the correct endotracheal intubation.
5.8Volumetric capnography: dead space calculationIn contrast to the standard capnography, volumetric capnography (VC) allows the measurement of the exhaled volume of CO2 in Vc (by which the respiratory dead space can be calculated), adjust an optimal PEEP (thus obtaining a better oxygenation) and the ventilation and pulmonary perfusion rate, which vary dynamically in each respiratory and cardiac cycle. In general, it should be considered that a child with ARDS presents an increase of dead space,39 whose alveolar fraction (Vdalv) correlates with mortality40,41; hence, a prognostic value has been given to dead space. About the benefits and clinical applications, these are the same as for the standard capnography.
VC is considered the gold standard for the evaluation of the effectiveness of alveolar ventilation to the bedside of the patient since it is the simplest and effective way of monitoring patients with severe lung injury.
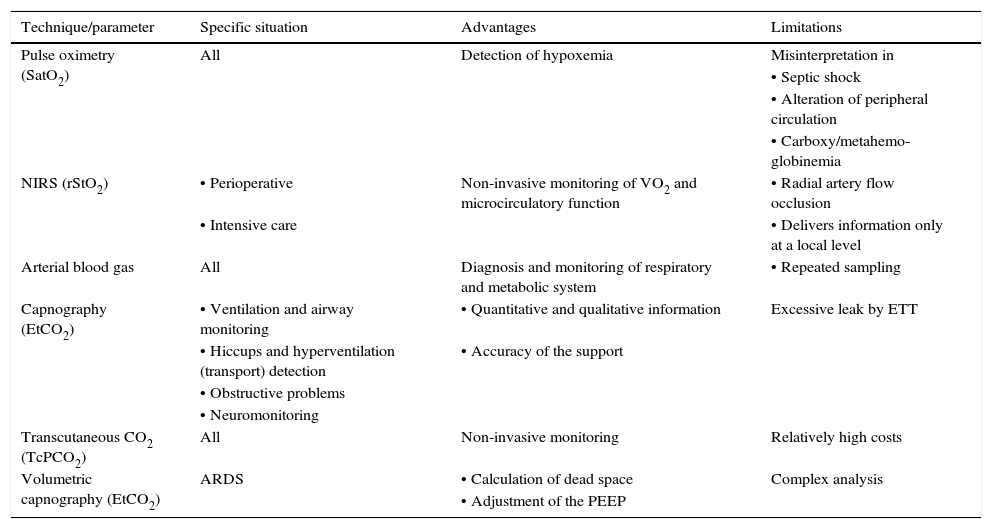
Table 6 summarizes the monitoring techniques of gas exchange mentioned before.
Techniques and parameters for the monitoring of gas exchange.
| Technique/parameter | Specific situation | Advantages | Limitations |
|---|---|---|---|
| Pulse oximetry (SatO2) | All | Detection of hypoxemia | Misinterpretation in |
| • Septic shock | |||
| • Alteration of peripheral circulation | |||
| • Carboxy/metahemo-globinemia | |||
| NIRS (rStO2) | • Perioperative | Non-invasive monitoring of VO2 and microcirculatory function | • Radial artery flow occlusion |
| • Intensive care | • Delivers information only at a local level | ||
| Arterial blood gas | All | Diagnosis and monitoring of respiratory and metabolic system | • Repeated sampling |
| Capnography (EtCO2) | • Ventilation and airway monitoring | • Quantitative and qualitative information | Excessive leak by ETT |
| • Hiccups and hyperventilation (transport) detection | • Accuracy of the support | ||
| • Obstructive problems | |||
| • Neuromonitoring | |||
| Transcutaneous CO2 (TcPCO2) | All | Non-invasive monitoring | Relatively high costs |
| Volumetric capnography (EtCO2) | ARDS | • Calculation of dead space | Complex analysis |
| • Adjustment of the PEEP |
The situations where they are used, as well as their advantages and limitations, are indicated.
SatO2, oxygen saturation; VO2, oxygen consumption; NIRS, near-infrared spectroscopy; EtCO2, end tidal CO2 concentration (CO2 partial pressure at the end of the exhalation; TBI, traumatic brain injury; ETT, endotracheal tube; TcPCO2: transcutaneous partial pressure CO2; ARDS, acute respiratory distress syndrome; PEEP, positive end-expiratory pressure.
Not only permanent clinical examination and gas exchange monitoring are essential for the control of the patient with invasive ventilation support, but also the monitoring of the respiratory mechanics must be an integral component of daily care. This measurement can be carried out in the patient under static conditions (occlusion techniques) or dynamic conditions (uninterrupted flow).
Technological advances in the field of MV allow a wide variety of parameters and graphics in real time, which generate a more precise monitoring of the patient and help to minimize complications, optimize patient-ventilator synchrony. Finally, through its correct interpretation, it helps to achieve more accurate diagnoses, thus, more appropriate therapeutic approaches.
7Monitoring of airway pressures7.1Peak inspiratory pressureThe peak inspiratory pressure (PIP) is the maximum pressure recorded at the end of inspiration. It results from the frictional resistance of the airway, and its determining factors are flow, resistance [including the endotracheal tube (ETT)] and Crs.
PIP value must not exceed 30-35 cmH2O. Therefore, at high pressures, an obstructive problem related to the patient (bronchospasm, secretions) with the tubing (plug, torque) or with the use of an excessive inspiratory flow must be discarded, which significantly affects the value of the maximal inspiratory pressure (MIP).42
7.2Plateau pressureFor the evaluation of the plateau pressure (Pp), a pause at the end of inspiration (flow 0, balance of pressure in the airway flow) is required, usually from 0.2 to 2 s. This pause causes that the delivered air volume remains and distributes evenly in relation to the lung viscoelastic forces, which originates a decrease in the pressure of the airway, which in turn creates a plateau (Pp) before falling to the basal pressure. For this reason, the patient should be well adapted to the ventilator and without a significant ventilatory effort (Fig. 5).

It must be considered that the Pp is influenced by Vc, Crs, and total PEEP, and it represents the pressure of elastic retraction of the respiratory system (lung and chest wall) at the end of the inspiratory cycle. It allows the calculation of the static Crs, and it should repeatedly be evaluated during the first hours of connection to MV. Its value is located below the MIP and should be under 30 cmH2O43; higher values suggest a deterioration in the Crs that require evaluation.
As mentioned before, Crs is easily calculated as the ratio Vc/(Pm-PEEP). A decrease of this value (high elastance), as observed in ARDS, represents an insufficient lung tissue available for ventilation, reflecting the dependence Vc-Crs.44 When a low Crs is observed, an increase of the Pm or PEEP will be noted [limitation of flow or dynamic hyperinflation (DHI)].
7.3Distending pressureDistending pressure or gradient of pressure (ΔP) is the difference between the alveolar pressure at the end of inspiration (Pp) and the PEEP (ΔP=Pp-PEEP). This definition is independent of the ventilation mode.
During volume-controlled ventilation, the ΔP value will depend on Vc and elastance of the chest wall values. ΔP is quite close to the transpulmonary pressure (Ptp); however, in the absence of ventilation activity, the transpulmonary pressure is always inferior to the ΔP. Thus, the ΔP has a direct relationship with the Vc and Ptp. Therefore, its importance lies in that it is a measure of control (or limit) of pressures applied to the airway to prevent the harm associated with ventilation. As long as the ventilation therapy is not successfully defined in a more individualized form, it is very important that the distending pressure is, as possible, less than 15 cmH2O.
7.4Pressure-time and flow-time curvesThe monitoring of the pressure-time (Fig. 5) and flow-time (Fig. 6) curves is recommended to detect the limitation of the expiratory flow or patient-ventilator asynchrony and to handle the precision of the respiratory times.18
7.5Pressure-volume loop should be suspected.")
The static pressure-volume loop (P/V) provides full information on the mechanical properties of the respiratory system. It is obtained using the graphic representation of lung volume for a particular pressure in the absence of airway flow; i.e., without the resistive component. Therefore, the pressure measurement is the actual elastic pressure of the pulmonary parenchyma, which allows guiding the ventilation therapy (estimation of Crs and PEEP adjustment). Fig. 7 shows the P/V loop components: hysteresis, upper (UPI) and lower (LPI) points of inflection44–46 and47 compliance. It should be noted that alveolar recruitment occurs on a stretch of this loop48,49 and that both recruitment and derecruitment occur simultaneously. Moreover, optimal PEEP should be evaluated in the expiratory branch.
. Representation of the static loop P/V in patients with ARDS. The hysteresis of the respiratory system that generates different inspiration and expiration curves is observed, which means that “the airway pressure required to open the alveoli is greater than that necessary to keep them open once they have been recruited.” The upper (UIP) and lower (LIP) inflection points can also be observed, which allow the estimation of the positive pressure at the end of the exhalation (PEEP) and the optimal tidal volume (Vc).")
Static loop pressure-volume (P/V). Representation of the static loop P/V in patients with ARDS. The hysteresis of the respiratory system that generates different inspiration and expiration curves is observed, which means that “the airway pressure required to open the alveoli is greater than that necessary to keep them open once they have been recruited.” The upper (UIP) and lower (LIP) inflection points can also be observed, which allow the estimation of the positive pressure at the end of the exhalation (PEEP) and the optimal tidal volume (Vc).
Finally, in the patient with ARDS, there is little conclusive evidence concerning the prognosis with the use of the P/V loop50–52 since it is not easy to measure in the clinic and its classical interpretation has been challenged by several mathematical models.
7.6Patient-ventilator asynchronyAsynchrony or dyssynchrony can be observed in a patient with high ventilation demand (severe ARDS) or the patient without large pulmonary pathology but with an acute complication, as the ETT obstruction. Asynchrony is classified according to the phase in which it takes place: at the beginning (triggering), in the inspiratory phase (generation of flow), at the point of cycling or the end of the exhalation.
- 1.
In the early or triggering asynchrony, the following can be found:
- •
Ineffective triggering. It is related to an increase in the time of the MV and with a lower probability of success in the weaning. In this case, the patient will try to trigger but will not be able to reach the programmed threshold, creating in this way an increase in the respiratory muscle workload. A common cause of asynchrony is an ineffective beginning resulting from the presence of PEEPi. The analysis of the flow curve will show a high initial flow followed by an interruption that does not reach the abscissas axis, revealing the presence of trapped air volume (Fig. 6) as well.
- •
Double triggering. This way, double Vc is received. The origin may be caused by a high ventilatory demand from the patient, or an inappropriate Ti.
- •
Auto-triggering. The ventilator starts a breath not triggered by the patient. The origin of this can be water in the circuit, mists or a low triggering, among other causes.
- •
- 2.
Flow asynchrony occurs when the ventilator delivers an insufficient flow for the patient. In the case of a very low flow for the patient, a fall during the inspiration can be detected in the pressure curve. In situations in which the flow is very high, a peak at the beginning can be detected in the pressure curve.53,54
- 3.
Two reasons for the cycling asynchrony can be identified: the first is a premature cycle, which occurs when the set Ti is too short for the patient. Therefore, the inspiratory effort can still be present when the Ti has ceased. In these cases, the patient can generate a negative pressure and activate the trigger, generating a double start.
The second cause is a delayed cycle: the scheduled Ti is too long for the patient. Therefore, the inspiration ends before the ventilator cycles, or the activation of the expiratory muscles occurs when the ventilator is still delivering the inspiratory volume.
- 4.
At the end of the expiratory phase, asynchrony can occur in conditions in which a delay in the expiratory muscle relaxation before the next inspiration happens, or an overlap between inspiratory and expiratory muscle activity. These conditions are verified with neuronal measures; hence, they cannot be evaluated from the ventilation graphic.
From the phases described, it is clear that recognition of patient-ventilator asynchrony is transcendent, and includes the observation of the patient (anxiety, diaphoresis) as well as the ventilator curves since it can cause DHI and delay of ventilator weaning, among other complications.55
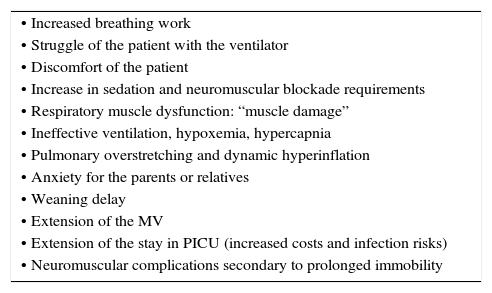
A pressure-time curve is presented in Fig. 8, with the types of patient-ventilator asynchrony. The main complications derived from this asynchrony are shown in Table 7.

Main complications of patient-ventilator asynchrony.
| • Increased breathing work |
| • Struggle of the patient with the ventilator |
| • Discomfort of the patient |
| • Increase in sedation and neuromuscular blockade requirements |
| • Respiratory muscle dysfunction: “muscle damage” |
| • Ineffective ventilation, hypoxemia, hypercapnia |
| • Pulmonary overstretching and dynamic hyperinflation |
| • Anxiety for the parents or relatives |
| • Weaning delay |
| • Extension of the MV |
| • Extension of the stay in PICU (increased costs and infection risks) |
| • Neuromuscular complications secondary to prolonged immobility |
MV, mechanical ventilation; PICU, pediatric intensive care unit.
Intra-abdominal pressure (IAP) corresponds to the pressure within the abdominal cavity, and it is determined by three factors: the body mass index, the position of the patient and the resistance exerted by the abdominal wall (which changes according to the respiratory movements).
It should be considered that the IAP is sub-atmospheric during spontaneous breathing. In contrast, a slightly positive pressure exists when the patient is ventilated.
Studies have indicated that a sensitivity of only 40% exists by estimating intra-abdominal hypertension through palpation. Van Mieghem et al.56 found a poor correlation between IAP and the abdominal perimeter. Therefore, the clinical signs for its diagnosis may be absent with a slight increase of this pressure.57
It is important to consider that against an increase of the IAP, some phenomena, such as displacement of the diaphragm (transmitting such pressure to the lower lung lobes, modifying the thoraco-pulmonary mechanics and causing a decrease in Crs), will be generated passively. Moreover, a reduction in the impact of the Ptp as alveolar opening force, and the prevention of closure by transmission of the abdominal pressure to the pleural cavity. Finally, a reduction of the FRC, alterations of the V/Q and an increase in the fraction of the pulmonary shunt will be observed.58 Furthermore, pulmonary neutrophil activation must be considered, generating inflammatory infiltrate and alveolar edema associated with atelectasis by compression, resulting in a prolonged MV and a difficult ventilator weaning. In general, these alterations occur with IAP ≥ 15mmHg.59
In every patient in whom intra-abdominal hypertension is suspected, the monitoring of the IAP is recommended, especially in those who have received an aggressive resuscitation with fluids.60
7.8Transpulmonary and esophageal pressureTranspulmonary pressure (Ptp) is defined as the difference between Palv and pleural pressure (Ppl), (Ptp=Palv-Ppl). Ptp is the force which distends the lung (equivalent to stress). Therefore, it is the main determinant of the deformation magnitude of the pulmonary parenchyma (stretch). Theoretically, using its measurement, a more rational ventilation support can be administered and, therefore, lung damage induced by the MV is limited.61
An estimate of the Ptp may be possible in the clinic, replacing the Palv and Ppl by measuring the Pa and the esophageal pressure (Pes).
In a vertical position, the Pes is comparable with the Ppl, although there are reservations about if it can be approximated in a patient in a supine or prone position. In addition, the intrinsic esophageal elastance is not considered when it is measured.
Experimental studies on ARDS canine models have shown a good correlation between the changes of the Ppl (values) and Pes for different regions of the lung.58 The authors suggest monitoring Ptp with the use of the Pes only in certain clinical situations (obese patients or patients with abdominal hypertension, severe ARDS and Pm>30 cmH2O). Currently, scarce publications have reported its usual usage in the ventilated patient.62,63
8Lung volumes8.1Current volumeThe limitation of the Vc and the minute volume (Vc x respiratory frequency) have been the subject of discussion and research in the last decade due to their relationship with the generation of damage induced by MV. The recommendation for adult patients, based on multiple studies, is to limit the Vc from 6 to 8ml/kg of the ideal body weight, regardless of the pathology. In pediatrics, no evidence exists about this limitation. However, it is suggested to imitate this behavior with the objective of reducing the recruitment-derecruitment associated with the use of high volumes, and the consequent release of pro-inflammatory mediators.
8.2End-expiratory lung volumeEnd-expiratory lung volume (EELV) corresponds to the FRC in the presence of PEEP. In the classical physiology, it is assessed with the gold standard technique, which is the helium dilution. However, it is complex and not widely available. Chest computed tomography (CT) is probably the standard to measure EELV in the MV patient. Another alternative method is the “modified” nitrogen wash-out/wash-in.64
The evaluation of the alveolar recruitment65 and the use of a protective ventilation66,67 are its potential clinical applications.
It is important to remember that PEEP promotes the recruitment of nonaerated lung tissue, and therefore increases the EELV; however, this effect must be distinguished from the distention of ventilated alveolar units. Therefore, in a low recruitment potential lung, the increase of the PEEP will produce over-stretching of the alveolar tissue. In contrast, in a patient with a high recruitment potential when the EELV increases, the Vc will be distributed more evenly in the alveolar tissue with a consequent limitation of stretching (protective ventilation). Thus, a method to evaluate the amount of recruited lung could improve the ventilation management of the patient, adapting the PEEP to his individual needs.
Mainly due to technical reasons, the measurement of EELV is not monitored routinely in the clinical practice.
8.3Extravascular lung waterPulmonary edema can be quantified by measuring the extravascular lung water (EVLW). The extravascular liquid can be present in the interstice and the alveolar compartment.
It must be considered that the fluid overload is a risk factor for mortality in the critically ill child.68 Therefore, the use of a tool that allows the detection and quantification of pulmonary edema can be beneficial.
The EVLW may be monitored and measured at the bedside of the patient using the transpulmonary thermodilution technique, which is incorporated in the cardiac output system by the press index contour cardiac output (PiCCO) analysis. This system can measure small increases (10-20%) of the EVLW, demonstrating a high accuracy, which allows detecting incipient pulmonary edema. The value obtained in the PiCCO system is indexed concerning body weight [extravascular lung water index, EVLWI (ml/kg)]. In combination with other cardiovascular and pulmonary parameters, it allows differentiating between a hydrostatic or a permeability edema.
A correlation between the EVLWI and radiological findings of pulmonary edema, PaO2/FiO2 or DA-aO2 has not been demonstrated yet.
In conclusion, monitoring the EVLW has great clinical usefulness in pediatric patients who benefit from depletive therapies, such as the case of ARDS.69,70
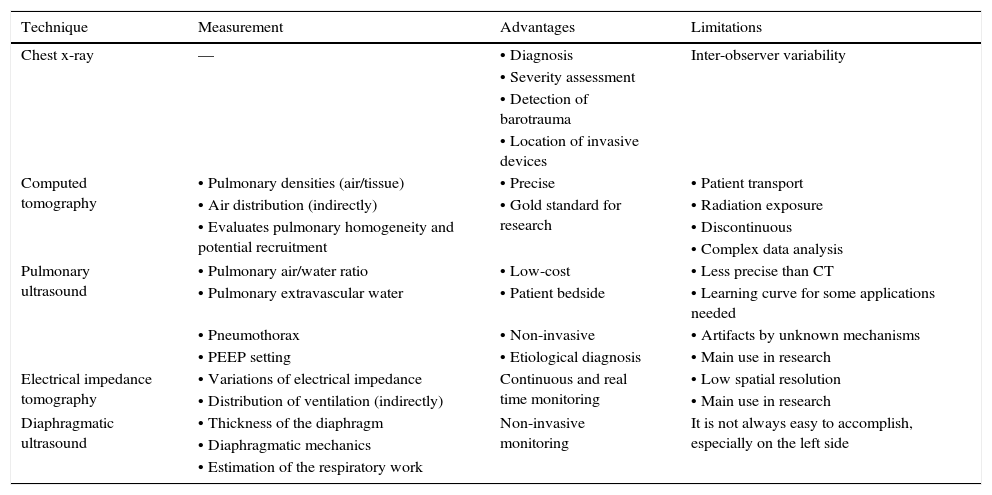
9ImagingCurrently, several imaging studies facilitate the daily work in intensive care units. The most relevant are described in Table 8.
Most relevant fundamentals, advantages, and limitations of imaging studies to consider in patients with mechanical ventilation.
| Technique | Measurement | Advantages | Limitations |
|---|---|---|---|
| Chest x-ray | — | • Diagnosis | Inter-observer variability |
| • Severity assessment | |||
| • Detection of barotrauma | |||
| • Location of invasive devices | |||
| Computed tomography | • Pulmonary densities (air/tissue) | • Precise | • Patient transport |
| • Air distribution (indirectly) | • Gold standard for research | • Radiation exposure | |
| • Evaluates pulmonary homogeneity and potential recruitment | • Discontinuous | ||
| • Complex data analysis | |||
| Pulmonary ultrasound | • Pulmonary air/water ratio | • Low-cost | • Less precise than CT |
| • Pulmonary extravascular water | • Patient bedside | • Learning curve for some applications needed | |
| • Pneumothorax | • Non-invasive | • Artifacts by unknown mechanisms | |
| • PEEP setting | • Etiological diagnosis | • Main use in research | |
| Electrical impedance tomography | • Variations of electrical impedance | Continuous and real time monitoring | • Low spatial resolution |
| • Distribution of ventilation (indirectly) | • Main use in research | ||
| Diaphragmatic ultrasound | • Thickness of the diaphragm | Non-invasive monitoring | It is not always easy to accomplish, especially on the left side |
| • Diaphragmatic mechanics | |||
| • Estimation of the respiratory work |
CT, computed tomography; PEEP: positive end expiratory pressure.
The use of this technique is recommended to support the diagnosis, assess clinical progression and detect adverse situations such as displacement of the ETT and verification of the position of central lines, feeding tubes, among others.18
9.2Lung ultrasoundUltrasound is a non-invasive, non-ionizing, useful tool for the evaluation in real time of pulmonary pathology at the patient bedside.71–73
Recently, its use in children for the study of lung, pleura and diaphragm diseases has increased. The advantage in this group of patients originated from the lack of ossification of both costal cartilage and sternum, and the lower layer of subcutaneous adipose tissue, thus providing an ideal acoustic window.72–74
This technique stands out against X-ray mostly because of the absence of ionizing radiation, the accessibility of the equipment and the assessment in real-time. Regarding the clinics, its superiority over X-ray has been described for the diagnosis75 and quantification76 of pneumothorax.
In pediatric and adult patients with ARDS, it has been used to evaluate pulmonary recruitment.77,78 However, an important limitation is that it cannot recognize pulmonary hyperinflation; therefore, it should not be employed as an exclusive method for the determination of PEEP.77
9.3Computed tomographyComputed tomography (CT) clinical usefulness relies on the guidance of a protective strategy for the MV in patients with severe respiratory failure, allowing the assessment of the magnitude of the available area for gas exchange79 and the alveolar recruitment potential.
According to experts, CT still should be considered as the gold standard for research but not for routinely performed on a daily basis in the clinic, given its practical limitations,80 such as the high cost, lack of availability, more radiation and of the difficulty for the transportation of the patient outside the unit.81
9.4Electrical impedance tomographyElectrical impedance tomography (EIT) is a tool that allows noninvasive monitoring in real time through the use of images that represent changes in regional lung impedance (ΔZ), which are directly correlated with regional changes in volume (ΔZ≈Vc).82 Data are obtained from a belt with electrodes installed at thoracic level, producing an image representing the areas with impedance changes. Thus, using topographic criteria, the clinician can differentiate between nonaerated and hyperinflated areas, which allows to assess both the effectiveness of an alveolar recruitment maneuver83,84 and the protective ventilation (evidenced in ARDS animal models) as well as to monitor the redistribution of the Vc,85 thus achieving a dynamic adjustment of the ventilation therapy.
Currently, several problems arising from the anatomical variability of the rib cage, its low spatial resolution, the evaluation of only a region of the chest and how to transform impedance into a volume signal persist. However, its use in the clinic as both a qualitative (view regional ventilation) and quantitative (estimated therapeutic impact) tool in the mechanically ventilated pediatric patient is expected to take place shortly.
10BiomarkersAlthough the use of bronchoscopy with bronchoalveolar lavage (BAL) for study and bacteriological rescue in patients with ARDS purposes is well known,86 the cytological evaluation and analysis of biomarkers of inflammation, coagulation, and fibrinolysis is usually reserved for clinical research.87–89 It is not always possible to carry out a BAL since training is required and it may be associated with the development of hypoxemia or hemodynamic instability.
Several proteins have been suggested as markers in patients with ARDS,87,90,91 using systemic levels of lung proteins as markers of alveolar inflammation, and describing its correlation with prognosis92 and MV-induced damage.93 Moreover, some mediators of endothelial activation, such as angiopoietin-2 (Ang-2) and von Willembrand factor (vWF) have been described as susceptibility and severity markers.94 Finally, it is worth to mention that the levels of fibrocytes in the BAL have been correlated with the prognosis of the patient.95
Currently, the use of biomarkers that deliver reliable information to stratify risk, help the diagnosis, provide prognostic information and guide clinical management is in full stage of research.96
Based on the above mentioned, the following conclusions can be specified:
- •
Every patient admitted to an intensive care unit requires respiratory monitoring. The type of monitoring will depend on the pathology and pathophysiology of the patient.
- •
The physician should be aware of the potential and limitations of each technique and monitoring operation to choose the most appropriate for each patient.
- •
In the case of needing ventilation support, a timely and appropriate monitoring should be considered as the way to achieve individualized prescription and must be multimodal given the overlap of physiologic phenomena.
- •
The PaO2/FiO2 ratio for the diagnose of pediatric ARDS in patients connected to non-invasive MV is recommended. If it is not available, the SatO2/FiO2 ratio is suggested. In the case of patients with invasive MV, the OI over the PaO2/FiO2 as the primary metric of severity to define pediatric ARDS is recommended. If this not is available, the use of ISO to stratify the risk is recommended.
- •
The continuous monitoring of exhaled Vc and inspiratory pressure (MIP in pressure modality and Pp in control volume) during invasive MV in children with ARDS is recommended to prevent harmful ventilation. The latter should be interpreted cautiously in patients with suspected atypical thoracic compliance or spontaneous ventilation.
- •
The continuous monitoring of the exhaled Vc and inspiratory pressure is suggested, as well as the delivery of oxygen, Crs, and hemodynamics as levels of PEEP increase. Also, ΔP must be considered since it has a direct relationship with the damage induced by MV.
- •
Finally, no form of monitoring that improves by itself the prognosis of the patient exists; therefore, it will depend on a proper treatment, based on the correct use of the received information.
The authors declare no conflicts of interest of any nature.
Please cite this article as: Donoso A, Arriagada D, Contreras D, Ulloa D, Neumann M. Monitorización respiratoria del paciente pediátrico en la Unidad de Cuidados Intensivos. Bol Med Hosp Infant Mex. 2016;73:149–165.