

The components of physical fitness are important as indicators of health in schoolchildren. The main objective of this study was to analyze the differences in the components of fitness among overweight/obese school-age children and children with ideal weight.
MethodsComponents of physical condition, anthropometric variables and blood pressure were measured in 491 schoolchildren from the city of Chihuahua, Mexico. Descriptive statistics with analysis of variance and frequency measurements were performed. Only the students who performed all the tests were included.
ResultsFrom the sample, 45% (n=205) were females and 55% (n=251), with a mean age of 8.8±1.8 and 8.9±1.9 years, respectively. Overweight or obesity was present in 39% of the schoolchildren. Waist circumference showed 15.6% of schoolchildren in the ≥ 90th percentile, and regarding blood pressure about 13.1% of the children were classified with some form of hypertension. Schoolchildren with normal weight showed greater flexibility (p=0.007), more arm flexions repetitions (p=0.000), and abdominal pushups (p=0.000), and less time in the speed test (p=0.008) when compared to schoolchildren with obesity.
ConclusionsIn the present study, we observed that schoolchildren with overweight and obesity have a significantly lower performance in physical tests. Therefore, the different aspects of physical condition evaluated can serve as immediate indicators of potential health risks for overweight children.
Los componentes de la condición física son de importancia como indicadores de salud en los escolares. El objetivo principal de este estudio fue analizar las diferencias en los componentes de condición física entre escolares que se encuentran en su peso ideal y los que presentan sobrepeso/obesidad.
MétodosParticiparon 491 escolares de primaria, de la ciudad de Chihuahua, México. Se midieron componentes de la condición física, variables antropométricas y presión arterial. Se realizó estadística descriptiva, análisis de varianza y medidas de frecuencia, incluyendo sólo a los escolares que realizaron todas las pruebas.
ResultadosEl 45% (n=205) de la muestra fueron niñas y el 55% (n=251) niños. La edad en años de las niñas fue de 8.8±1.8, y de los niños 8.9±1.9. El 39% de los escolares presentaron sobrepeso u obesidad. La circunferencia de cintura mostró 15.6% de escolares con un percentil ≥90, y en la presión arterial aproximadamente 13.1% de los niños es clasificado con algún tipo de hipertensión. Los escolares con peso normal mostraron significativamente mayor flexibilidad (p=0.007), más repeticiones en la flexión de brazos (p=0.000) y abdominales (p=0.000), así como menor tiempo en la prueba de velocidad (p=0.008) al compararlos con los escolares que presentan obesidad.
ConclusionesLos escolares con sobrepeso y obesidad de la presente investigación tienen un menor desempeño significativo en las pruebas físicas comparado con los que se encuentran en su peso ideal, por lo que los diferentes aspectos de la condición física evaluados pueden servir como indicadores inmediatos de los posibles riesgos de salud para los niños con exceso de peso.
Anthropometric measurements in children and adolescents are used as health indicators. By calculating the weight in kilograms over the height in squared meters, the body mass index (BMI) can be determined. This index can be used to classify people with mild, moderate or severe malnutrition, as well as overweight or obesity1. On the other hand, waist circumference allows a percentile classification that can be used to estimate metabolic risk in children and adolescents2.
There is conclusive evidence linking childhood overweight and obesity with a deficient physical condition, as well as accumulation of abdominal adipose tissue3,4; therefore, it is important to study and analyze anthropometric variables and the components of fitness4.
The relationship between a good physical condition and good health is conclusive; cardiorespiratory capacity, strength, speed, flexibility, among other characteristics, contribute significantly to the good performance of a subject's cardiovascular, musculoskeletal, neuromuscular and metabolic systems3–5. For this reason, it is necessary to analyze the components of the physical condition as health indicators. However, standardized tests, with validity and reliability, must be used to perform this analysis5,6.
Arterial hypertension is a cardiovascular risk factor that is mainly present in adults, and is uncommon in children. However, in the last decades, an increase in the prevalence in this disease has been observed, mainly in children with obesity7,8. Prevalence rates of hypertension in children and adolescents have increased recently9. In Latin America, an increase of approximately 10.2% has been reported, considering this disease as a public health issue8,9; therefore, we included measurements and analysis of arterial blood pressure for the present study.
Childhood overweight and obesity are considered public health issues that have increased10–12. In Mexico, according to the National Health and Nutrition surveys, school-age children show an increase in the prevalence of overweight and obesity, with a national mean value of 26.9% in 1999 to 34.4% in 2012, which is already an issue that must be addressed through relevant interventions11,12. If this trend continues, these school-age children will present serious health problems in adulthood, which will negatively affect their productivity and cause an unsustainable healthcare expenditure for the government, leading to a sick and disabled country13.
Educational, political, and public health strategies to address the issue of childhood obesity in the United States have focused on improving the physical condition of the school children through physical education, school-based sports, the promotion of active lifestyles and implementation of national standards for physical condition14,15. The present study shows the results of a study conducted in schoolchildren from two public primary schools. The main objective was to analyze differences in the components of physical condition by comparing school-age children with overweight/obesity against children with ideal weight.
2MethodsWe performed a cross-sectional study, taking convenience samples of two public primary schools from the city of Chihuahua, Mexico, where the school's principal and parents agreed to participate. We invited all school-age children from first to sixth grade, resulting in a sample of 491 students, of whom only 251 males and 205 females were analyzed (n=456). The rest did not comply with measurements. Parents or guardians of the students were informed of the purposes of the study and signed the letter of consent. Any school child with a medical condition that restrained him/her from participating in the study, or those from which the informed consent was not obtained, were excluded.
The anthropometric indicators measured in this study were weight or body mass, height and waist circumference. BMI and waist circumference percentile of the sample according to age and gender were determined. For BMI classification, the leaderboards of the World Health Organization (WHO) were considered, which can be found in the “FOOD AND NUTRITION TECHNICAL ASSISTANCE” (FANTA III) 20121. To determine the percentile of the waist circumference, the tables from the Consensus for the Definition of Metabolic Syndrome in Children and Adolescents of the International Federation of Diabetes 2007 (IDF)2 were used.
As part of a health indicator, the study included measurement and classification of arterial blood pressure (AP) based on the fourth Report on the Diagnosis, Evaluation and Treatment of High Blood Pressure in Children and Adolescents8, developed by the Department of Health and Human Services of the United States and revised in 2005. A pediatric aneroid sphygmomanometer was used to measure AP.
In order to measure and classify the physical condition, a part of the battery of physical tests called The Presidential Physical Fitness Award, which were developed by the President's Council on Fitness, Sports and Nutrition and the Department of Health and Human Services of the USA14 were used. The physical tests included for this study were abdominal exercises (crunches), arm flexions, flexibility, speed and agility (shuttle and run). To classify the results in the physical tests, the 85th percentile was considered as an excellent performance, a score ≥ 50th percentile and ≤ 85th, as good performance, and a score < 50th percentile was considered as poor performance14.
For data analysis, the statistical program SPSS version 18.0 was used to perform descriptive statistics, analysis of variance and frequency measurements.
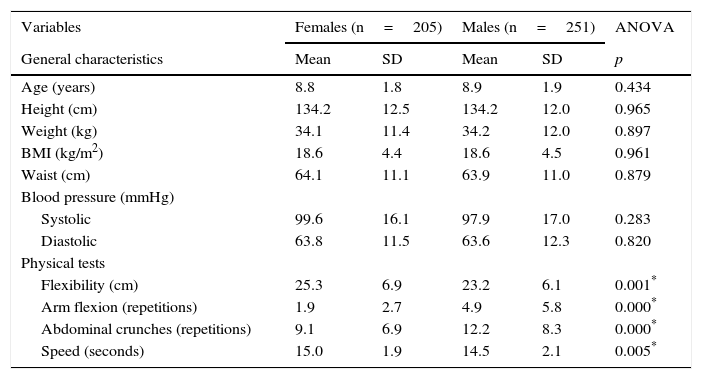
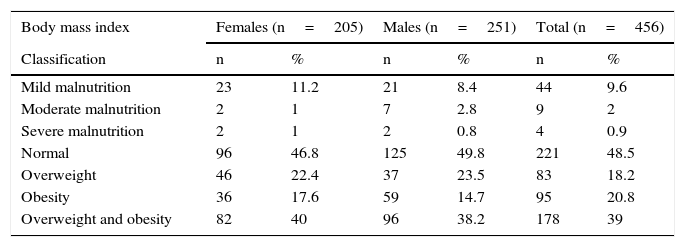
3ResultsDescriptive results in Table 1 show that, according to the average obtained from all the variables studied, there are only significant differences in the physical tests when comparing males and females. Frequency measurements and percentages for school-age children (Table 2) show that 39% of schoolchildren are overweight or obese; 9.6% have mild malnutrition; 2%, moderate malnutrition, and only 9%, severe malnutrition.
Descriptive results and main differences in the variables studied in school-age children classified by gender.
| Variables | Females (n=205) | Males (n=251) | ANOVA | ||
|---|---|---|---|---|---|
| General characteristics | Mean | SD | Mean | SD | p |
| Age (years) | 8.8 | 1.8 | 8.9 | 1.9 | 0.434 |
| Height (cm) | 134.2 | 12.5 | 134.2 | 12.0 | 0.965 |
| Weight (kg) | 34.1 | 11.4 | 34.2 | 12.0 | 0.897 |
| BMI (kg/m2) | 18.6 | 4.4 | 18.6 | 4.5 | 0.961 |
| Waist (cm) | 64.1 | 11.1 | 63.9 | 11.0 | 0.879 |
| Blood pressure (mmHg) | |||||
| Systolic | 99.6 | 16.1 | 97.9 | 17.0 | 0.283 |
| Diastolic | 63.8 | 11.5 | 63.6 | 12.3 | 0.820 |
| Physical tests | |||||
| Flexibility (cm) | 25.3 | 6.9 | 23.2 | 6.1 | 0.001* |
| Arm flexion (repetitions) | 1.9 | 2.7 | 4.9 | 5.8 | 0.000* |
| Abdominal crunches (repetitions) | 9.1 | 6.9 | 12.2 | 8.3 | 0.000* |
| Speed (seconds) | 15.0 | 1.9 | 14.5 | 2.1 | 0.005* |
BMI, body mass index; SD, standard deviation.
Frequencies and percentages for body mass index classification.
| Body mass index | Females (n=205) | Males (n=251) | Total (n=456) | |||
|---|---|---|---|---|---|---|
| Classification | n | % | n | % | n | % |
| Mild malnutrition | 23 | 11.2 | 21 | 8.4 | 44 | 9.6 |
| Moderate malnutrition | 2 | 1 | 7 | 2.8 | 9 | 2 |
| Severe malnutrition | 2 | 1 | 2 | 0.8 | 4 | 0.9 |
| Normal | 96 | 46.8 | 125 | 49.8 | 221 | 48.5 |
| Overweight | 46 | 22.4 | 37 | 23.5 | 83 | 18.2 |
| Obesity | 36 | 17.6 | 59 | 14.7 | 95 | 20.8 |
| Overweight and obesity | 82 | 40 | 96 | 38.2 | 178 | 39 |
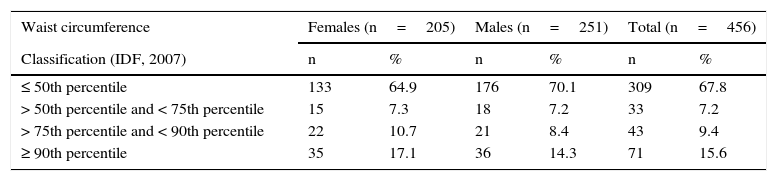
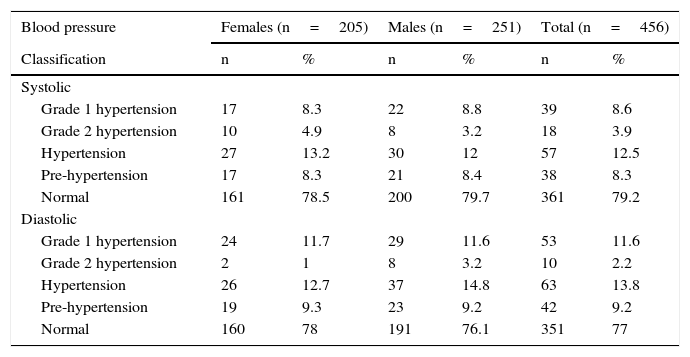
Waist circumference measurements (Table 3) show that approximately 30% of school children were > 50th percentile, and 15.6% were classified in the ≥ 90th percentile. Systolic and diastolic arterial pressure (Table 4) measurements showed that 12% and 13% of the schoolchildren considered in the study, respectively, were classified as having some form of hypertension.
Frequencies and percentages according to waist circumference classification.
| Waist circumference | Females (n=205) | Males (n=251) | Total (n=456) | |||
|---|---|---|---|---|---|---|
| Classification (IDF, 2007) | n | % | n | % | n | % |
| ≤ 50th percentile | 133 | 64.9 | 176 | 70.1 | 309 | 67.8 |
| > 50th percentile and < 75th percentile | 15 | 7.3 | 18 | 7.2 | 33 | 7.2 |
| > 75th percentile and < 90th percentile | 22 | 10.7 | 21 | 8.4 | 43 | 9.4 |
| ≥ 90th percentile | 35 | 17.1 | 36 | 14.3 | 71 | 15.6 |
IDF, International Diabetes Federation.
Frequencies and percentages according to arterial blood pressure classification.
| Blood pressure | Females (n=205) | Males (n=251) | Total (n=456) | |||
|---|---|---|---|---|---|---|
| Classification | n | % | n | % | n | % |
| Systolic | ||||||
| Grade 1 hypertension | 17 | 8.3 | 22 | 8.8 | 39 | 8.6 |
| Grade 2 hypertension | 10 | 4.9 | 8 | 3.2 | 18 | 3.9 |
| Hypertension | 27 | 13.2 | 30 | 12 | 57 | 12.5 |
| Pre-hypertension | 17 | 8.3 | 21 | 8.4 | 38 | 8.3 |
| Normal | 161 | 78.5 | 200 | 79.7 | 361 | 79.2 |
| Diastolic | ||||||
| Grade 1 hypertension | 24 | 11.7 | 29 | 11.6 | 53 | 11.6 |
| Grade 2 hypertension | 2 | 1 | 8 | 3.2 | 10 | 2.2 |
| Hypertension | 26 | 12.7 | 37 | 14.8 | 63 | 13.8 |
| Pre-hypertension | 19 | 9.3 | 23 | 9.2 | 42 | 9.2 |
| Normal | 160 | 78 | 191 | 76.1 | 351 | 77 |
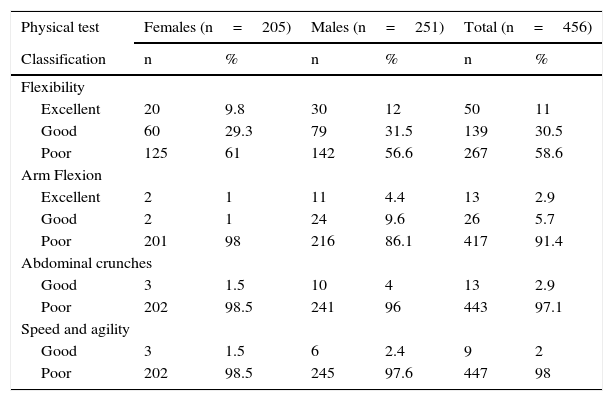
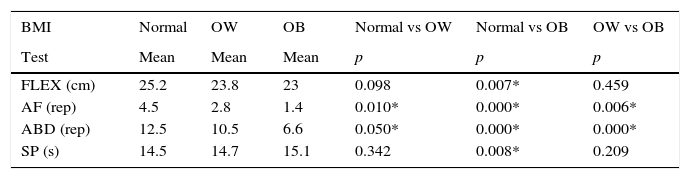
Table 5 shows that approximately 58.6% of schoolchildren were classified with poor performance in flexibility, 91.4% in arm flexions, 97.1% in abdominal crunches and 98.0% in speed. In Table 6, the main differences are observed when comparing schoolchildren with obesity against normal-weight children; however, some differences can also be observed by comparing overweight schoolchildren against normal-weight children, as well as overweight against obese.
Frequencies and percentages according to physical tests performance classification.
| Physical test | Females (n=205) | Males (n=251) | Total (n=456) | |||
|---|---|---|---|---|---|---|
| Classification | n | % | n | % | n | % |
| Flexibility | ||||||
| Excellent | 20 | 9.8 | 30 | 12 | 50 | 11 |
| Good | 60 | 29.3 | 79 | 31.5 | 139 | 30.5 |
| Poor | 125 | 61 | 142 | 56.6 | 267 | 58.6 |
| Arm Flexion | ||||||
| Excellent | 2 | 1 | 11 | 4.4 | 13 | 2.9 |
| Good | 2 | 1 | 24 | 9.6 | 26 | 5.7 |
| Poor | 201 | 98 | 216 | 86.1 | 417 | 91.4 |
| Abdominal crunches | ||||||
| Good | 3 | 1.5 | 10 | 4 | 13 | 2.9 |
| Poor | 202 | 98.5 | 241 | 96 | 443 | 97.1 |
| Speed and agility | ||||||
| Good | 3 | 1.5 | 6 | 2.4 | 9 | 2 |
| Poor | 202 | 98.5 | 245 | 97.6 | 447 | 98 |
Differences in fitness indicators among school-age children with overweight/obesity and normal subjects.
| BMI | Normal | OW | OB | Normal vs OW | Normal vs OB | OW vs OB |
|---|---|---|---|---|---|---|
| Test | Mean | Mean | Mean | p | p | p |
| FLEX (cm) | 25.2 | 23.8 | 23 | 0.098 | 0.007* | 0.459 |
| AF (rep) | 4.5 | 2.8 | 1.4 | 0.010* | 0.000* | 0.006* |
| ABD (rep) | 12.5 | 10.5 | 6.6 | 0.050* | 0.000* | 0.000* |
| SP (s) | 14.5 | 14.7 | 15.1 | 0.342 | 0.008* | 0.209 |
*main differences. BMI, body mass index; FLEX, flexibility; AF, arm flexion; ABD, abdominal; SP, speed; rep, repetition; OW, overweight; OB, obesity.
In the present study, some anthropometric and fitness indicators, and arterial blood pressure measurements of school-age children with obesity/overweight and schoolchildren with normal weight were determined. The main objective was to analyze the differences in fitness between these groups. Anthropometric results show a 39% prevalence of overweight and obesity for schoolchildren in this study; similar results were found in a study involving 321 school-age children from 6 to 14 years that attended an outpatient family medicine practice in the family medical unit (UMF) No. 32 of the Mexican Social Security Institute (IMSS) in Guadalupe, Nuevo León, Mexico15.
Waist circumference measurements in this study revealed that 15.6% of schoolchildren were classified in the ≥90th percentile; hence, it is possible to consider this percentile as an indicator of metabolic syndrome and cardiovascular risk16–18.
Regarding arterial blood pressure, we found in this study that between 12% and 13% of schoolchildren were classified with some form of hypertension, which is consistent with some other studies19,20. However, as these results are not conclusive for this primary school community, a pediatric medical diagnosis would be necessary.
The more relevant results of our study show alarming percentages of poor performance in the physical tests applied, with 58.6% of schoolchildren of both genders classified with poor performance in flexibility, 91.4% with poor performance in arms strength, 97.1% with poor performance in abdominal strength and 98% with poor performance in the speed and agility tests. Although significant differences in the average of the physical tests can be observed by comparing males with females, the percentages by gender show that there is a great similarity in terms of classification. For this reason, we can establish that both males and females show a predominant poor performance on physical tests. Similar results were found in a study carried out in a primary school in Mexico City21,22. In this regard, consistent results in adolescents and children have been found, with significant differences between males and females, but with a high percentage of schoolchildren of both genders rated as having a poor physical condition23–25.
It is undeniable that physical condition has a close relationship with health, overweight, obesity, and lifestyle of schoolchildren, as some studies reveal24,25. In the present study, we establish that there is a poor performance regarding physical condition in schoolchildren, so physical education would be of great importance to improve these aspects; however, international policies concerning physical education and health at present are not consistent with national policies26–28. For this reason, an intervention is necessary, in which different sectors of the local community could be involved in order to improve the physical condition and health of boys and girls, as well as a multidisciplinary team to achieve better results.
Another important finding in the present study reveals that there are significant differences in the results of the physical tests. When comparing schoolchildren with a normal BMI against those with obesity, we can observe that the latter had a worse performance in flexibility, abdominal strength, arm strength and speed/agility tests, these being consistent with the results of others studies carried out in Portuguese and Spanish schoolchildren29,30. Because of this, we can establish that improving physical condition of the schoolchildren could be of relevance to decrease and solve the problem of obesity in school-age boys and girls.
As a conclusion, schoolchildren with overweight and obesity in this study have a significant worse performance on physical tests; consequently, the different aspects of fitness evaluated here may serve as immediate indicators of potential health risks for children with overweight.
The search for intervention strategies involving a multidisciplinary work linked with professionals of physical education, psychology, nutrition, nursing and pediatrics, as well as different sectors of the society could be of great relevance to improve the physical condition and health of schoolchildren throughout the country.
Ethical disclosuresProtection of human and animal subjectsThe authors declare that no experiments were performed on humans or animals for this study.
Confidentiality of dataThe authors declare that they have followed the protocols of their work center on the publication of patient data.
Right to privacy and informed consentThe authors declare that no patient data appear in this article.
Conflict of interestThe authors declare no conflict of interest of any nature.
Please cite this article as: López-Alonzo SJ, Rivera-Sosa JM, Pardo-Rentería JB, de Jesús Muñoz-Daw M. Indicadores de condición física en escolares mexicanos con sobrepeso y obesidad. Bol Med Hosp Infant Mex. 2016;73:243–249.