


Introducción: La obesidad constituye una de las principales enfermedades no declarables que afectan fundamentalmente a niños y adolescentes.
Métodos: Con el objetivo de desarrollar un instrumento predictor para identificar adolescentes con alto riesgo de desarrollar obesidad, se efectuó un estudio prospectivo de cohortes en el Policlínico ‘‘Manuel González Díaz’’, Municipio Bahía Honda, durante el periodo 2013-2014. Se llevó a cabo en tres etapas: en la primera, se efectuó la captación de 1,800 adolescentes entre 10 y 19 años que formaron parte del estudio, se identificó la prevalencia y se describieron las características más relevantes de la obesidad (IMC > percentil 97 según edad y sexo); la segunda etapa posibilitó el diagnóstico de los factores que incrementaban la probabilidad de ocurrencia de obesidad; en la tercera, se elaboró y validó un instrumento predictor de obesidad a partir de los resultados de las etapas iniciales.
Resultados: Al aplicar el instrumento en la muestra A, para su elaboración y validación interna, se obtuvo una sensibilidad del 77.78% y una especificidad del 86.11%. El ABC ROC fue de 0.86. Para la muestra B, la sensibilidad fue del 79.63% y la especificidad del 92.13% para la validación externa. El VPP fue de 83.5% y el VPN de 90.05%.
Conclusiones: El instrumento permite predecir el riesgo de desarrollo de obesidad en adolescentes con una sensibilidad aceptable y alta especificidad. Su aplicación rutinaria sería interesante en consultas de puericultura.
Background. Obesity is one of the principal nondeclarable diseases affecting children and adolescents.
Methods. With the objective of developing a predictive instrument to identify high-risk adolescents with obesity, a cohort prospective study was carried out at the Policlinic “Manuel González Díaz”, Bahía Honda City from 2013-2014. It was developed in three stages. In the first stage, 1800 adolescents from 10-19 years of age were included. The prevalence was identified and the most relevant characteristics of obesity were described (defined as body mass index > 97th percentile according to age and sex). In the second stage we identified the possibility of the diagnosis of factors that increase the probability of obesity. The third stage elaborated and validated an obesity predictor instrument from the results of the initial stages.
Results. To apply the instrument to sample A for internal elaboration and validation, sensitivity was 77.78% and specificity was 86.11%. Area under the curve (AUC) receiver operating characteristic (ROC) was 0.86, whereas for sample B the sensitivity was 79.63% and specificity was 92.13%. Positive predictive value (PPV) was 83.5% and negative predictive value (NPV) was 90.05%.
Conclusions. The instrument allows predicting the risk for developing obesity in adolescents with acceptable sensitivity and high specificity. Its routine application will be interesting in pediatric health consultations.
1. Introduction
Obesity is one of the most fundamentally undeclared diseases affecting children and adolescents and is considered the pandemic of the 21st century. It is a chronic disease that results from the interaction between genotype and environment and is characterized by an abnormally high proportion of body fat. It usually starts in childhood and adolescence and is considered to be a complex multifactorial nutritional state with genetic, behavioral and environmental causes.1
Overweight and obesity have increased significantly in Cuban children and adolescents in recent decades, a trend that has also been documented in other developed and developing countries.2,3 This situation is a major health problem because childhood obesity is associated with the development, from early ages, of chronic non-communicable diseases including hypertension, dyslipidemia, hyperinsulinemia, orthopedic disorders and psychological problems that persist into adulthood.4-6
Childhood obesity is a global epidemic whose prevalence has tripled in recent decades. In the U.S. in the 1960s, the prevalence was estimated at 4.2% (for ages 6-11 years) and 4.6% (for ages 12-19 years). For 2007-2008, the estimates increased to 19.6% and 18.1%, respectively. By 2020, this prevalence will reach 35% in Europe and 45% in America; even in Asia it could reach 20%.7-9
Latin America is going through a rapid demographic, epidemiological and nutritional transition and has reached rates of obesity that have substantially increased during the last 10 to 15 years, particularly in school-age children.10 In Bolivia, the prevalence for overweight and obesity is 20.9% and 3.2%, respectively.11 In Cuba, the prevalence for overweight and obesity in children under one year of age is 5.3 and 1.9%, respectively; between 1 and 4 years 1.8 and 1.0%; in primary school students 14.2 and 9.3 %; and in high school 11.4 and 4.5%, for which obesity constitutes a health problem.1 According to its causes, obesity in children is classified into nutritional cause, also called simple or exogenous obesity, which represents the most common type of obesity (> 95%), and secondary or syndromic obesity, also called endogenous, which is part of some known conditions (dysmorphic syndromes, genetic, disorders of the central nervous system, endocrinopathy), and represents up to 5% of the cases.12
Risk is defined as the probability of suffering harm, becoming ill or dying of a particular condition or accident in the presence of certain circumstances affecting a person, group of persons, community or environment. It expresses the proximity of harm. Risk factors are the set of phenomena on which this probability depends. Thus, a risk factor can be defined as an attribute or characteristic that gives the individual a variable degree of susceptibility to contracting a disease or some type of illness.13
Diverse investigations have identified multiple risk factors associated with obesity. In the first place, the nutritional changes of modern society have substituted traditional eating patterns by fast foods with poor nutritional quality. In addition, there are many other factors such as not performing outdoor physical activities (bicycling, walking, swimming), not participating in sports, excessive use of video games, computers and television, overeating, inadequate eating patterns, lack of regular hours for eating, diabetes during pregnancy, low birth weight, no maternal breast feeding during the first stage of life, socioeconomic status, acculturation and lifestyle changes.12,14-16
The scales or instruments have been everyday tools in the work of the health specialists who work both at the primary level as well as secondary level.17-19 Some research has correlated childhood and adolescent obesity with obesity in adulthood. Thus, the risk of being obese at age 35 is 8 to 10 times greater if the person has been obese at age 10 and 35 to 56 times if he/she has been obese at 18 years of age.12
Understanding that there is at present no instrument which allows predicting the occurrence of this event in adolescents, the following scientific question was proposed as a problem for scientific research: is it possible to obtain an instrument that would allow predicting, with a high sensitivity and specificity, which children will be obese during adolescence? This motivated the realization of this work in order to estimate the prevalence of obesity, describe its most relevant characteristics, identify the main risk factors and design and validate a predictor instrument to identify adolescents at risk of developing obesity.
2. Methods
A prospective, nested case-control (1:2) community cohort study was performed. The total study was comprised of 1800 teenagers from the Core Work Group (GBT) No. 2 of the Policlinico Universitario “Manuel Gonzalez Diaz”, municipality of Bahia Honda, Artemisa Province, Republic of Cuba. It comprised 16.3% of the population of the GBT for the period of September 2013 to June 2014. The study was conducted in three stages.
2.1. First stage
With the first objective of capturing the adolescents who would form part of the study, identifying the prevalence and describing the most relevant characteristics of obesity, the 18 medical clinics of the Basic Work Group No. 2 were visited and a data file for each adolescent was recorded with all the variables of the investigation (Attachment 1). The sources of information were individual clinical histories, family files and questionnaires and direct physical examination of the adolescents, which included anthropometry (weight, height and body mass index). There were 216 adolescents identified as being obese. To identify the risk factors for obesity, a stratified random sample was carried out. The population was divided into two strata depending on the presence of obesity, with the purpose of setting up two samples: one for the elaboration and internal validation of the instrument (sample A) and the other for the external validation (sample B). Sample A was integrated by a group composed of 50% of the adolescents who were identified as obese (108 adolescents) and a control group composed of 216 adolescents who were not obese (proportion of two controls for each case), chosen by simple probabilistic random sampling (MASP) from the database established for this investigation, using the statistical processor Epidat 3.1. Sample B was composed in a similar manner by the remaining 50% of the adolescents with obesity (108 adolescents) and another control group comprised of 216 adolescents without obesity (Figure 1). Adolescents 10 to 19 years of age were included. For the group of cases, adolescents with the diagnosis of obesity were included; for the control group adolescents without diagnosis of obesity. Those adolescents with a diagnosis of endogenous or syndromatic obesity were excluded from the study.
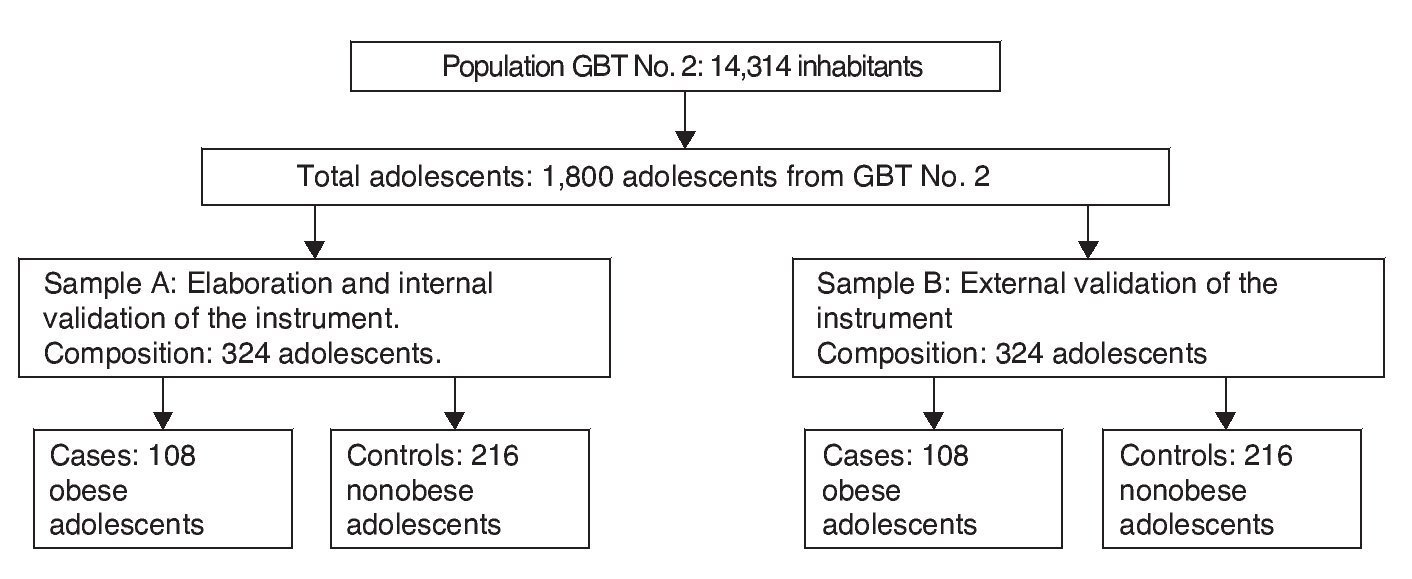
Figure 1 Population of adolescents and groups included in the elaboration of the study.
Consideration of the set of variables associated with obesity in these patients was carried out based on the literature review, results of previous research and consultation of experts.
The potential variables were reviewed by a first panel of experts composed by five prestigious renowned specialists in the field connected with childcare activities.
The 21 variables that were included in the study were made operational. They are listed below:
1. Gender: male or female. According to direct observation and individual clinical history.
2. Skin color: mestiza, white, black or other. According to direct observation and individual clinical history.
3. Neighborhood (place of residence): rural or urban. According to family record.
4. Marital status of parents: married or divorced. According to family record.
5. Level of schooling of parents: primary, high school or university. This is conceptualized as the last grade completed. According to family record.
6. Occupation of the parents: skilled worker, technician, college student, self-employed, unemployed. According to family record.
7. Family income: normal (> 50 pesos), low (< 50 pesos). According to family record.
8. Classification of the family according to ontogenesis: nuclear, extensive or broadened.20 According to family record
9. Family functionality: Test FF-SIL.21 Functional (50-43 points), dysfunctional (42-14 points). According to family record.
10. Gestational diabetes in the mother. According to the obstetrical file of the mother.
11. Family history of obesity: father, mother or siblings. According to the individual clinical history.
12. Low birth weight < 2500 g. According to the individual clinical history.
13. Exclusive breast feeding up to the sixth month of life. According to the individual clinical history.
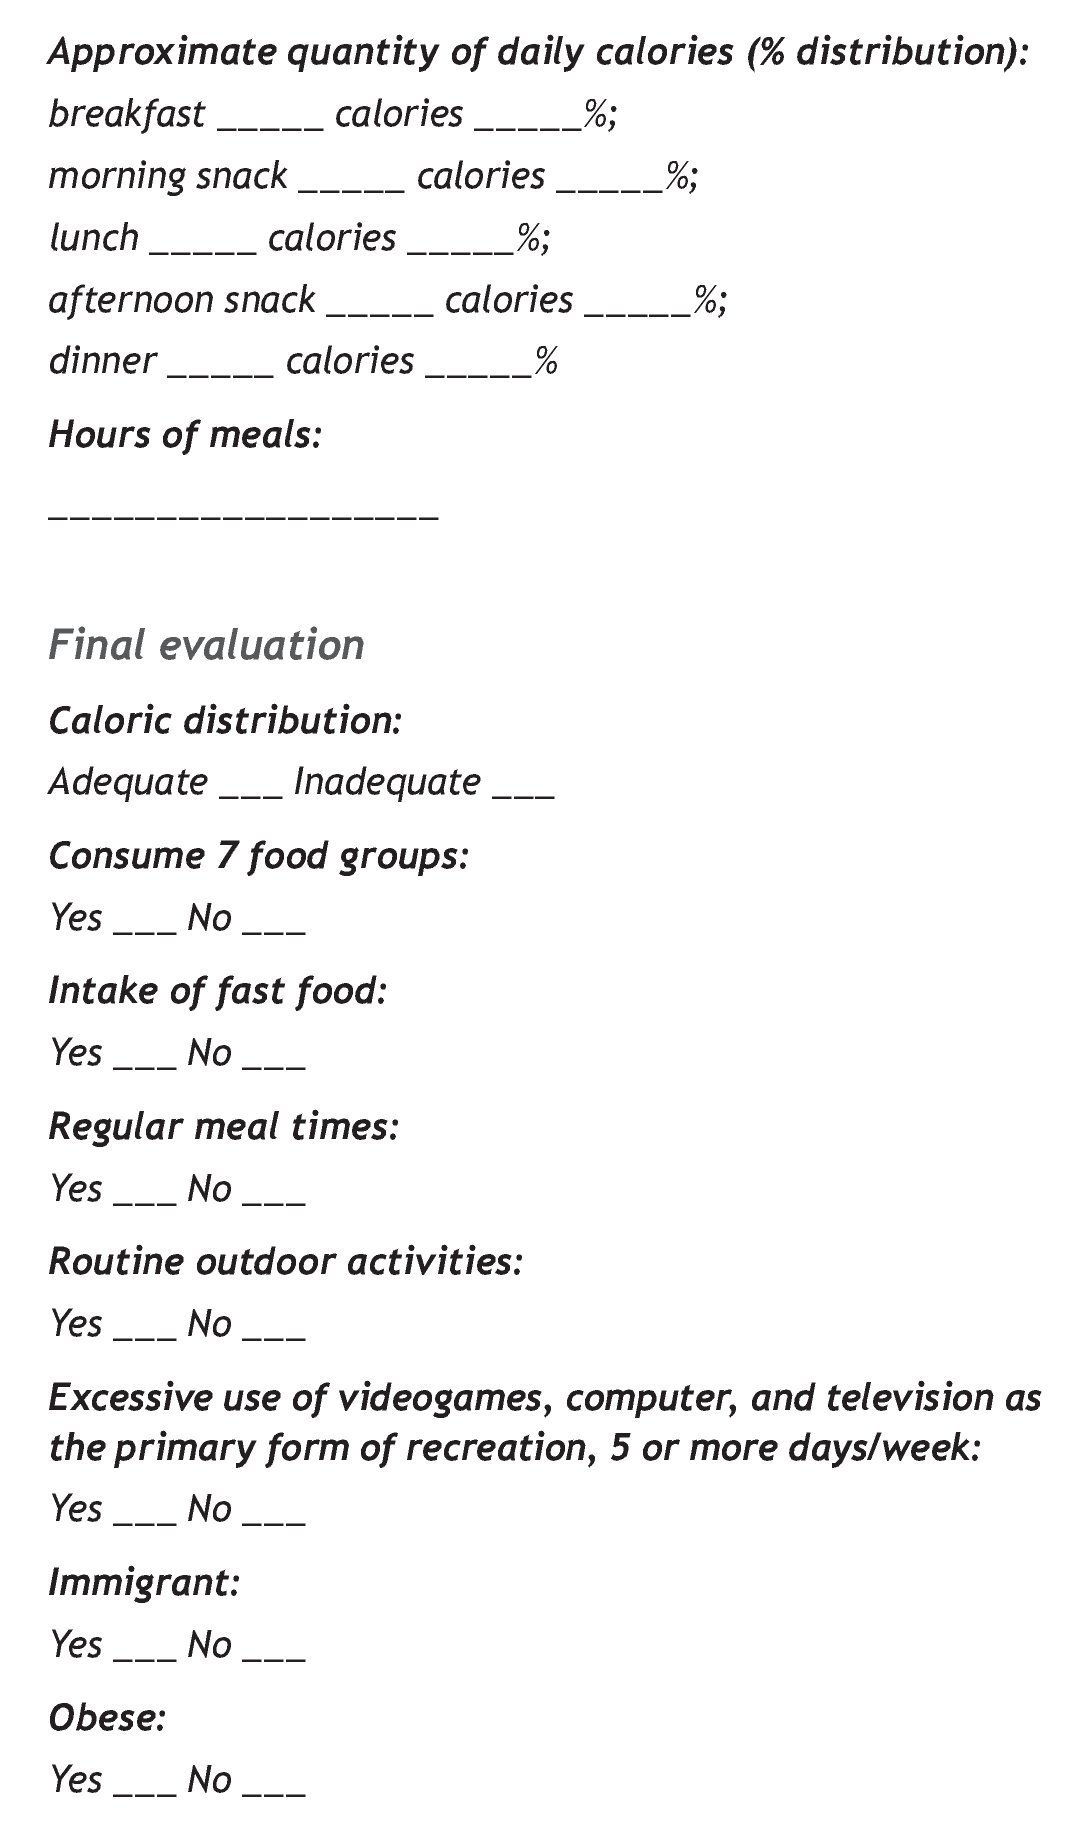
14. Calorie distribution: adequate (breakfast: 15%, lunch: 35%, dinner: 35%, two snacks (5% each one) and one nighttime snack 5%), inadequate (does not comply with the above distribution). According to a 3-day dietary survey; one of them during the weekend.
15. Quality of the diet: adequate (consumes the seven basic food groups at each meal), inadequate (does not consume the seven basic food groups at each meal). According to a 3-day dietary survey; one from the weekend.
16. Eating fast foods. Consumes fast foods outside and within the home 5 or more days of the week. According to direct questioning of the adolescent.
17. Regular eating schedule. The main meals of the day (breakfast, lunch and dinner) are done with the family at regular hours. According to direct questioning of the adolescent.
18. Regular practice of outdoor activities. Systematic realization (at least 5 days a week, 1-h per day) of activities outdoors (bicycling, walking, swimming or sports). According to direct questioning of the adolescent.
19. Sedentary entertainment. Excessive use of video games, computers and television as the principal source of entertainment, 5 or more days per week. According to direct questioning of the adolescent.
20. Acculturation. In this case the condition of being an immigrant, i.e., children from other regions of the country, was taken into consideration. According to the family record.
21. Obesity. Clinically a child is considered obese when the child’s weight is > 20% the ideal mean weight for his age, height and gender. The ideal weight corresponds to the 50th percentile for height and gender. For determination of obesity, the Cuban reference tables for growth and development were used where the weight and height relationships according to the age and gender are provided. Cut-off points grouped by percentiles were used; > 90% percentile corresponds to overweight and > 97th percentile to obesity. BMI was used because it connects the weight with potential for height and meets the requirements of being independent of the height. It also correlates to a high degree with body weight and adiposity and was calculated using the following formula:

It was obtained via the direct physical examination of the adolescents, which included anthropometry.
2.2. Second stage
Once data were collected and entered into the database, a univariate analysis was done of sample A, using the statistical package Epidat 3.1 for the selection of the variables significantly related with obesity. This facilitated the diagnosis of the factors that increased the probability of this problem occurring in the population, according to the values reported of its relative risks (RR). The variables associated with obesity, according to the univariate analysis, had a multivariate analysis done using multiple logistic regression with dichotomous response whose results allowed to assess which variables contributed to a significant risk independent of obesity, and at the same time a prognostic model was designed. Therefore, the variable of response, the obesity, was left as “without” or “with” obesity and was coded as 0 and 1, respectively. For executing the run of regression, the ENTER method was utilized because the goal was to evaluate the results of the complete model and the variables that could constitute risk factors. It was considered that there was a significant risk when the RR and the lower limit of its 95% confidence interval were > 1.
2.3. Third stage
The construction of the tool included selection of the components and search for weights. For the selection of the components there were three elements taken into consideration: univariate analysis, logistic regression and expert opinions.
For evaluation of internal consistency (coherence between items), the instrument with its respective items was used and the Cronbach alpha coefficients were calculated. A general Cronbach alpha was calculated (the alpha obtained by eliminating each of the items), the coefficients of correlation between each time and that which would be formed with the sum of the weighted items as well as the coefficient of determination (R2) that arises by using each item as a dependent variable and the rest of the items as independent variables.
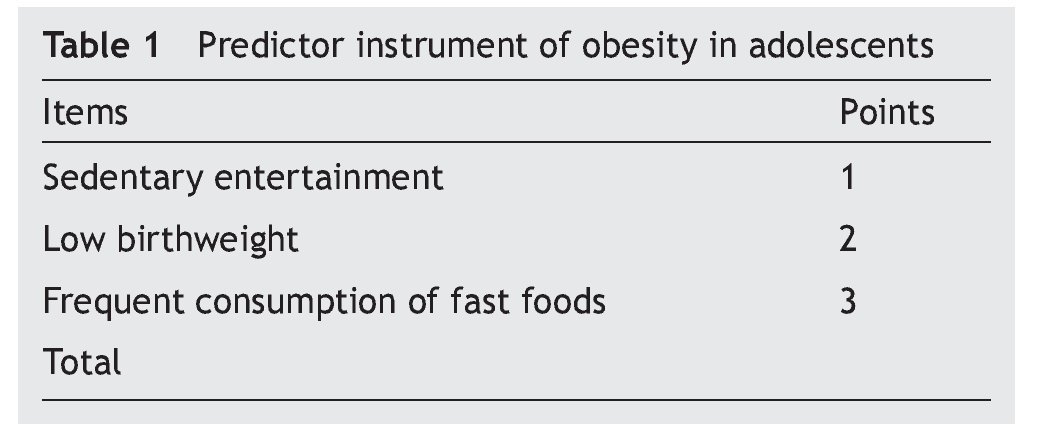
For weighting of the items, the technique of logistic regression and the opinion of the experts were used, using the first panel of specialists. For it, a weight estimated by points per item was assigned according to the intensity of the association between the risk factor and obesity as a response variable. The assignment of values to the points was from 0 as a condition of normality (absence of the risk factor) and values of 1, 2 or 3 points were assigned depending on the risk factor present.
Once the logistic regression analysis was complete, the evaluation by experts was done to determine the tool’s components. During the first round the experts were asked to evaluate the five risk factors considered as items for the tool. When calculating the Cronbach alpha coefficient of the results of this round, five items were analyzed with six observations and a general Cronbach alpha of -0.1667, with one item for which there was concordance standing out: living in a dysfunctional family setting. This item was eliminated from the tool to convene a second round of evaluation by experts. During the second round, the four risk factors considered as items for the instrument were evaluated. When the Cronbach alpha coefficient was calculated for the results of this round, with four items analyzed, with six observations and a general alpha Cronbach of 0.3750, an item for which there was no concordance stood out: inadequate calorie distribution. This was eliminated from the tool and a third round of evaluation was convened with the experts. During the third round, three risk factors being considered as items for the tool were submitted for evaluation; with six observations and a general alpha Cronbach of 0.75, with understanding that with this result the concordance was adequate. Finally, it was decided that the three items proposed would form part of the tool to predict obesity in adolescents. The final scores were considered with the sum of the value of the factors that finally constituted the tool (Table 1). Included on the back of the tool was a brief explanation for the user (Attachment 2).

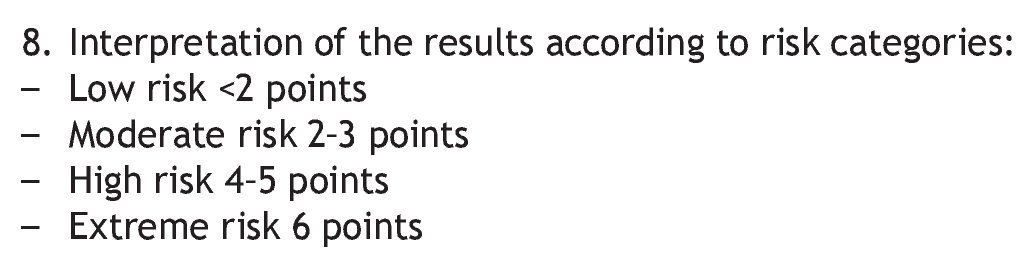
Different risk categories were proposed according to the result from the calculation of the quarters, with the tool values and the division of the empiric distribution of the index in “zones” using the quartiles 25, 50 and 75 with the view of establishing four categories: low risk of obesity (value < 25 percentile); moderate risk of obesity (value ≥ 25th percentile and < 50th percentile); high risk of obesity (value ≥ 50th percentile and < 75th percentile); extreme risk of obesity (value > 75th percentile).
To evaluate the capacity of the tool to discriminate, the results were represented in a simple ROC curve carrying out score estimations and by 95% CI of the area below the curve (ABC). It was felt that if the ABC reached a value > 0.75 the instrument would possess a good level of discrimination. An optimal cut-off point was also estimated from a purely quantitative criterion, given by the value of the tool where high sensitivity and specificity were obtained.
2.4. Validity and reliability of the tool
Various aspects of the validity were explored: presentation and content, perceptual validity and of criteria. The validity of presentation and content were explored together by means of a survey to 15 new experts. Each one was given a formulary for gathering the information, an instruction manual on how to complete it and a written explanation of the meaning of each of the aspects they should evaluate.
For the selection of the new experts, the competence of the expert on the topic determined for self-evaluation of the candidate himself was taken into account, and the K coefficient was calculated (coefficient of expert’s competence). Each candidate was provided the form “Process for selection of experts” to be completed individually. The results were interpreted in the following manner: high (0.8-1); medium (0.5-0.79); and low (< 0.5). Only the experts with high results were selected. Once the K coefficient was calculated for each of the 20 proposed experts, it was found that 75% (15) obtained a coefficient between 0.8 and 1, qualifying to form part of the group that participated in the validation of the tool.
The Delphy methodology was used for validation of the tool.22 Each professional was offered a written summary of the fundamental aspects of the investigation that was carried out for development of the tool: scientific problem, theoretical-practical input, methodological design, and principal results for in-depth analysis of the same. Next, each expert was provided the form “Evaluation by experts of the tool to predict obesity in adolescents” where they were asked to offer their ideas and criticisms on the virtues, deficiencies and insufficiencies of the tool in its theoretical practical conception and that could affect its application in clinical practice. Starting from an evaluation of a group of aspects, the experts then issued a score from one to nine with a value that, in their opinion, every aspect deserved. The results of the evaluation were statistically significant. This implied that there was sufficient evidence to propose with 99% confidence that the 15 experts agreed in the degree of coincidence of the effectiveness of the tool, both in the quality of its theoretic concept as well as in the effectiveness that its application would have in clinical practice.
To evaluate the reliability, the general reliability coefficient for the quantitative index was calculated and the degree of compliance of two of its aspects was verified: the equivalence in terms of concordance between “judges” and the internal consistency of the tool in general.
To validate the equivalence, an inter-observer test was given using two “judges” (pediatricians) who independently applied the instrument with the variables selected to the same data forms.
For evaluation of the concordance between judges, the Kendall coefficient of concordance was obtained, which expresses the degree of association between a certain number of similar variables. It is particularly useful for the study of reliability among experts tested.
Once the tool was constructed, it was applied to the B sample and using the Epidat 3.1 statistical package the sensitivity, specificity and the probability ratio were determined.
2.5. Bioethical criteria
Informed written consent for participation in the investigation was requested from the parents of the adolescents after being correctly and explicitly informed about what and why and the reason for which the study was being conducted. They were informed that they were free to choose to participate in the study. The confidentiality of the data was guaranteed. The Ethics Committee on Health Research approved the study (Attachment 3).
3. Results
The prevalence of obesity in the population studied was 12% (Figure 2). There was a slight female predominance (54.2%), Caucasian (39.8%) and from an urban environment (87%), although no statistically significant differences were found between groups compared in any of the three variables (p > 0.05) (Table 2).
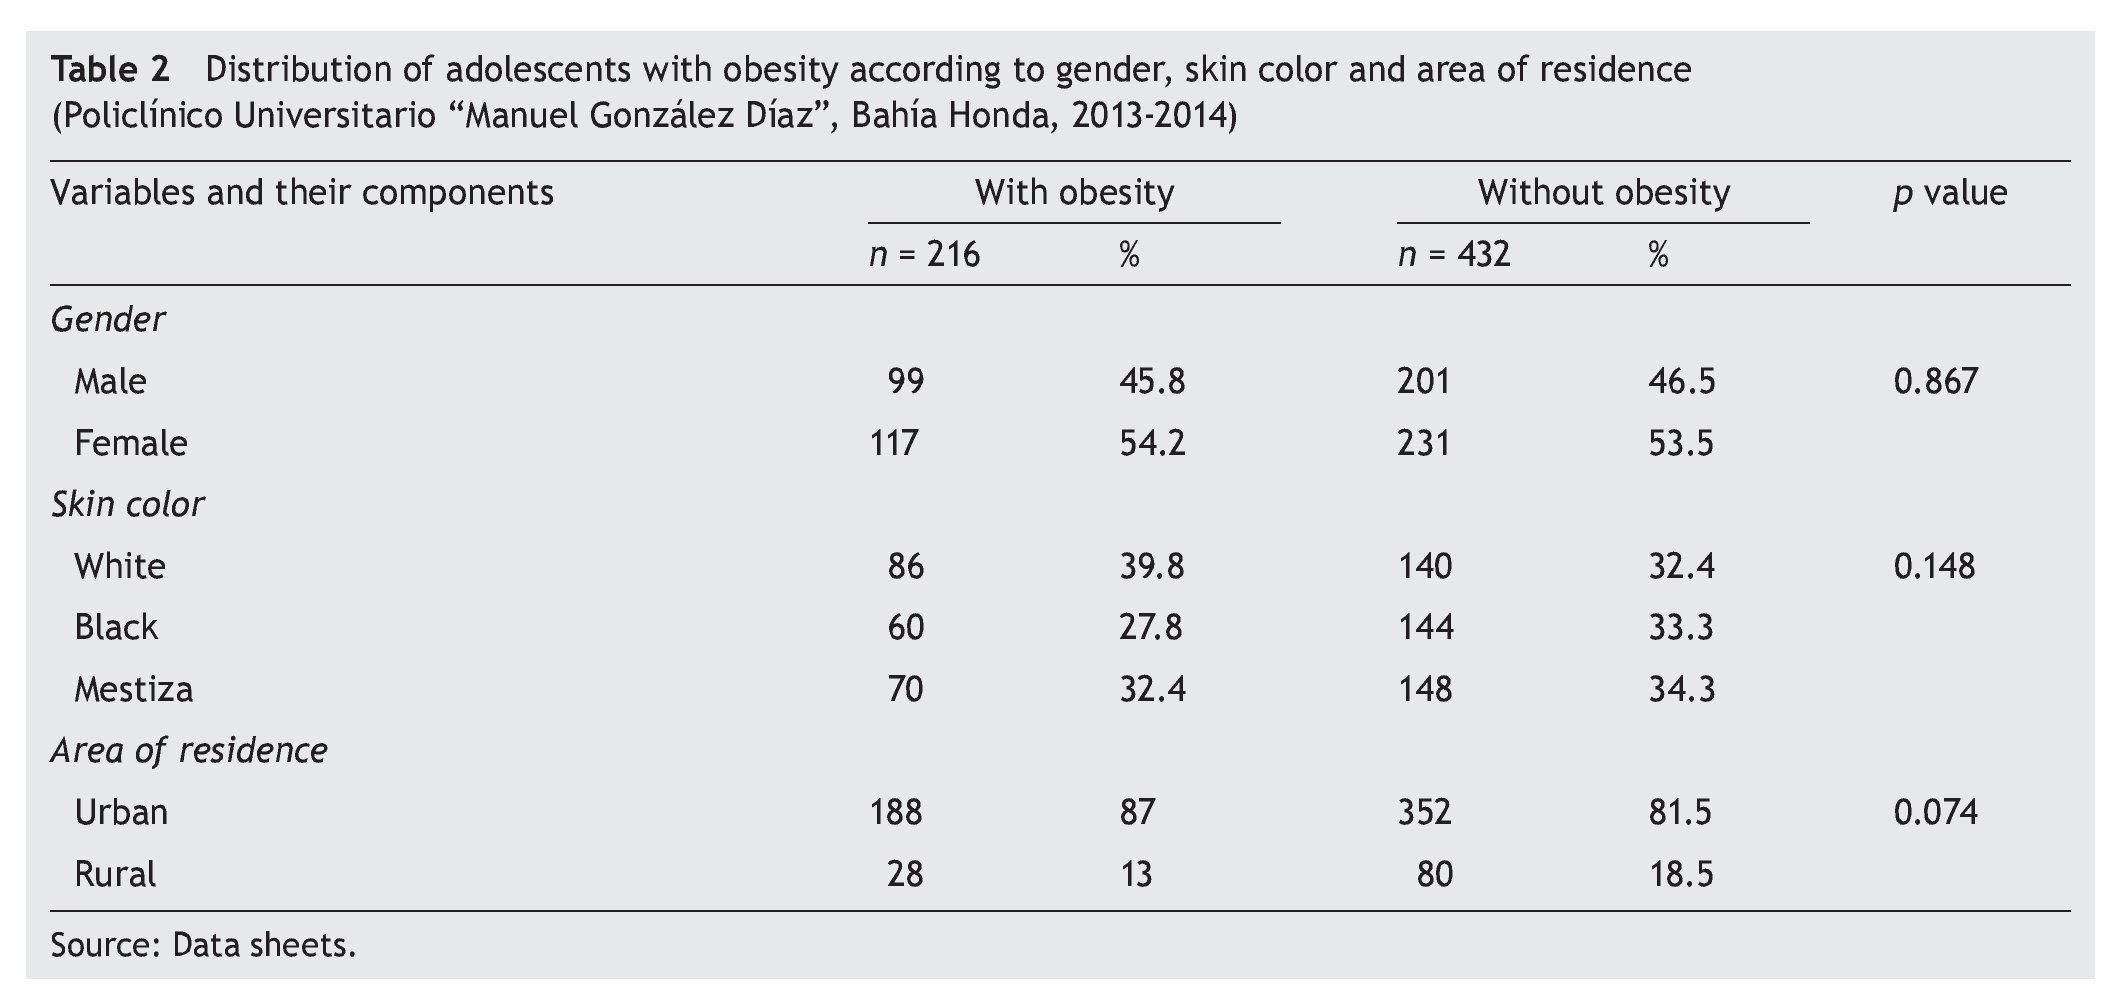
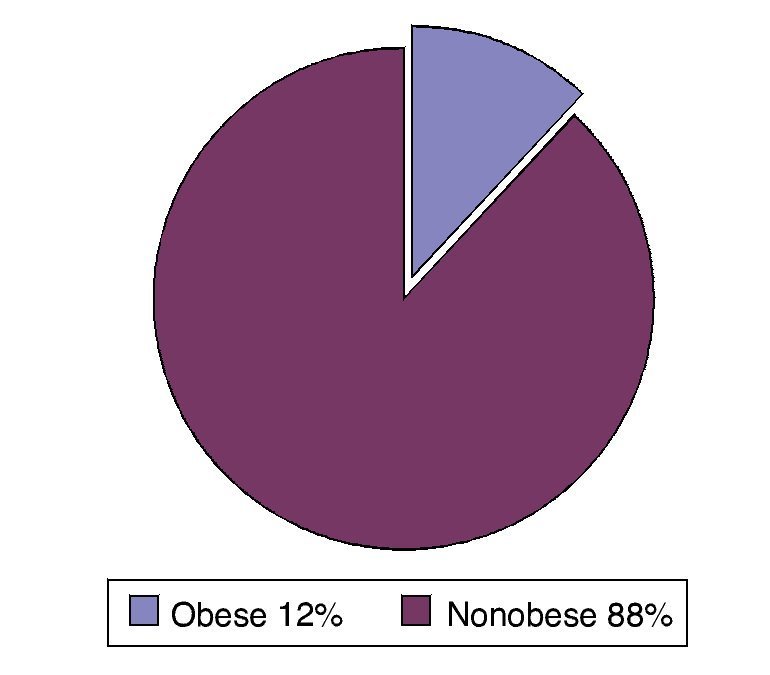
Figure 2 Prevalence of obesity in the study population (Policlínico Universitario “Manuel González Díaz”, Bahía Honda, 2013-2014).
Once the univariate analysis was completed, there were seven risk factors associated with obesity in adolescents identified: dysfunctional family [RR 1.71 95% CI (1.24-2.35], family history of obesity [RR 1.78 95% CI (1.32-2.4)], low birth weight [RR 2.11 95% CI (1.52-2.92)], inadequate calorie distribution [RR 3.52 95% CI (2.5-4.96)], frequent consumption of fast foods [RR 2.67 95% CI (1.93-3.68)], no systematic practice of outdoor activities [RR 2.17 95% CI (1.5-3.14)] and sedentary entertainment [RR 2.11 95% CI (1.45-3.07)] (Table 3).
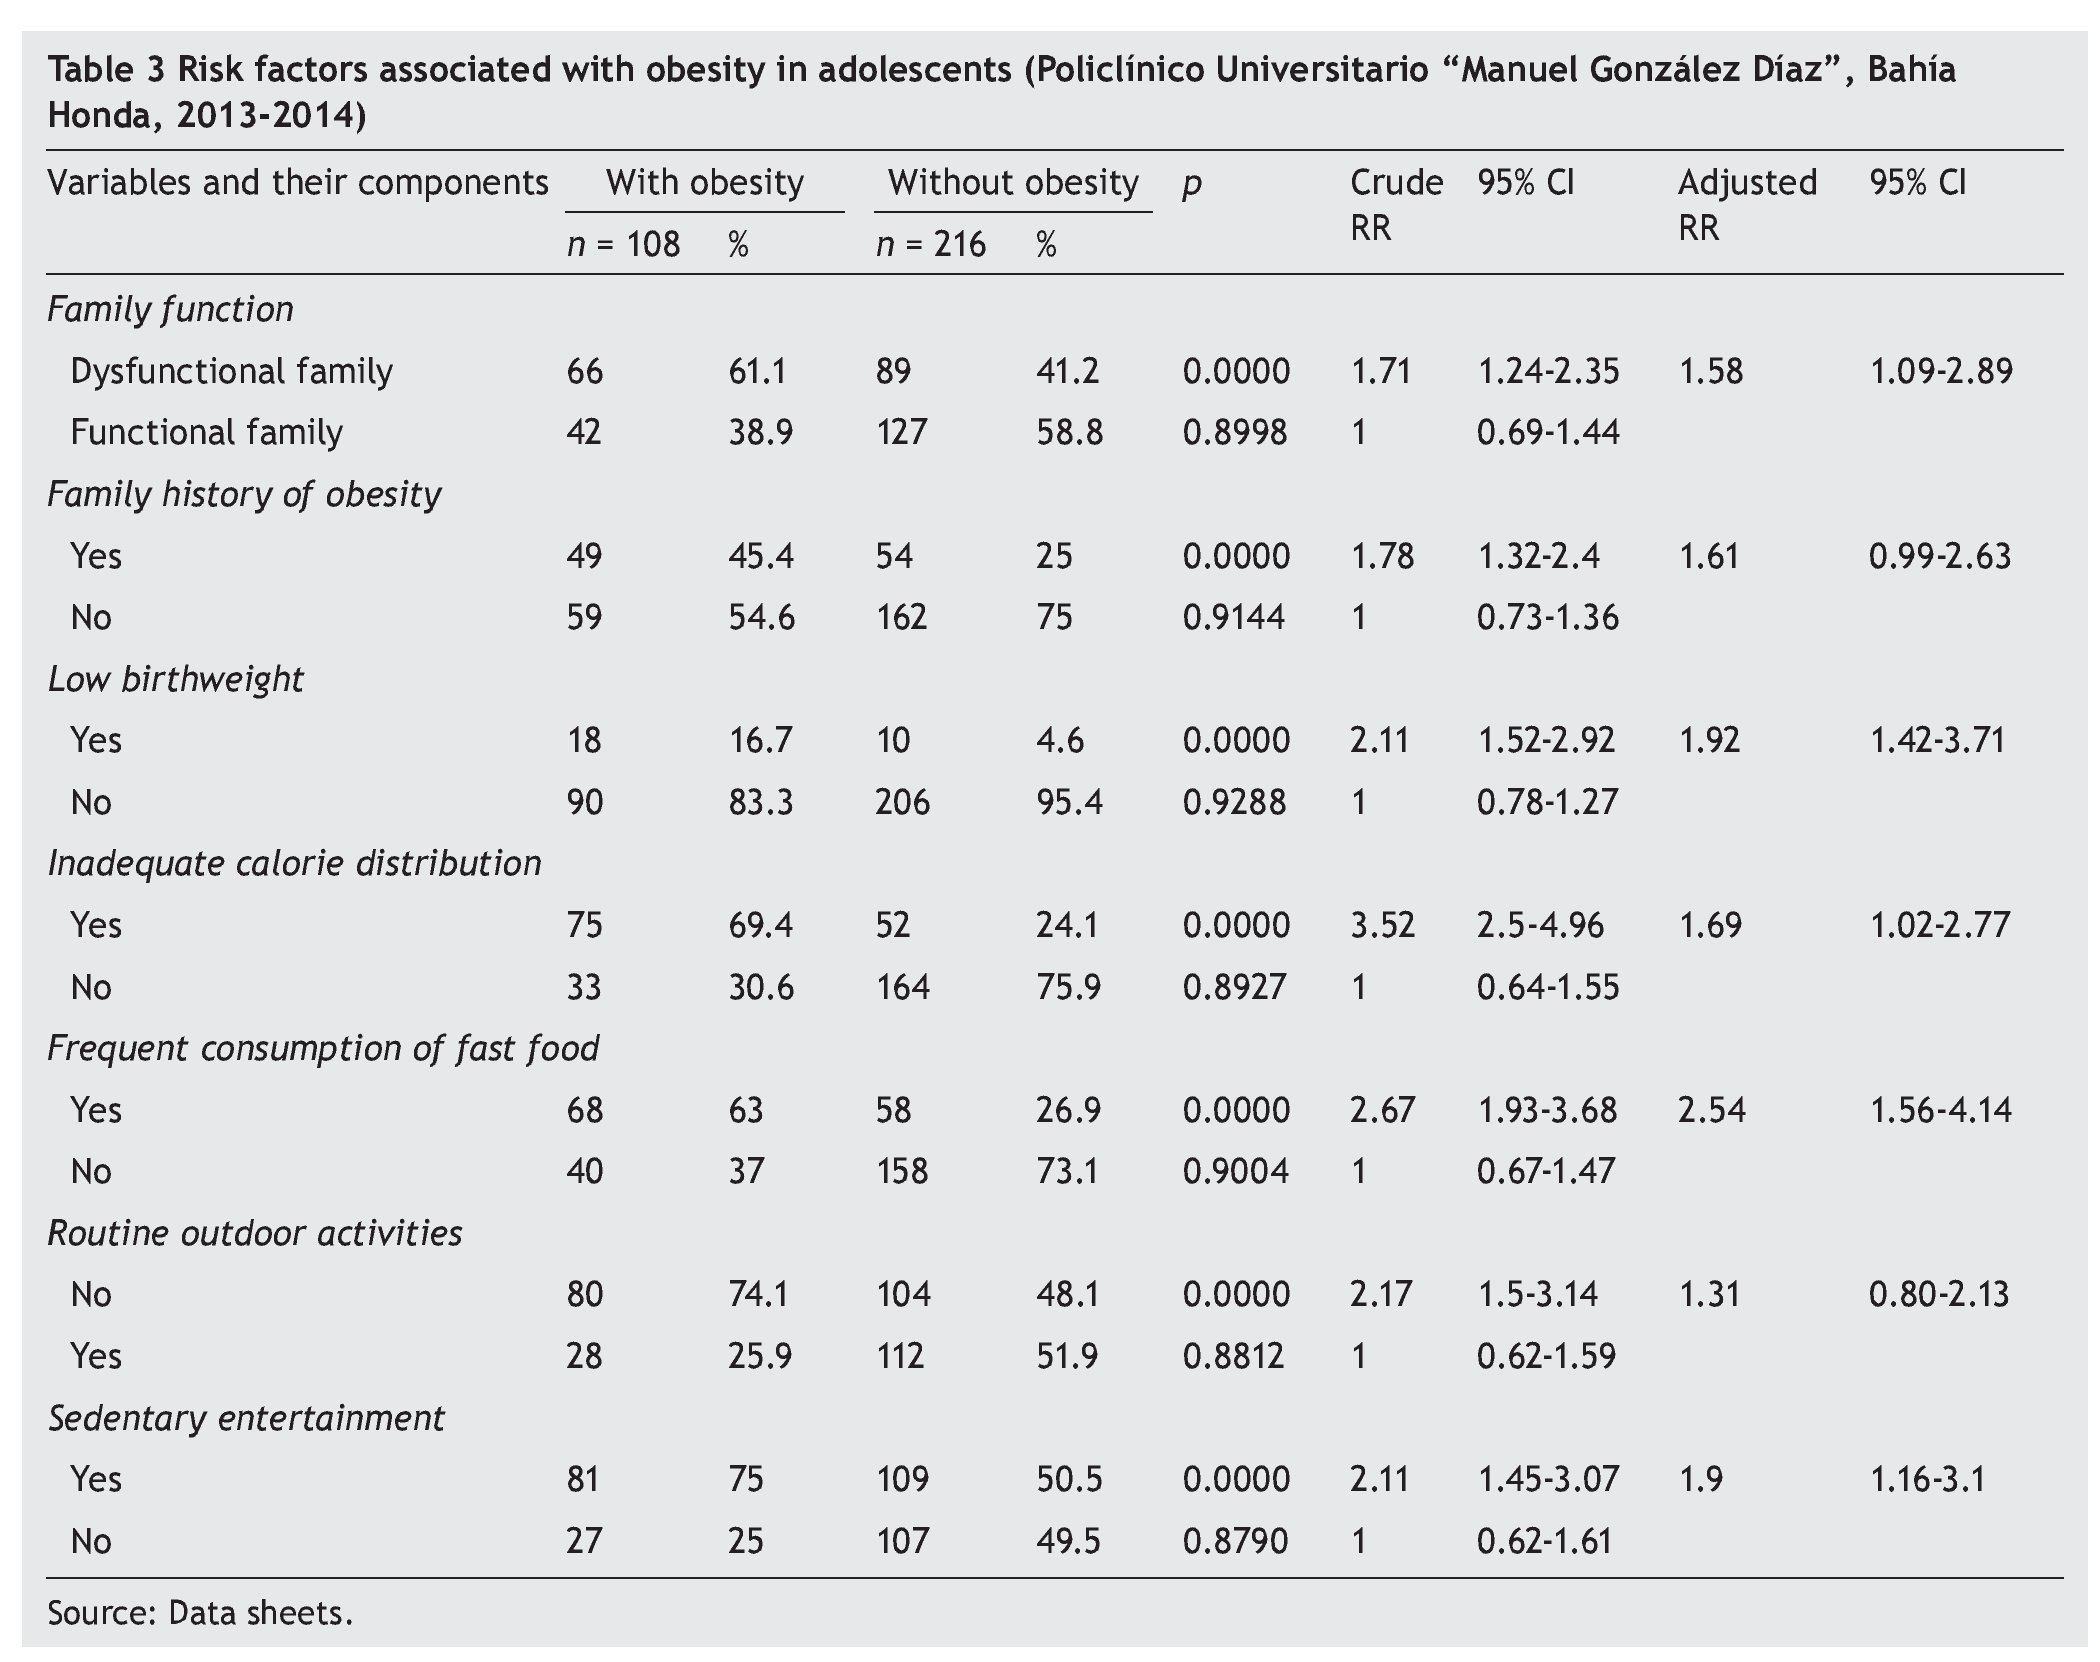
Once the multivariate analysis was done, there were five risk factors significantly associated with obesity in adolescents: dysfunctional family [RR 1.58 95% CI (1.09-2.89)], low birth weight [RR 1.92 95% CI (1.42-3.71)], inadequate calorie distribution [RR 1.69 95% CI (1.02-2.77)], frequent consumption of fast foods [RR 2.54 95% CI (1.56-4.14)] and sedentary entertainment [RR 1.9 95% CI (1.16-3.1)]. When the Hosmer-Lemeshow goodness-of-fit test was done there were no significant differences in any of the groups of factors analyzed between the observed and expected values of the response variable, so it was considered that the models were adjusted to reality (Table 3).
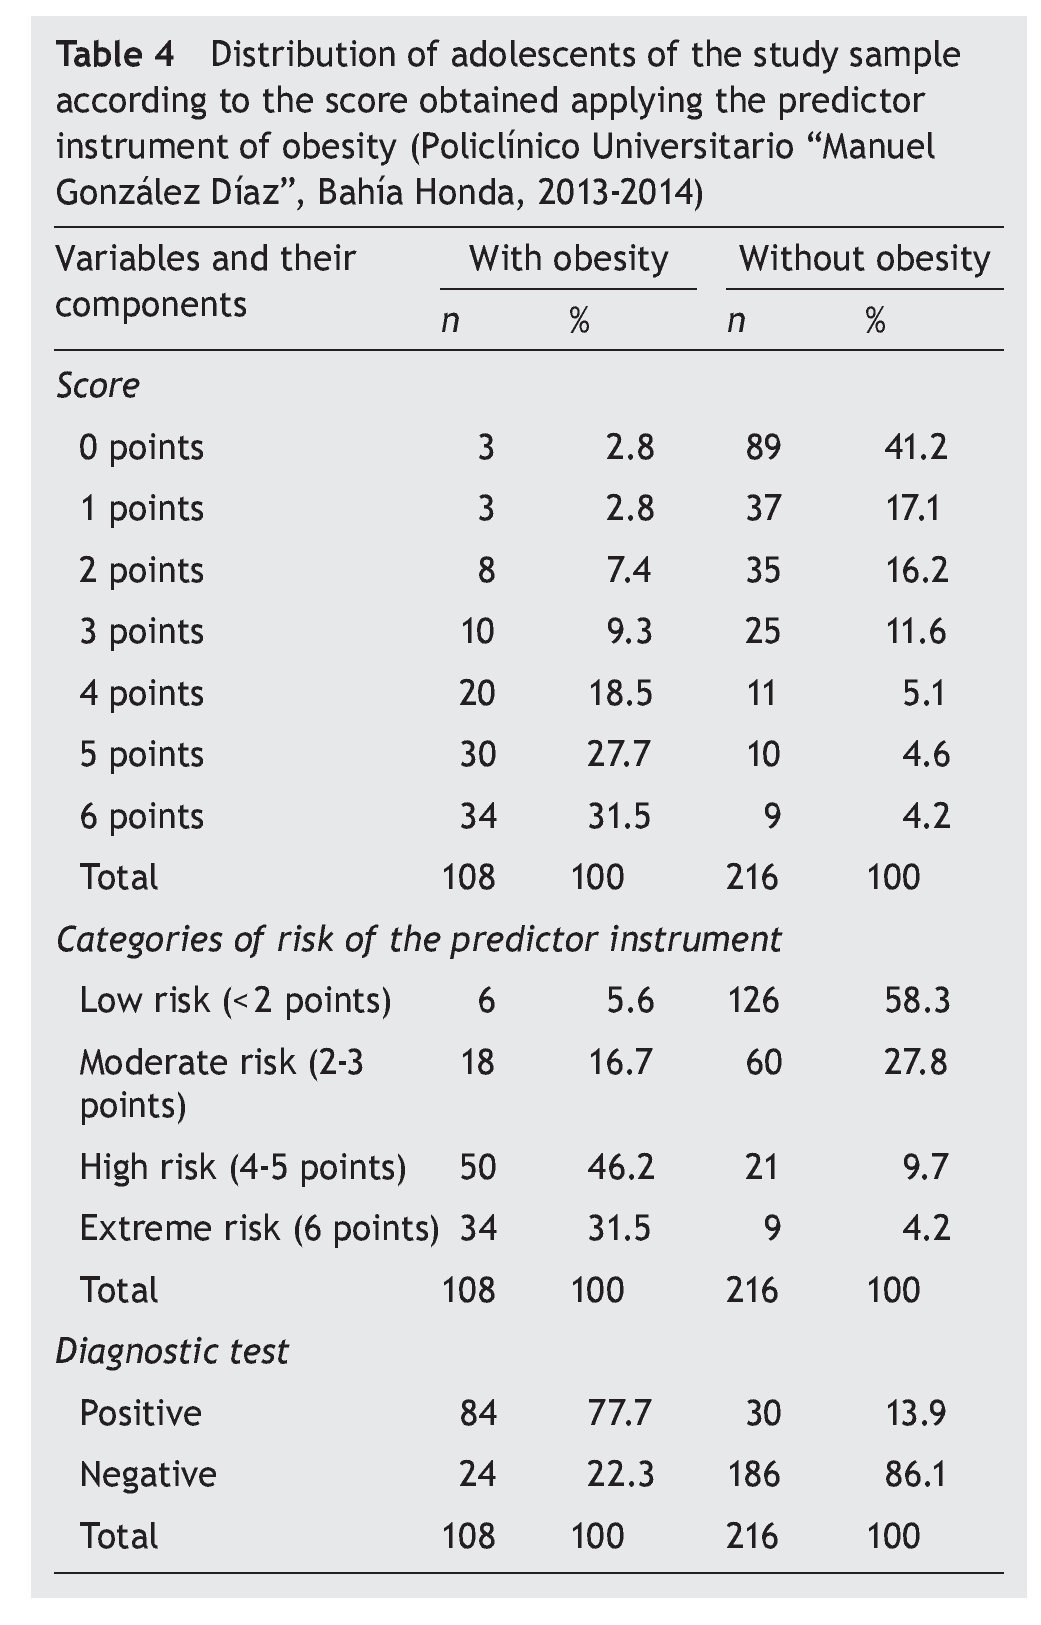
Table 4 shows the distribution of adolescents of sample A according to the scores obtained when the tool to predict obesity was given. It can be seen that there was predominance of obese adolescents with scores between 4 and 6 points, whereas in those who were not obese there was predominance of those with 3 points or less. The values that defined the distribution in quartiles of the values of the instrument were estimated from the above results. Note that when the adolescents with and without obesity were distributed, according to the risk categories proposed for use with the tool, it was found that 46.2% of obese adolescents had between 4 and 5 points and 31.5% had six points. In the case of healthy adolescents, 58.3% had < 2 points and 27.8%, between 2 and 3 points. When the results of the administration of the tool to predict obesity in adolescents from sample A were analyzed, taking as a cut-off point a value of 4 points, it was able to be proven that in 77.7% of obese adolescents the test was positive and that in 86.1% of healthy adolescents it was negative.

By determining the diagnostic value of the tool to predict obesity, the results demonstrated a sensitivity level of 77.78%, specificity of 86.11%, positive predictive value (PPV) of 73.68% and negative predictive value (NPV) of 88.57%. This, together with the ratio of probability indicates that the adolescents with scores of 4 or more have approximately six times more probability of becoming obese than their peers.
Using the values established in the tool and the results of its application in sample A, the results obtained allowed for the development of a ROC curve to obtain the optimal cutoff point, i.e., that which would show the higher sensitivity and specificity. A value of 4 points or more was considered as such, for which the ABC ROC was 0.86, with SE = 0.0206 and 95% CI (0.8257-0.9063), a higher value at 0.75 indicating that the tool had a high level of discrimination. This result also showed concurrence with the risk categories that had been proposed from the distribution by quarters of the scale values (Figure 3).
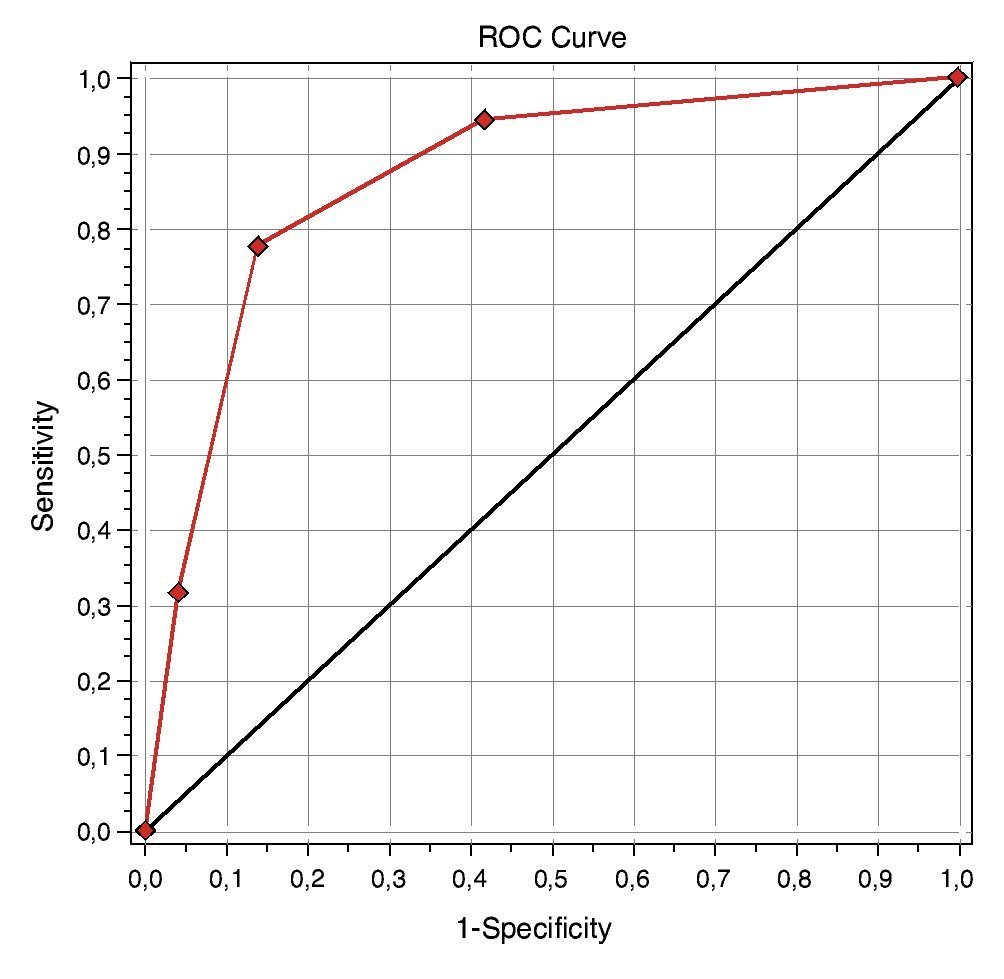
Figure 3 Simple ROC curves. Total of adolescents of the sample A evaluated at the Policlínico “Manuel González Díaz”, Bahía Honda (2013-2014).
With the completion of the inter-observer test to two pediatricians who acted as judges applying the instrument to predict obesity in adolescents to the same 100 data records chosen at random from sample A, a kappa of 0.8371, with SE = 0.05 and 95% CI (0.7292-0.9450), χ2 of 8.3986 and Kendall’s tau-b of 0.8399 was confirmed. This demonstrated with 95% reliability that the inter-observer concordance was excellent, assuring the equivalency of the tool.
When the distribution of adolescents with and without obesity was carried out in sample B according to risk categories of the tool to predict obesity, 36.1% of the patients obtained between 4 and 5 points, and 41.7% obtained 6 points.
In the case of healthy adolescents, 73.1% obtained < 2 points and 19% between 2 and 3 points. When the results of the application of the tool to predict obesity of sample B were analyzed, taking into consideration a cut-off point with a value of 4 points, it was able to be confirmed that in 79.6% of obese adolescents the test was positive, being negative in 92.1% of adolescents without obesity (Table 5).
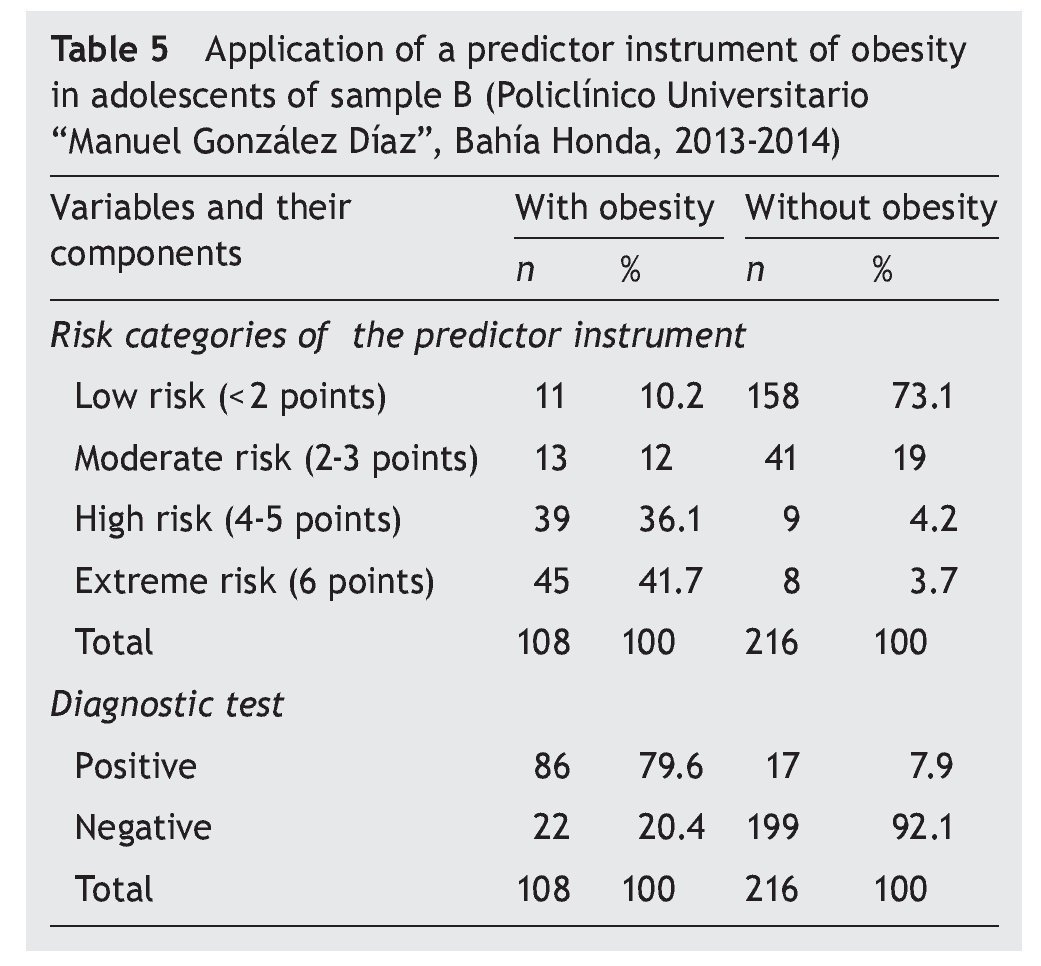
The results showed a level of sensitivity of 79.63%, specificity of 92.13%, PPV of 83.5% and NPV of 90.05%, which indicates that the described tool allows predicting the possibility of developing obesity in adolescents with acceptable sensitivity and high specificity.
4. Discussion
From 1980, according to the World Health Organization, obesity has doubled worldwide; 65% of the world’s population lives where overweight and obesity claim more lives than being underweight. In 2013, > 42 million children < 5 years of age were overweight and obese. In developing countries with emerging economies, the percentage increase of overweight and obesity in children has been 30%, even higher than in developed countries.23 The results of this study are similar to those reported in the literature.
Age, gender, or skin color were not related with obesity. This coincides with what was reported by Aguilar-Cordero et al. who also did not note significant differences between obesity and factors such as age or gender (χ2 = 2.22; p = 0.528).24 Other authors found similar results.25-27
Multiple risk factors for obesity in adolescents have been identified in various investigations, which include the mixed feeding from the first months of life, predominance of low daily physical activity, not participating often in sports and a high number of hours in front of TV, video games or computer, high frequency of family history of obesity and the pattern of eating predominantly cereals, milk products, sweetened foods and grains in addition to low consumption of fruits, vegetables and fish.28-40
Of the risk factors most commonly associated with obesity, the following are mentioned: history of low birth weight in the opinion of Leduc et al. implies a greater risk of developing obesity as well as T2DM, dyslipidemias and other chronic diseases associated with mitochondrial dysfunction, higher production of reactive oxygen species and vascular endothelial cell lesions, which is the initial lesion of atherosclerosis.41 Authors such as Basain et al. share these criteria.42
According to Santaliestra-Pasías et al., eating, physical activity and sedentary behaviors are the biggest determinants of obesity. The new technologies and activities based on electronics have produced a decrease in physical activity and an increase in sedentary activities in children and adolescents. Diverse mechanisms have been suggested to explain the association between watching television and obesity: displacement of physical activity, effects of food commercials, increase in caloric intake in the absence of hunger (automatically) and increase in eating produced by being distracted.43 In their study, Pajuelo et al. concluded that, in adolescents, the cause for obesity and overweight is essentially due to low physical activity.44 The present results agree with the literature consulted.
Different investigations have been carried out that predict the percentage of fat from the body circumferences in prepubertal children by different methods. Gómez-Campos et al. developed equations for predicting the percentage of body fat from arm, waist and calf circumferences and proposed percentiles for diagnosing the nutritional status of boys and girls 4 to 10 years of age. These equations have been validated and are an alternative for evaluating the percentage of fat in school-age children of both genders.17 Furthermore, Moral and Meza demonstrated that certain factors allowed to predict the dichotomous variable of being or not being overweight/obese. According to their results, lower socioeconomic status was correlated with the presence of overweight/obesity and higher BMI, although it was independent of the educational level.45
Among the strengths of the present investigation it can be said that the tool is easy to administer in an ambulatory care consult because it is there where all the sources of information necessary for its realization are found. It can also be administered serially in each control because healthy and at-risk adolescents in Cuba are examined periodically by the family physician in medical consultation, and at the home, which allows for a complete evaluation and risk factor modification.
Among the main limitations of the study is that the investigation was principally carried out in an urban population, so it would be feasible to perform it in populations with different economic and sociocultural contexts with a view towards its validation.
Obesity is a common presentation in adolescents in the municipality of Bahia Honda, with a prevalence of 12%. Five risk factors associated with this entity were identified: dysfunctional family (RR 1.58), low birth weight (RR 1.92), inadequate caloric distribution (RR 1.69), frequent consumption of fast foods (RR 2.54) and sedentary recreation (RR 1.9).
As a result of this research, a tool was obtained that allows for predicting the risk of developing obesity in adolescents, with an acceptable sensitivity (79.63%) and high specificity (92.13%). Its serial application in child care consultations in primary health care would be interesting, which is where the fundamental actions of promotion and health prevention are carried out.
Conflict of interest
The authors declare there are no conflicts of interests of any nature.
Right to privacy and informed consent
The authors declare that no patient data appear in this arti cle.
Funding
No external sources of funding are declared.
Attachment 1. Data sheet

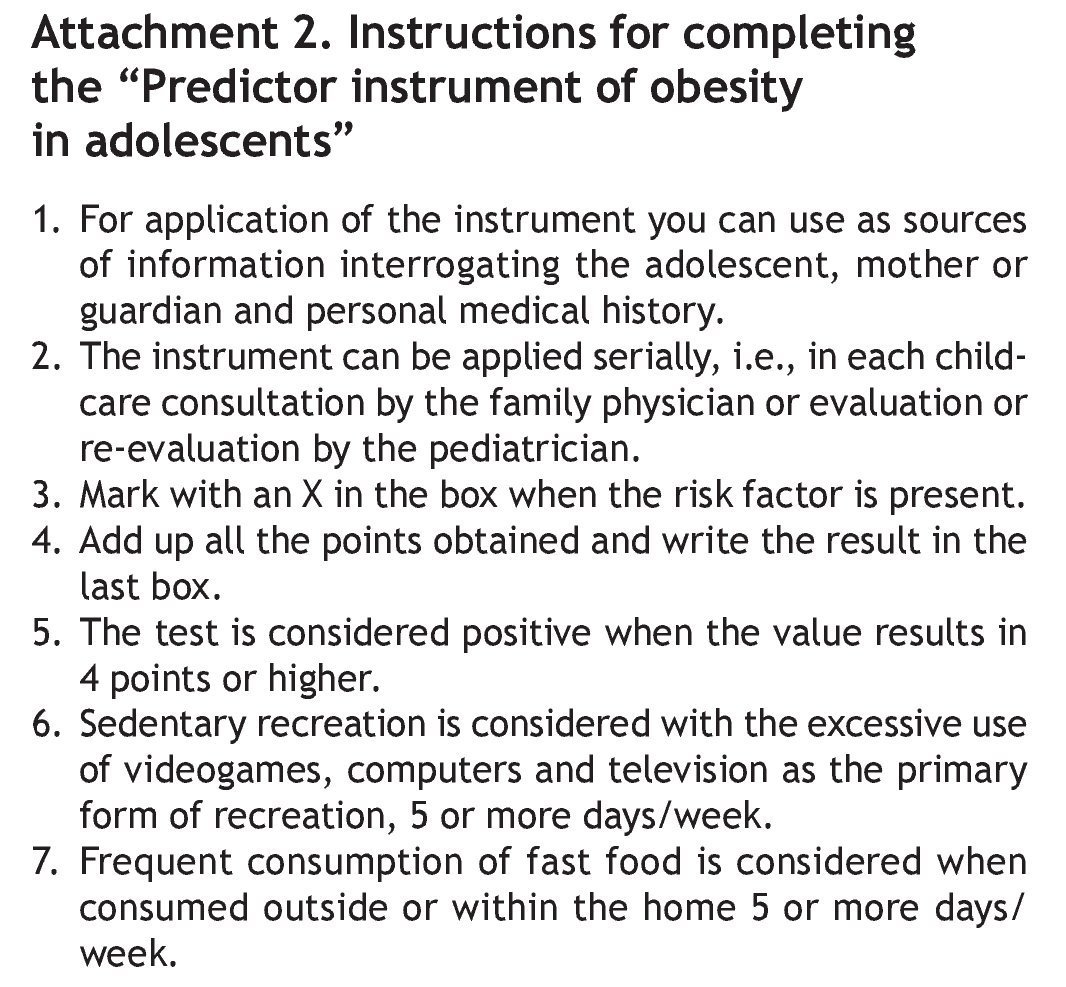
Attachment 2. Instructions for completing the “Predictor instrument of obesity in adolescents”
Attachment 3. Informed consent for families of children participating in the project entitled Predictor Instrument of Obesity in Adolescents
I have been invited for my family to participate in research that aims to develop a predictor instrument of obesity in adolescents, allowing the realization of promotion and health prevention. I understand that the purpose is to evaluate a group of clinical elements pertaining to my family for further analysis. I am aware that there may be no benefit to my family. I have had the opportunity to ask questions about the study and they have been answered to my satisfaction. I have been provided the name of an investigator who can easily be contacted if necessary. I have been guaranteed the confidentiality of data relating to my family.
Consent for my family to participate in this study is voluntary and I understand that I have the right to withdraw from the study at any time, without affecting any form of medical care.

http://dx.doi.org/10.1016/j.bmhimx.2015.03.002
Correspondence:
Dr. Carlos Enrique Piña Borrego
E-mail:lk9604@infomed.sld.cu