

Type 1 diabetes (T1D) usually occurs in the pediatric age and affects the growth of children. The aim of this work was to describe growth and growth failure associated factors in a population of children with T1D in a tertiary level pediatric hospital.
MethodsA case-control nested in a cohort study was conducted. We included patients with T1D under 16 years of age with a minimum follow-up of 12 months. Data as age at T1D diagnosis, anthropometry, glycated hemoglobin (HbA1c), as well as the pubertal development (Tanner stage) were collected at the time of diagnosis and during four years of follow-up. At the end of the follow-up, patients with and without growth failure were compared, and matched by sex and age at T1D diagnosis. Univariate and multivariate analyses were performed.
ResultsOn the first year of follow-up, 95 patients were gathered; 88 patients were still followed-up by the second year, 56 patients were kept for the third year, and 46 patients were still followed-up by the fourth year. Median age was 9.5 years, and 50% were preadolescents. During their evolution, 50% had growth failure. According to the multivariate analysis, the factor associated with growth failure was the HbA1c in the first year post-diagnosis (OR 4.08; 95% CI 1.34–12.42).
ConclusionsIn the first year post-diagnosis of children with T1D, HbA1c was associated with growth failure.
La diabetes mellitus tipo 1 (DM1) habitualmente se presenta en la etapa pediátrica y afecta el crecimiento de los niños. El objetivo de este trabajo fue describir el crecimiento y los factores asociados con la alteración del mismo en una población de niños con DM1 en un hospital pediátrico de tercer nivel.
MétodosSe realizó un estudio tipo casos y controles anidados en una cohorte. Se incluyeron pacientes con DM1 menores de 16 años con un seguimiento mínimo de 12 meses. Se recabaron datos como la edad al diagnóstico de la DM1, antropometría, hemoglobina glucosilada (HbA1c), así como el desarrollo puberal (estadios de desarrollo de Tanner) al diagnóstico y durante 4 años de seguimiento. Al finalizar el seguimiento, se identificaron pacientes con alteraciones del crecimiento y se compararon con pacientes con un crecimiento adecuado, pareados por sexo y edad al diagnóstico. Se realizó el análisis univariado y multivariado.
ResultadosAl primer año de seguimiento se identificaron 95 pacientes, a los 2 años 88 pacientes, a los 3 años 56 pacientes y a los 4 años 46 pacientes. La mediana para la edad fue de 9.5 años y el 50% eran prepúberes. El 50% de los pacientes tuvieron alteración en el crecimiento durante su evolución. De acuerdo con el análisis multivariado, se identificó que una mayor concentración de HbA1c en el primer año de seguimiento se relacionó con la alteración en el crecimiento (OR 4.08; IC 95% 1.34–12.42).
ConclusionesEn pacientes pediátricos con DM1, una mayor concertación HbA1c en el primer año posterior al diagnóstico parece relacionarse con alteración en el crecimiento.
Type 1 diabetes (T1D) is a chronic disease that usually appears in the pediatric age, whose proper management avoids short- and long-term complications.1 The growth of children affected with T1D depends on the metabolic control, duration, and age of onset of the disease.2 A loss of height throughout the evolution of the disease has been observed, and it has been demonstrated that children show a lower stature in adulthood.3–7 When the onset of the T1D is diagnosed in prepubescent stages, and patients have a persistent poor glycemic control,4,5,8 the latter is associated with a decrease in growth and, consequently, a loss in final adult height.9,10
Linear growth depends on type I and II insulin-like growth factor (IGF), their receptors and high-affinity binding proteins (IGFBP-1 to IGFBP-6). Specifically, in children with uncontrolled T1D, IGFs and IGFBPs may be observed at their lower levels.11 With the improvement of the glycemic control the levels of IGF-I increase, producing a compensatory acceleration of growth.12–14
Brown et al. analyzed the growth of 184 patients with T1D and compared it with the growth of healthy children of the same age.15 The final height average was 1.09 inches lower in diabetic children in comparison with healthy children. Particularly, those patients with an age of onset of T1D between 5 and 10 years had a greater loss of stature in comparison with healthy children.
In the past decade, studies reported growth disorders in diabetic patients with high serum concentrations of glycated hemoglobin (HbA1c).16,17 However, the management of T1D has improved with time, and it manifests as a healthier growth and development in these patients. Currently, the growth of patients with T1D has been evaluated through the final height11–18 without performing an annual growth rate analysis, which could help to minimize the alterations of growth during their evolution.
The aim of this study was to describe the growth in children with T1D attending a tertiary level hospital, as well as to identify the factors that might be associated with growth alteration.
2MethodsA study of cases and controls nested in a cohort of Mexican children with a diagnosis of T1D was conducted. Patients were included in the cohort at the time of T1D diagnosis. Patients with an early diagnosis of T1D (≤ 3 months of diagnosis), ≤ 16 years of age, and a minimum 12-month follow-up were included. Patients with complete pubertal development (TannerV and females with stage IV), and those with pathological stature (Z-score ≤ −2) by other endocrinopathies, genetic syndromes, other uncontrolled chronic disease or low idiopathic size were excluded from the study.
All the information was gathered from the medical records. Data such as age, weight, height, pubertal stage, and the presence of other chronic diseases, Z-score (zs) of final adult height, as well as HbA1c levels obtained at the time of diagnosis and those recorded annually during the follow-up of the patients were collected.
Height and weight measurements were carried out using a stadiometer (Seca), and a scale, respectively. Serum HbA1c determination was processed with the turbidimetric immunoassay technique through the commercial kit HbA1c II Tina-quant®. The cut-off point for defining the glycemic control in children was HbA1c > 7.5%, according to the American Diabetes Association (ADA) recommendations in 2016.19
The beginning of treatment and a proper control were identified in subjects in which the presence of another chronic disease was documented in the medical record during the monitoring of the T1D. All patients included in the study had an intensive insulin scheme (three or more applications of insulin per day).
Nutritional status was evaluated through the body mass index Z-score (BMI zs) and height Z-score (height zs). The percentile (PC) of annual growth rate (GR) was calculated according to age and gender charts.20 Patients were classified with growth alterations when GR was ≤ 25 PC.
Only patients who completed four years of follow-up were considered for the analysis of factors related to growth alteration. The cases were those who annually had a GR with a PC ≤ 25, while controls were selected considering individual case characteristics (i.e., they were matched by gender and age at T1D diagnosis to reduce the variables).
Before the beginning of the study, local Committees of Research and Ethics in Health from the Hospital Infantil de Mexico Federico Gomez evaluated and approved this protocol.
2.1Statistical analysisData are presented as absolute frequencies and percentages. Quantitative variables are presented as median, minimum and maximum values because they did not present a normal distribution. The comparison between groups was performed with χ2 or Fisher's exact test for the qualitative variables. Mann–Whitney U test was used for the comparison of quantitative variables.
To identify if glycemic control or HbA1c values were independent variables related to the alteration of growth, a logistic regression model was designed, where possible confusion variables were included. Values of p<0.05 were considered statistically significant. All analyses were performed with the statistical software SPSS version 17.0 (IBM).
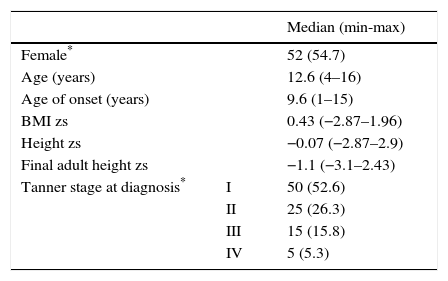
3ResultsFrom 2000 to 2013, a total of 123 patients with T1D attended the Pediatric Endocrinology service. Twenty-eight patients were excluded from the study: four with T2D confirmed during their evolution, and three with diabetes mellitus type MODY. Two more with Wolfram syndrome; two patients who already had pathological low-height when T1D was diagnosed (height zs −3.23 and −2.52). Three with full pubertal development and 14 patients because their medical records were incomplete. Therefore, 95 patients were included in the study. General data are shown in Table 1, where a slightly higher proportion of females (54.7%) and a median for the age of T1D onset of 9.6 years are observed, although 34 patients (35.8%) were > 10 years of age. It is appropriate to consider that the median final adult height zs of the patients was similar to the height zs at the beginning of the cohort.
General information of the cohort of 95 patients with type 1 diabetes at the beginning of the follow-up.
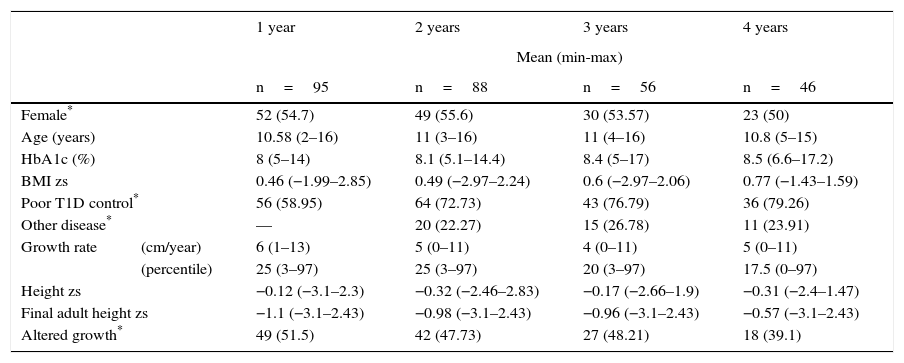
At the time of the analysis, 95 patients had been followed-up for a year, 88 patients for two years, 56 patients over three years, and 46 patients for four years. After the first year of follow-up, the median GR was 6cm/year (min 1cm, max 13cm), and 51.5% of patients (n=49) were identified with an alteration in growth. After a two-year follow-up, the median GR was 5cm/year, and 42 patients presented an alteration in growth (47.7%). In 56 patients with three-year follow-up, there was a decrease in the GR since the median was 4cm/year (min 0cm, max 11cm), which is equivalent to the PC 20 (min 3, max 97) (Table 2). HbA1c levels were observed during the time of monitoring, with a median of 8% (min 5%, max 14%) per year, and uncontrolled blood glucose in 56% of cases. For two years of follow-up, the median of HbA1c was 8.1% (min 5.1%, max 14.4%)—slightly higher than the previous year, reflecting an increase of patients with uncontrolled blood glucose (64%). In the third and fourth years of follow-up, the median of HbA1c was 8.4% and 8.5%, with a proportion of patients with an uncontrolled blood glucose of 43% and 36%, respectively (Table 2).
General data of patients with type 1diabetes during the follow-up.
| 1 year | 2 years | 3 years | 4 years | ||
|---|---|---|---|---|---|
| Mean (min-max) | |||||
| n=95 | n=88 | n=56 | n=46 | ||
| Female* | 52 (54.7) | 49 (55.6) | 30 (53.57) | 23 (50) | |
| Age (years) | 10.58 (2–16) | 11 (3–16) | 11 (4–16) | 10.8 (5–15) | |
| HbA1c (%) | 8 (5–14) | 8.1 (5.1–14.4) | 8.4 (5–17) | 8.5 (6.6–17.2) | |
| BMI zs | 0.46 (−1.99–2.85) | 0.49 (−2.97–2.24) | 0.6 (−2.97–2.06) | 0.77 (−1.43–1.59) | |
| Poor T1D control* | 56 (58.95) | 64 (72.73) | 43 (76.79) | 36 (79.26) | |
| Other disease* | — | 20 (22.27) | 15 (26.78) | 11 (23.91) | |
| Growth rate | (cm/year) | 6 (1–13) | 5 (0–11) | 4 (0–11) | 5 (0–11) |
| (percentile) | 25 (3–97) | 25 (3–97) | 20 (3–97) | 17.5 (0–97) | |
| Height zs | −0.12 (−3.1–2.3) | −0.32 (−2.46–2.83) | −0.17 (−2.66–1.9) | −0.31 (−2.4–1.47) | |
| Final adult height zs | −1.1 (−3.1–2.43) | −0.98 (−3.1–2.43) | −0.96 (−3.1–2.43) | −0.57 (−3.1–2.43) | |
| Altered growth* | 49 (51.5) | 42 (47.73) | 27 (48.21) | 18 (39.1) | |
Twenty patients who presented another chronic disease during the follow-up were identified. The most frequent disease was primary autoimmune hypothyroidism (nine patients), followed by anxiety or depression (six patients). The rest of the diseases were epilepsy, constipation, central precocious puberty and diffuse toxic goiter.
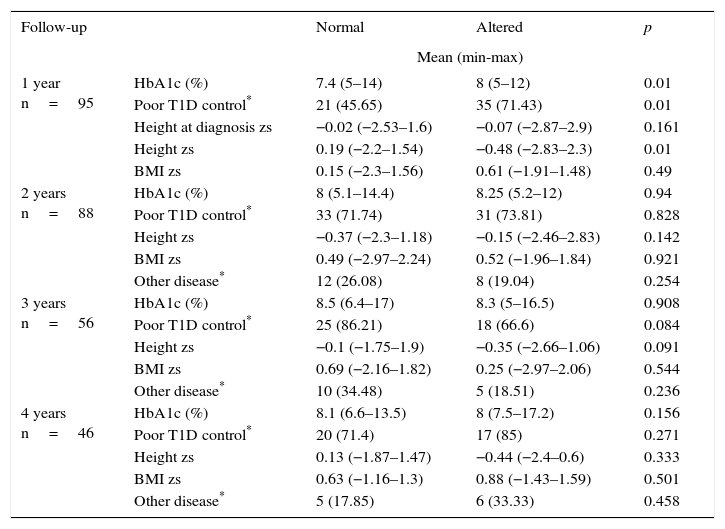
During the first year of follow-up, a significant difference was observed between HbA1c and poor glycemic control during the first year after diagnosis. The percentages were lower in the group of patients with no growth alterations compared with those with growth alterations (median 7.4% vs. 8% and 45.65% vs. 71.43%, respectively). This result was related to a minor height zs only in the first year of follow-up of patients with altered growth (Table 3).
Four-year follow-up comparison between T1D patients with normal and altered growth.
| Follow-up | Normal | Altered | p | |
|---|---|---|---|---|
| Mean (min-max) | ||||
| 1 year n=95 | HbA1c (%) | 7.4 (5–14) | 8 (5–12) | 0.01 |
| Poor T1D control* | 21 (45.65) | 35 (71.43) | 0.01 | |
| Height at diagnosis zs | −0.02 (−2.53–1.6) | −0.07 (−2.87–2.9) | 0.161 | |
| Height zs | 0.19 (−2.2–1.54) | −0.48 (−2.83–2.3) | 0.01 | |
| BMI zs | 0.15 (−2.3–1.56) | 0.61 (−1.91–1.48) | 0.49 | |
| 2 years n=88 | HbA1c (%) | 8 (5.1–14.4) | 8.25 (5.2–12) | 0.94 |
| Poor T1D control* | 33 (71.74) | 31 (73.81) | 0.828 | |
| Height zs | −0.37 (−2.3–1.18) | −0.15 (−2.46–2.83) | 0.142 | |
| BMI zs | 0.49 (−2.97–2.24) | 0.52 (−1.96–1.84) | 0.921 | |
| Other disease* | 12 (26.08) | 8 (19.04) | 0.254 | |
| 3 years n=56 | HbA1c (%) | 8.5 (6.4–17) | 8.3 (5–16.5) | 0.908 |
| Poor T1D control* | 25 (86.21) | 18 (66.6) | 0.084 | |
| Height zs | −0.1 (−1.75–1.9) | −0.35 (−2.66–1.06) | 0.091 | |
| BMI zs | 0.69 (−2.16–1.82) | 0.25 (−2.97–2.06) | 0.544 | |
| Other disease* | 10 (34.48) | 5 (18.51) | 0.236 | |
| 4 years n=46 | HbA1c (%) | 8.1 (6.6–13.5) | 8 (7.5–17.2) | 0.156 |
| Poor T1D control* | 20 (71.4) | 17 (85) | 0.271 | |
| Height zs | 0.13 (−1.87–1.47) | −0.44 (−2.4–0.6) | 0.333 | |
| BMI zs | 0.63 (−1.16–1.3) | 0.88 (−1.43–1.59) | 0.501 | |
| Other disease* | 5 (17.85) | 6 (33.33) | 0.458 | |
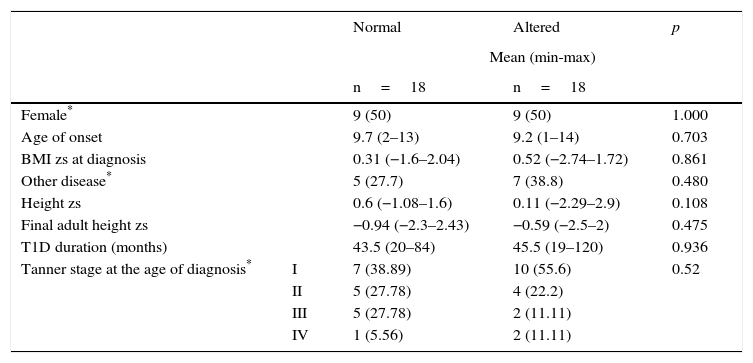
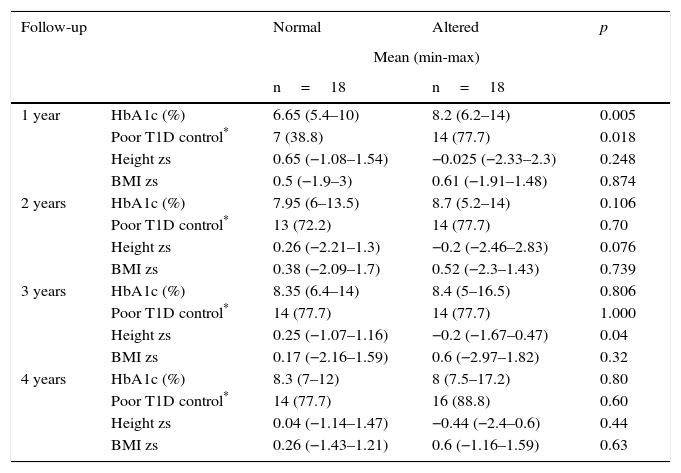
From 46 patients who had a four-year follow-up, 18 cases were presented with alteration in growth. From the remaining 28 patients, 18 children with similar age and sex were selected as controls. Table 4 shows the distribution of the variables (sex, age, and BMI zs at the time of diagnosis, the presence of another chronic disease, height zs, final adult height zs, T1D duration and Tanner stage). The results were similar between cases and controls. When comparing the variables HbA1c, poor T1D control, height zs and annual BMI zs, a statistically significant difference was demonstrated in HbA1c and poor T1D control only in the first year of follow-up (median 6.65% vs. 8.2% and 38.8% vs. 77.7%, respectively) (Table 5).
Four-year follow-up comparison of variables between T1D patients with normal and altered growth.
| Normal | Altered | p | ||
|---|---|---|---|---|
| Mean (min-max) | ||||
| n=18 | n=18 | |||
| Female* | 9 (50) | 9 (50) | 1.000 | |
| Age of onset | 9.7 (2–13) | 9.2 (1–14) | 0.703 | |
| BMI zs at diagnosis | 0.31 (−1.6–2.04) | 0.52 (−2.74–1.72) | 0.861 | |
| Other disease* | 5 (27.7) | 7 (38.8) | 0.480 | |
| Height zs | 0.6 (−1.08–1.6) | 0.11 (−2.29–2.9) | 0.108 | |
| Final adult height zs | −0.94 (−2.3–2.43) | −0.59 (−2.5–2) | 0.475 | |
| T1D duration (months) | 43.5 (20–84) | 45.5 (19–120) | 0.936 | |
| Tanner stage at the age of diagnosis* | I | 7 (38.89) | 10 (55.6) | 0.52 |
| II | 5 (27.78) | 4 (22.2) | ||
| III | 5 (27.78) | 2 (11.11) | ||
| IV | 1 (5.56) | 2 (11.11) | ||
Four-year follow-up comparison of patients with normal and altered growth.
| Follow-up | Normal | Altered | p | |
|---|---|---|---|---|
| Mean (min-max) | ||||
| n=18 | n=18 | |||
| 1 year | HbA1c (%) | 6.65 (5.4–10) | 8.2 (6.2–14) | 0.005 |
| Poor T1D control* | 7 (38.8) | 14 (77.7) | 0.018 | |
| Height zs | 0.65 (−1.08–1.54) | −0.025 (−2.33–2.3) | 0.248 | |
| BMI zs | 0.5 (−1.9–3) | 0.61 (−1.91–1.48) | 0.874 | |
| 2 years | HbA1c (%) | 7.95 (6–13.5) | 8.7 (5.2–14) | 0.106 |
| Poor T1D control* | 13 (72.2) | 14 (77.7) | 0.70 | |
| Height zs | 0.26 (−2.21–1.3) | −0.2 (−2.46–2.83) | 0.076 | |
| BMI zs | 0.38 (−2.09–1.7) | 0.52 (−2.3–1.43) | 0.739 | |
| 3 years | HbA1c (%) | 8.35 (6.4–14) | 8.4 (5–16.5) | 0.806 |
| Poor T1D control* | 14 (77.7) | 14 (77.7) | 1.000 | |
| Height zs | 0.25 (−1.07–1.16) | −0.2 (−1.67–0.47) | 0.04 | |
| BMI zs | 0.17 (−2.16–1.59) | 0.6 (−2.97–1.82) | 0.32 | |
| 4 years | HbA1c (%) | 8.3 (7–12) | 8 (7.5–17.2) | 0.80 |
| Poor T1D control* | 14 (77.7) | 16 (88.8) | 0.60 | |
| Height zs | 0.04 (−1.14–1.47) | −0.44 (−2.4–0.6) | 0.44 | |
| BMI zs | 0.26 (−1.43–1.21) | 0.6 (−1.16–1.59) | 0.63 | |
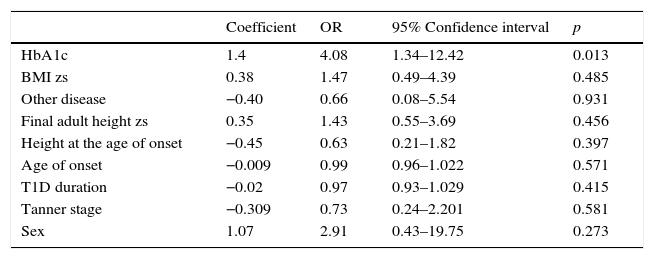
A multivariate analysis was performed to identify whether the alteration in growth could be dependent on the presence of other disease or nutritional status (BMI zs) at diagnosis and one-year of follow-up, or to other variables, such as sex, final adult height zs, age of onset, T1D duration, and Tanner stage, besides HbA1c in the first year of evolution. However, the model persisted with statistical significance only for the serum concentration of HbA1c in the first year after diagnosis (OR 4.08; 95% CI 1.34–12.42, p=0.013) (Table 6).
The logistic regression for the alteration of growth in 36 patients with TD1 after a year of diagnosis.
| Coefficient | OR | 95% Confidence interval | p | |
|---|---|---|---|---|
| HbA1c | 1.4 | 4.08 | 1.34–12.42 | 0.013 |
| BMI zs | 0.38 | 1.47 | 0.49–4.39 | 0.485 |
| Other disease | −0.40 | 0.66 | 0.08–5.54 | 0.931 |
| Final adult height zs | 0.35 | 1.43 | 0.55–3.69 | 0.456 |
| Height at the age of onset | −0.45 | 0.63 | 0.21–1.82 | 0.397 |
| Age of onset | −0.009 | 0.99 | 0.96–1.022 | 0.571 |
| T1D duration | −0.02 | 0.97 | 0.93–1.029 | 0.415 |
| Tanner stage | −0.309 | 0.73 | 0.24–2.201 | 0.581 |
| Sex | 1.07 | 2.91 | 0.43–19.75 | 0.273 |
HbA1c, glycated hemoglobin; BMI, body mass index; zs, Z-score; T1D, type 1 diabetes.
A second model, where serum concentration of HbA1c was replaced with poor glycemic control during the first year was conducted. Consistent with the first model, poor glycemic control persisted statistically significant (OR 7.91; IC 95% 1.14–54.55, p=0.036).
4DiscussionT1D is one of the most common chronic diseases in childhood and adolescence. In this study, 50% of the patients were in the prepubertal stage, and only 5% had reached a Tanner stage IV. Hence, the vast majority of patients were still in longitudinal growth at the time of diagnosis of this pathology. Therefore, it is fundamental to the pediatrician to identify the factors that modify the growth in this group of patients.
The factors that determine and regulate the growth in pediatric age, including diabetic patients, are the nutritional status, an adequate control of the chronic disease and the environmental conditions. The best way to identify any growth alteration is through the annual growth rate. In this study, by using this indicator, it was observed that nearly 50% of the patients showed impaired growth at some point in their evolution. Some studies present results similar to this study. However, other authors did not measure the growth rate; furthermore, they only measured the final adult height. In addition, they found that the serum concentrations of HbA1c under 8% were related to an appropriate longitudinal growth.15 In a German population study18, it was observed that patients with a HbA1c < 7% had a normal final height, unlike those with an HbA1c > 8% who lost up to 0.34 standard deviation of the population mean. These results support the findings of this study, where a minimal difference in the percentage of HbA1c (6.65% in the normal growth vs. 8.2% in the altered growth) conditioned changes in the growth of the patients.
Multivariate analysis showed that the concentration of HbA1c or the poor glycemic control were factors with statistical significance for the alteration of growth. These findings are similar to the multivariate analysis described by Choudhury and Stutchfield.6
Some studies have shown that the first year after T1D diagnosis is essential to the acceptance and adaptation of the patients and their relatives to the disease. These studies also have described that those patients who adapt more quickly have a better prognosis.21,22 These results would explain the reason why a higher HbA1c concentration during the first year after diagnosis has a major impact on the growth of the patient in the following years. However, as the emotional characteristics of patients and their families were not evaluated, it is not possible to support this theory.
The findings of the present study should be weighted according to its limitations. As it was a retrospective study, it was not possible to establish if the patients already presented growth alterations at the time of the diagnosis since the evaluation of bone age is usually not included as part of the study of patients with T1D. On the other hand, having used the chronological age instead of the bone age to assess the growth rate and height of the patients may reflect an over-diagnosis of growth alteration. Patients with low pathologic stature were excluded to avoid this problem. Another limitation of the study was the follow-up, which was not enough to analyze the final height of the patients and compare it with the final adult height. Also, another limitation was a limited sample size. Further research must be continued and expanded with the determination of IGF-123 which, in addition to anthropometric measurements, is a more precise parameter for growth evaluation. Moreover, the determination of the C-peptide since it has been observed that the residual mass of beta cells relates directly to the growth in T1D prepubertal patients.24
In conclusion, in this study, an altered growth was identified in approximately half of patients with T1D during their follow-up. During the first year after T1D diagnosis, HbA1c seems to relate with growth alterations, regardless of the sex, age of onset, Tanner stage, time of evolution, nutritional state and the presence of another chronic disease.
Therefore, a strict glycemic control is recommended, not only to prevent chronic complications but also an altered growth that would condition a loss of centimeters in the final adult height.
Ethical disclosuresProtection of human and animal subjectsThe authors declare that no experiments were performed on humans or animals for this study.
Confidentiality of dataThe authors declare that they have followed the protocols of their work center on the publication of patient data.
Right to privacy and informed consentThe authors have obtained the written informed consent of the patients or subjects mentioned in the article. The corresponding author is in possession of this document.
Conflict of interestThe authors declare no conflicts of interest of any nature.
Please cite this article as: Zurita-Cruz JN, Dosta-Martínez GE, Villasís-Keever MA, Rivera-Hernández AdJ, Garrido-Magaña E, Nishimura-Meguro E. Pacientes pediátricos con diabetes tipo 1: crecimiento y factores asociados con su alteración. Bol Med Hosp Infant Mex. 2016;73:174–180.