


Introducción: Durante la niñez es fundamental el desarrollo de prácticas saludables que definan buenos hábitos que perdurarán a lo largo de la vida. El objetivo de este estudio fue identificar las preferencias alimentarias y su variación de acuerdo con el estado nutricional de niños escolares en la Ciudad de México.
Métodos: Se realizó un estudio transversal que incluyó a 1,456 niños escolares de 8 escuelas públicas en la Ciudad de México. Los niños respondieron un cuestionario sobre sus preferencias de 70 alimentos seleccionados, y se les realizó antropometría; los padres proporcionaron información sociodemográfica de la familia. Se evaluaron las preferencias de cada alimento con escala tipo Likert y se calcularon las frecuencias para el total de niños y por nivel nutricional.
Resultados: La mediana de edad de los niños fue de 9 años. El 48.6% tuvo sobrepeso u obesidad. Los alimentos con mayor preferencia fueron frutas, pizzas, leche con sabor y papas a la francesa. Los alimentos menos preferidos fueron verduras, cereales integrales, pescado, carnes y queso panela. El agua natural (72%) y las bebidas azucaradas (71%) tuvieron alta preferencia. No se encontraron variaciones en las preferencias con respecto al estado nutricional.
Conclusiones: El patrón de preferencias alimentarias de los niños escolares representa un riesgo para el consumo inadecuado de alimentos y para el aumento en la prevalencia de obesidad en esta población. Se requiere de intervenciones oportunas para promover un entorno alimentario saludable y que las preferencias nutricionales sean adecuadas desde edades tempranas.
Background: Childhood is a basic period for the development of habits and their continuation during the course of life. The objective of this study was to identify food preferences and their variations according to the nutritional status in school-age children living in Mexico City.
Methods: A cross-sectional study was carried out including 1,465 school-age children attending eight public elementary schools in Mexico City. Children were asked to complete a questionnaire regarding their preferences to 70 selected different foods. Anthropometric measurements were also carried out. Parents of the children provided sociodemographic information. For each food, the preference was evaluated using a Likert scale. Frequencies were calculated for the total sample and for different nutritional status levels.
Results: Median age of children was 9 years old. Forty-eight percent of the children were overweight or obese. The most preferred foods were fruits, pizzas, flavored milk, and French fries. The least preferred foods were vegetables, whole-grain cereals, fish, meat, and panela cheese. Plain water (72%) and sugar-sweetened beverages (71%) had a high level of preference. There was no preference variation according to nutritional status.
Conclusions: Food preference patterns of school-age children are a risk for unhealthy food consumption as well as for the increase in obesity prevalence in this population. Interventions focused on the promotion of a healthy food environment are necessary, aimed at improving food preferences from early childhood.
1. Introduction
Obesity, according to the World Health Organization (WHO), is the abnormal or excessive accumulation of fat that can be detrimental to health, with overweight being a condition prior to its development. The narrow relationship between both conditions has led to conditions being approached together.1
The prevalence of obesity in children has increased globally, affecting low- and middle-income countries, especially in the urban environment. It is estimated that, in the year 2013, worldwide there were 42 million children who were overweight, of whom ~31 million lived in developing countries.2 If recent trends continue it is estimated that in the year 2030 when these children are adults, 57.8% of the adult population will be overweight or obese worldwide, i.e., 3.3 million persons.3 In Mexico, the surveys on nutrition and health carried out 10 years ago show a growing prevalence for overweight and obesity. Globally, the country occupied first place for obesity in children. The National Survey on Nutrition of 2012 (ENSANUT) reported a prevalence of 19.8% for overweight and 14.6% for obesity in school-age children.4
Nutrition is, in large measure, the result of the environment and specific social milieu.5 Although food has biological roots, it represents an “interaction of environmental, cognitive, physiological and sociocultural influences.”6 In an individual, eating is a set of actions that establish an individual’s relationship with food. Eating behaviors are acquired through direct experience with food, imitation, food availability, income, affective symbolisms and cultural traditions.7
On the other hand, commercialization of products posing a risk for obesity from an advertising point of view, has as its main objective to influence preferences for certain foods, causing the intake of high-caloric foods mainly consumed by children.8 In this regard, it has been documented that it is fundamental to establish eating habits in childhood, which will potentially be established behaviors throughout life. Various authors reported that during childhood most habits and eating practices, preferences and aversions are established, which are strongly conditioned in the context of the family.6,9,10
This complex range of factors is of great importance to the nutritional status and is specific for each population context. This makes it necessary to widen the analysis on the food preferences of school-age children in order to gain an understanding of the problem of obesity and to establish the basis for strategic design for diminishing the problem. Therefore, the objective of the present study was to identify food preferences and their variations according to the nutritional status of school-age children in Mexico City.
2. Methods
A cross-sectional study was carried out in the year 2013, which included 8- to 11-year-old children enrolled in grades four to six of eight public elementary schools located in a low- to medium socioeconomic level neighborhood in Mexico City.
After verbal consent of the principals, teachers, and parents, and consent of the eligible children in selected schools, subjects were invited to answer a questionnaire about their food preferences. Anthropometric evaluation was also done. The questionnaire was administered and gathered on the school campus with the support of the research team. It included 70 foods or food products selected based on the tool “Frequency of food consumption” included in the Procedure Manual for Nutrition Projects developed in the INSP11– from the observations done in the school environment by the research group with respect to the available foods. To evaluate the food preferences, a Likert type scale was used with the categories of “I like it very much”, “I like it”, “I neither like it nor dislike it”, “I do not like it” and “It is disagreeable to me.”
In addition, sociodemographic data of the family were obtained using a questionnaire answered by the parents, which had previously been given to the school-age children to be completed at their homes. The collection of the completed questionnaires was done at each campus by the research team.
For the anthropomorphic evaluation, body weight was measured using a scale with a precision of 50 g (SECA model 803). Height was measured with a stadiometer with 1-mm accuracy (SECA model 217). Measurements were done by trained nutritionists according to the guidelines proposed by the WHO.12 WHO criteria were used to carry out the classification of the nutritional status (low weight: Z score <−2 SD; normal weight: Z score −2 up to +1 SD; overweight: Z score +1 up to +2 SD; obesity: >+2 SD).13
Data analysis of the questionnaires was performed using absolute and relative frequencies of each food in the five preference categories for the total of children and nutritional status (normal, low weight, overweight and obesity).
3. Results
There were 1,456 children evaluated of whom 731 (50.2%) were males and 725 (49.8%) females. The median age of the children was 9 years (minimum 8 years, maximum 11 years); 19.4% of the children were 8 years of age, 32.8% were 9 years of age, 32.1% 10 years of age and 15.7% were 11 years old.
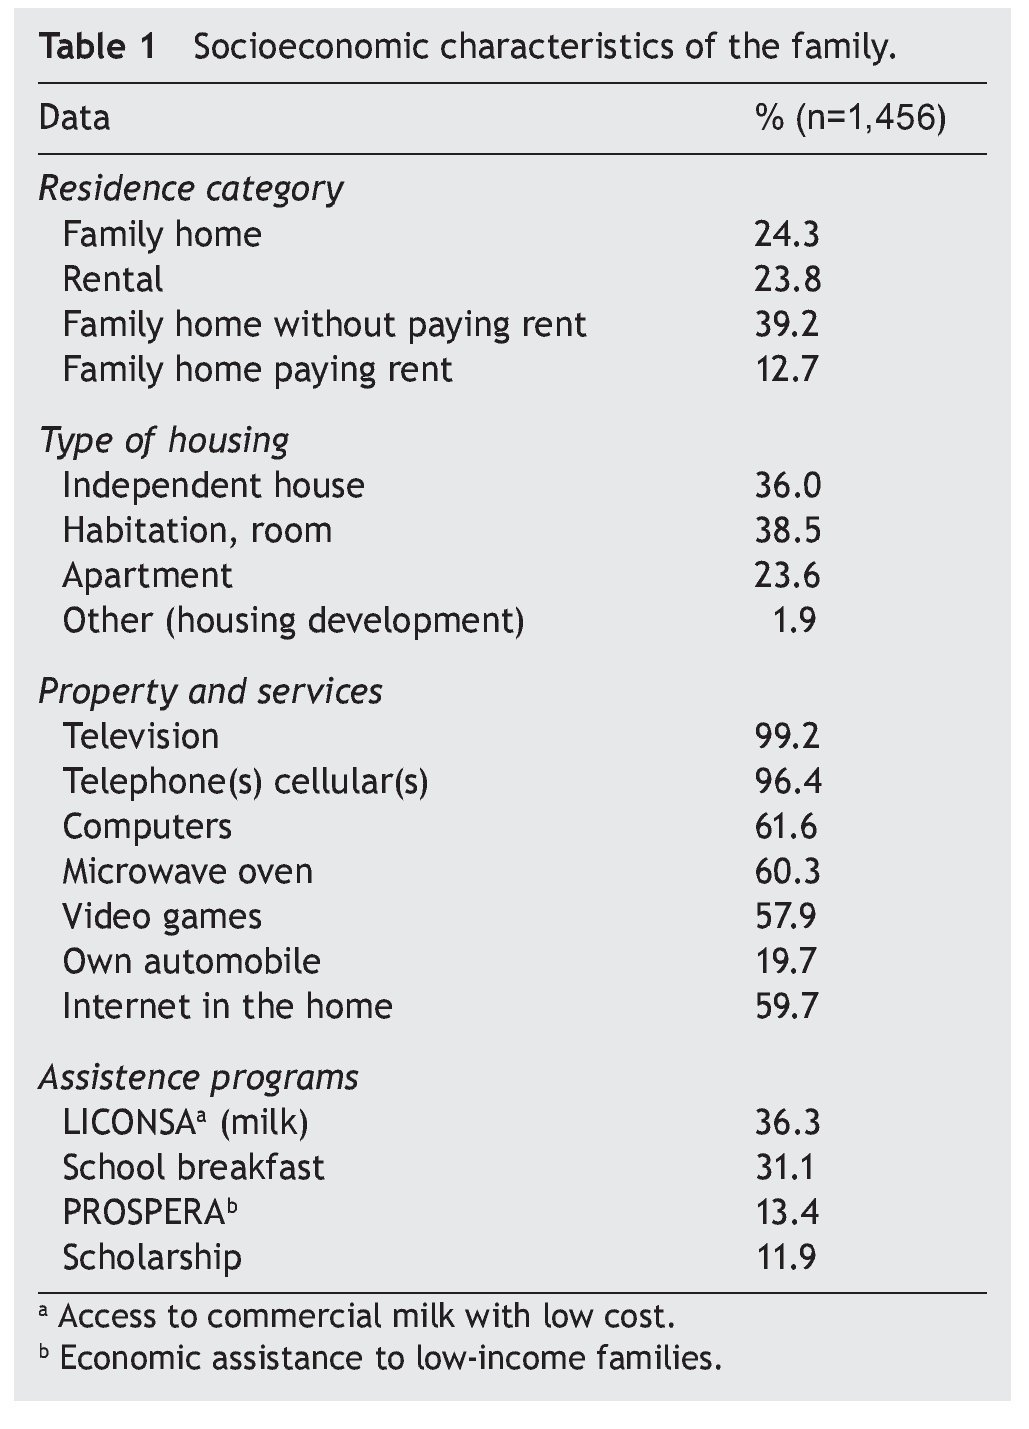
Socioeconomic characteristics of the families are shown in Table 1. It is notable that 50% lived in a relative’s home, the majority without paying rent, and more than a third had only one room. With regard to goods and services, ownership of electronics was common (computers and video games), as well as internet in the home. Only one in every five families reported owning their own vehicle. With respect to programs for nutritional assistance or economic support, at least a third of the families received some type of nutritional support and little more than 10% had a scholarship to help with food costs.
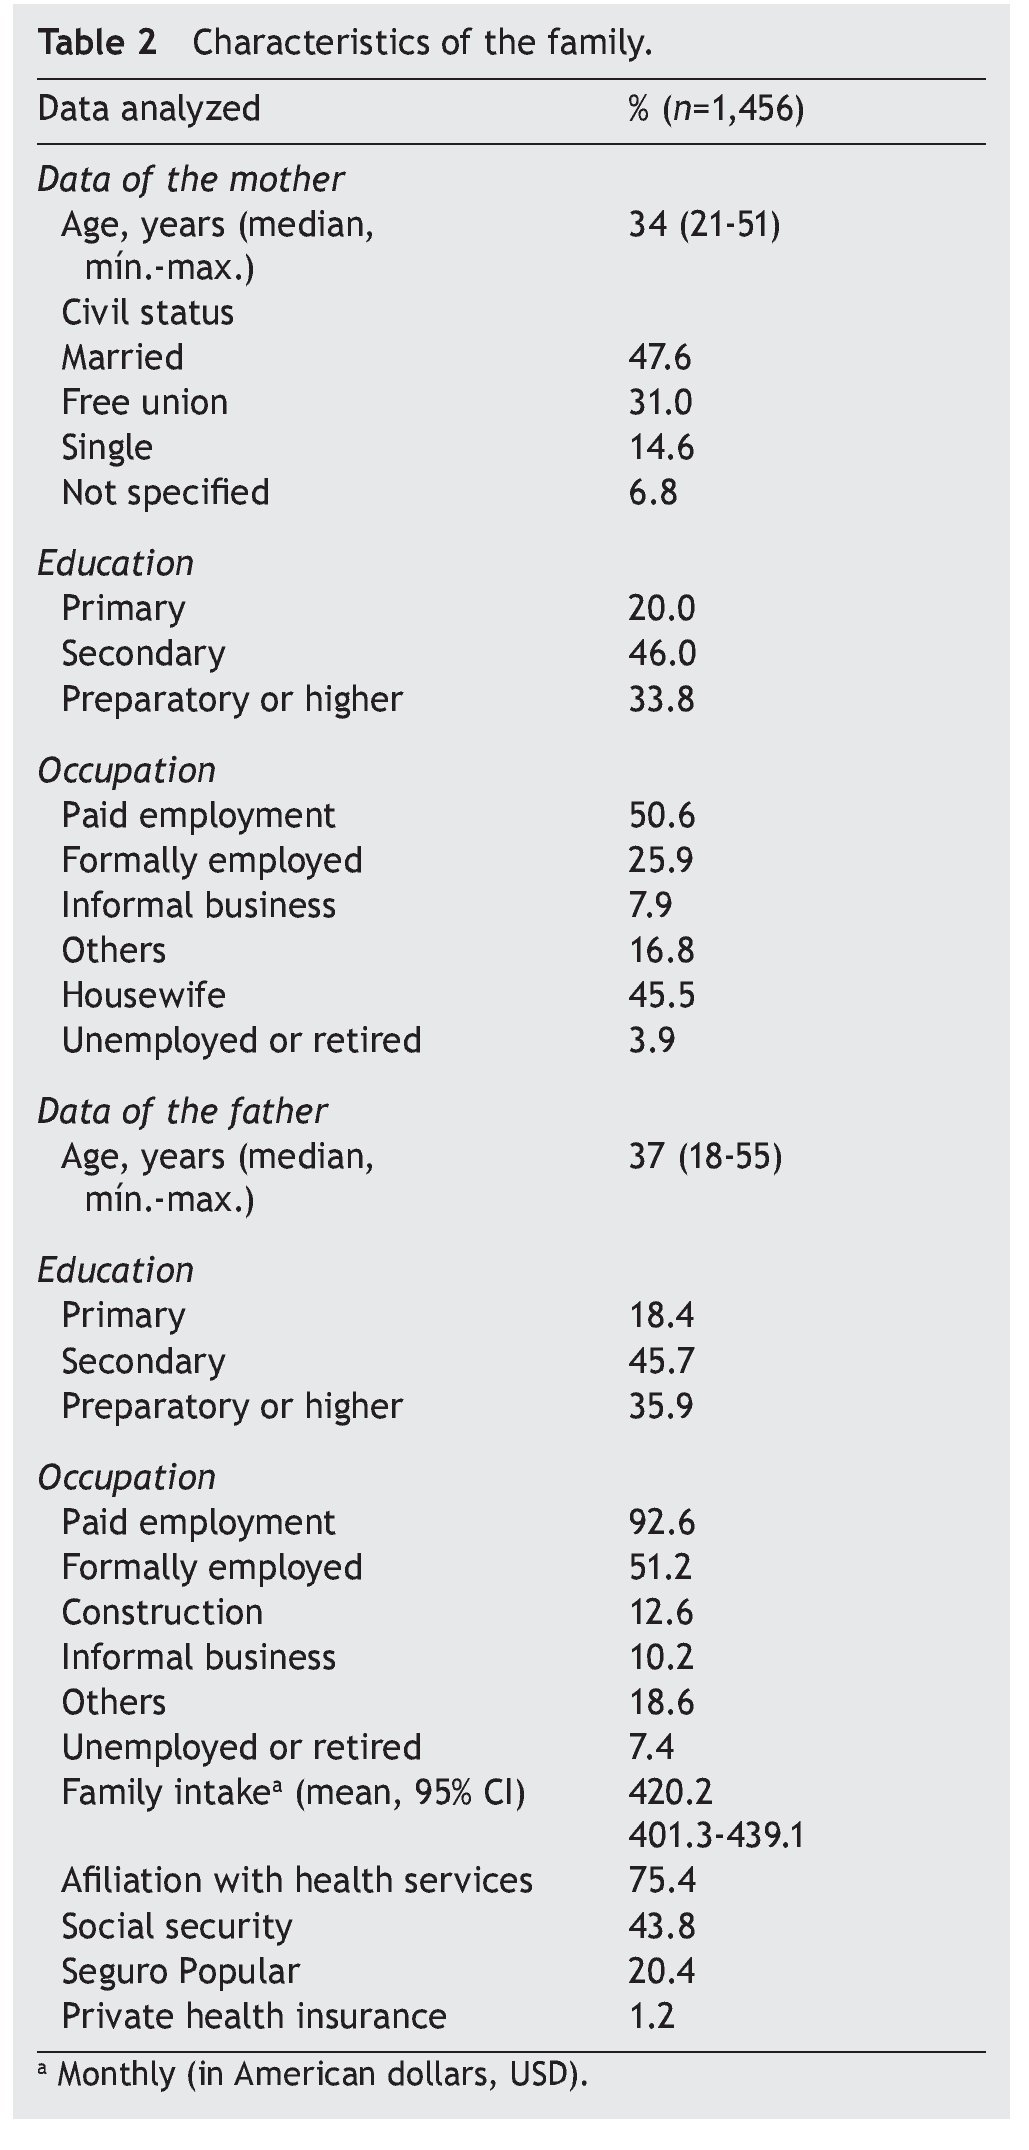
The families were comprised of young parents with a median age of 34 years for the mother and 37 years for the father, although some of the caretakers or responsible members were grandparents; 15% of households were headed by single mothers and in ~20% both parents reported primary education. Half of the mothers had paid employment and the remainder were housewives, whereas >90% of the fathers had paid employment. More than half had formal employment. The mean income for the families of the school-age children was $5364.30 pesos monthly (95% CI=5,122.71-5,605.96), and 75% of the families were affiliated with a social security system or had some type of health insurance coverage (Table 2).
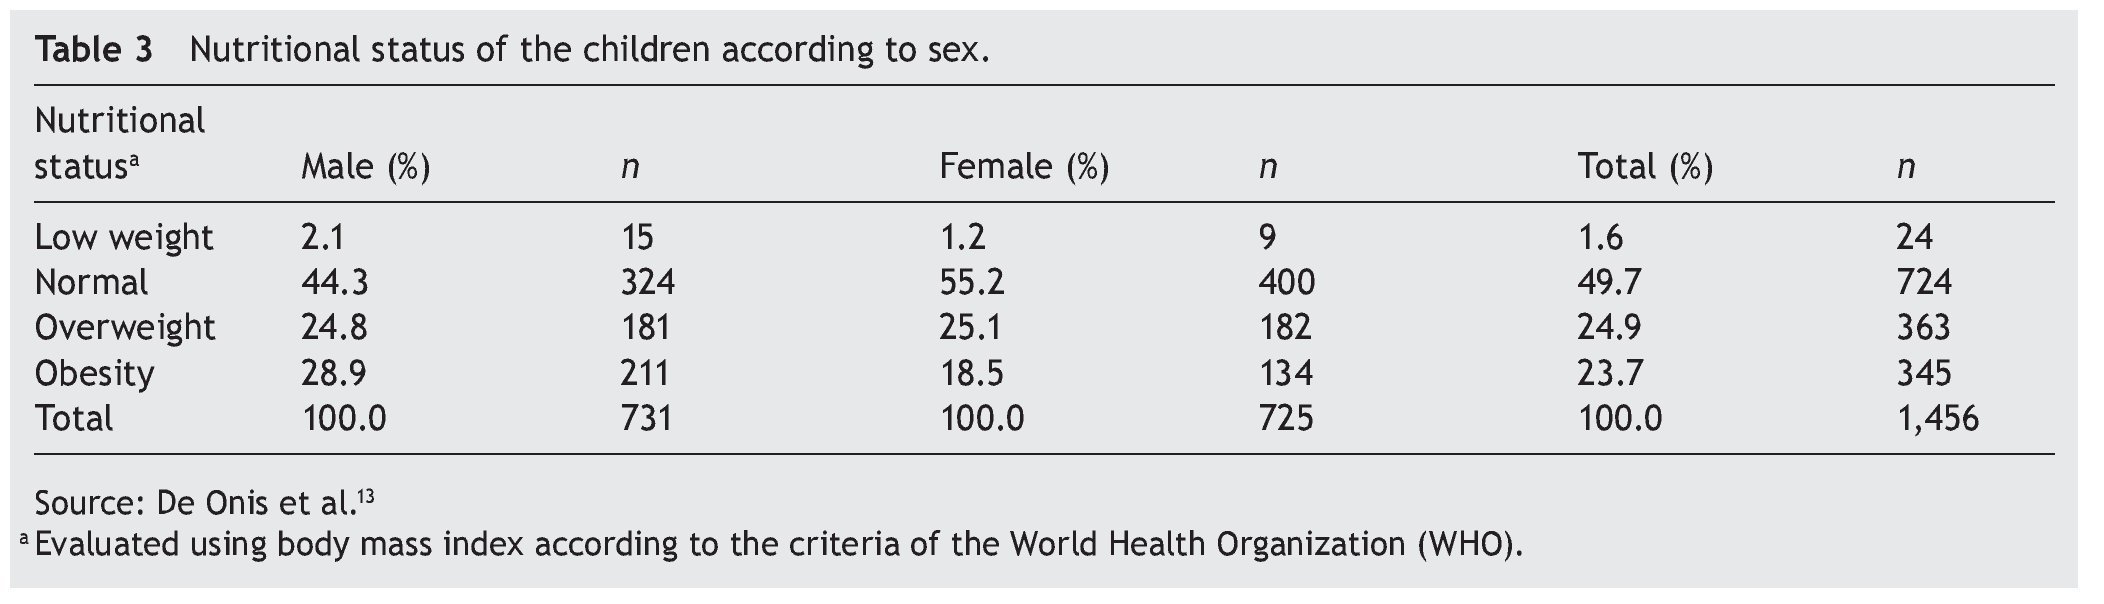
Of the total number of school-age children diagnosed using the BMI Z-score for age, 49.7% had a normal diagnosis and 48.6% were diagnosed with excess body weight for age and height (24.9% overweight and 23.7% obesity). Only 1.6% of the school-age children were diagnosed as being underweight. Table 3 shows the distribution of the nutritional status by gender; 44.3% of the children were diagnosed as normal, 53.7% had excess body weight for age and height, and 2.1% of the children were diagnosed as being underweight. With respect to the girls, 55.2% were of normal weight and 43.6% had excess body weight; 1.2% of the girls were evaluated to be underweight.

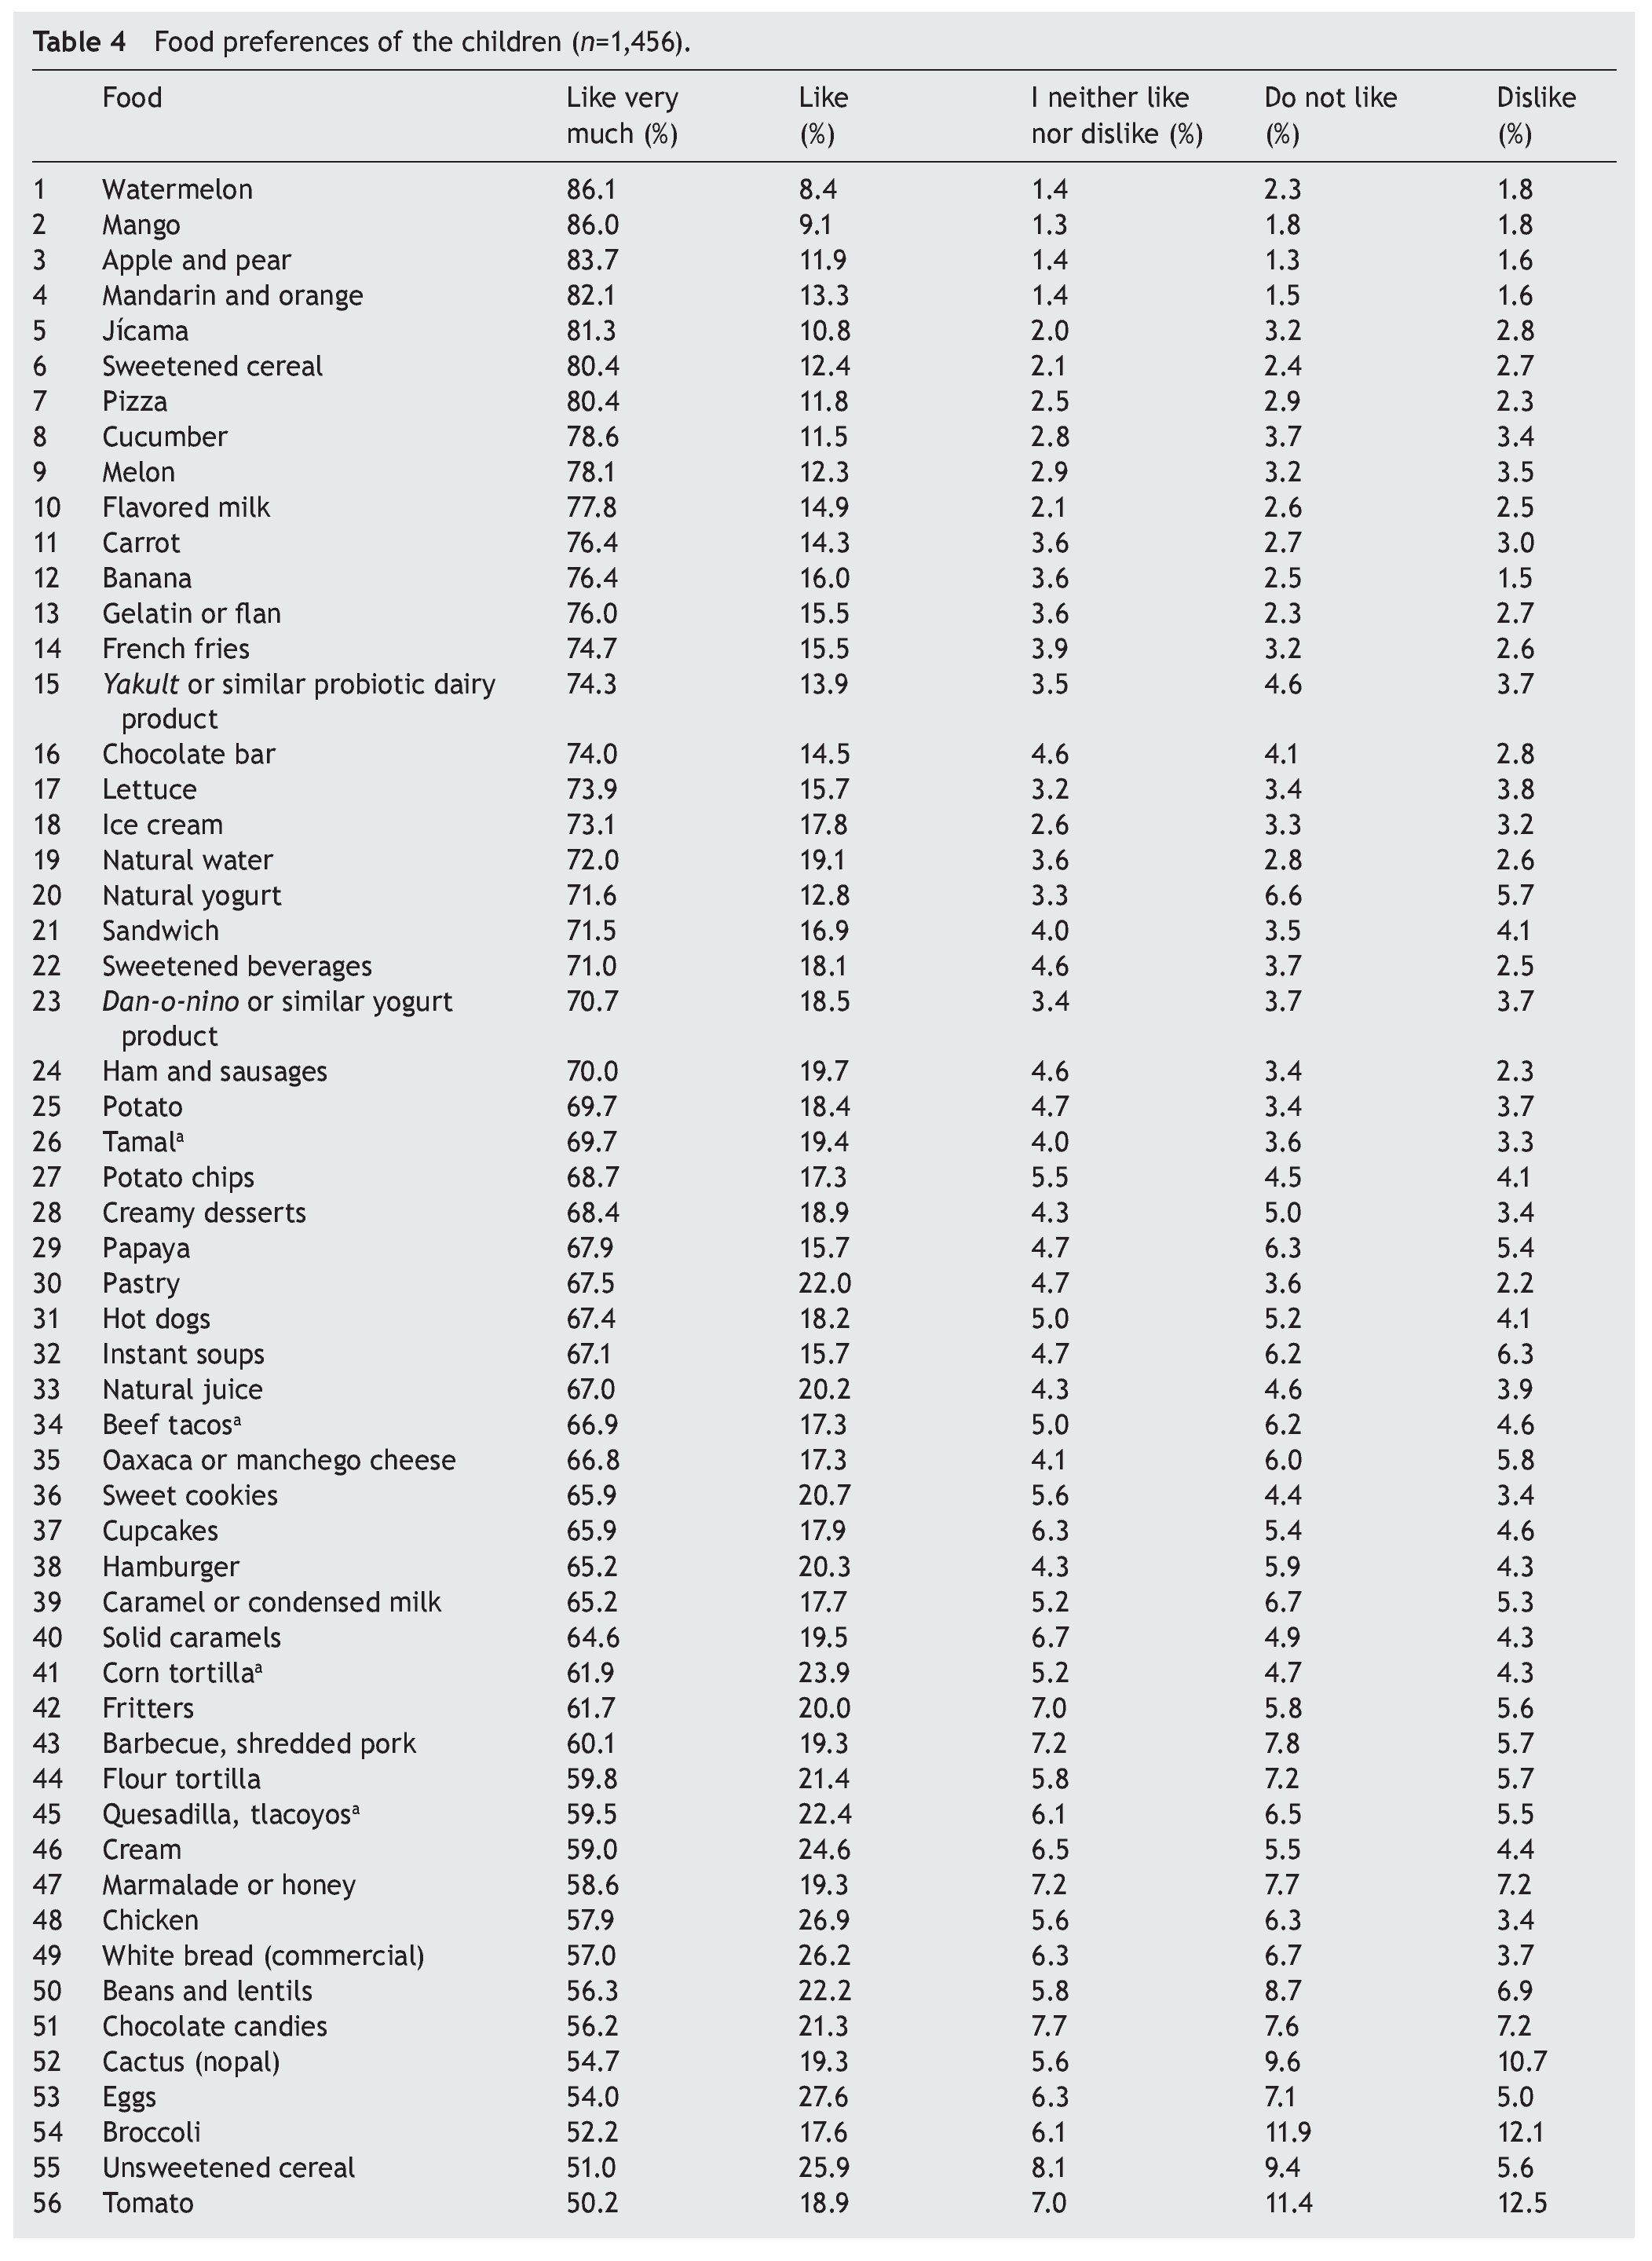
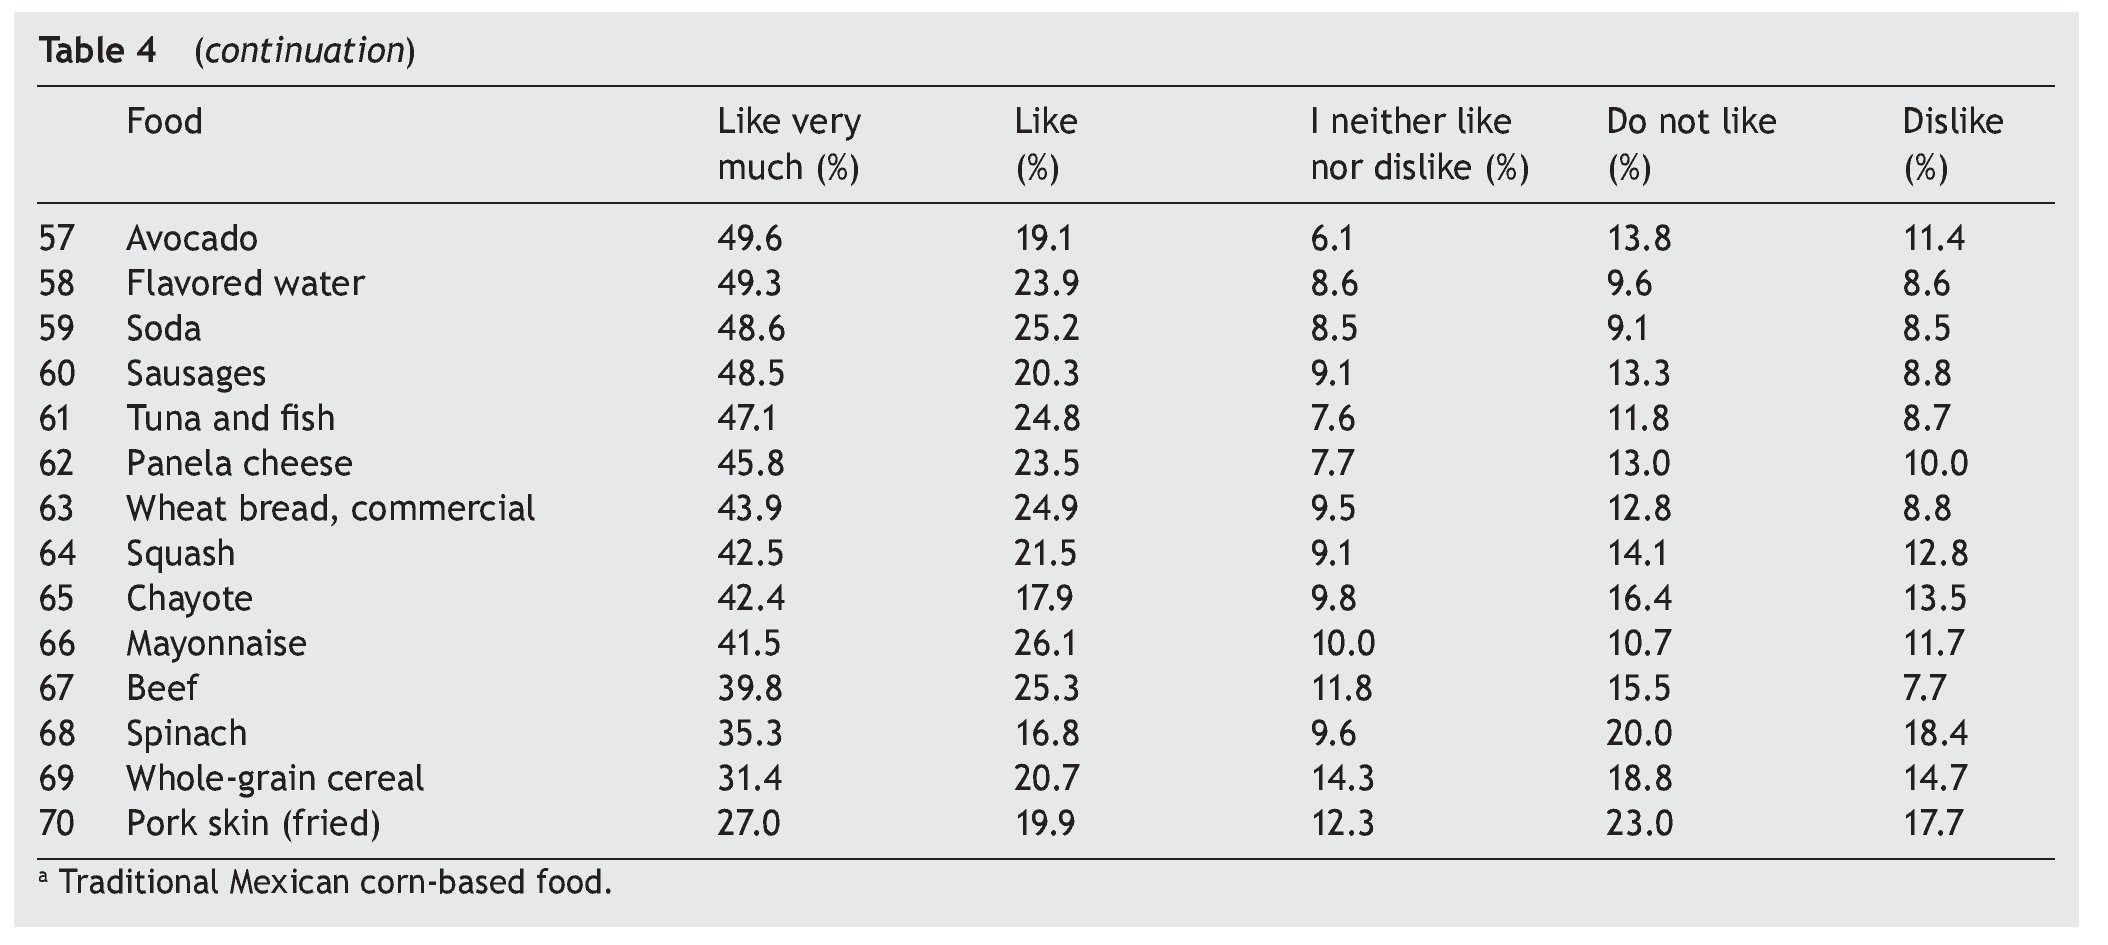
With respect to food preferences for the school-age children evaluated, it was found that the foods with the highest proportion of acceptance, i.e., with the category of “I like it very much,” were mainly fruits and foods such as pizza, flavored milk, French fries, sweetened drinks (with a similar acceptance to natural water 71 vs. 72%); vegetables and whole-grain cereals showed a low preference for the children (Table 4).
The analysis of the preferences in accordance with the nutritional status showed that the 20 foods that children liked the most in all groups were mainly fruits and those with a high fat content (pizza, French fries, ice creams) or sugar (sugar-sweetened cereal, flavored milk) (Table 5; Fig. 1). The foods with the least preference were vegetables, pork skin, panela cheese, mayonnaise, meat and fish, among others (Table 6; Fig. 2).
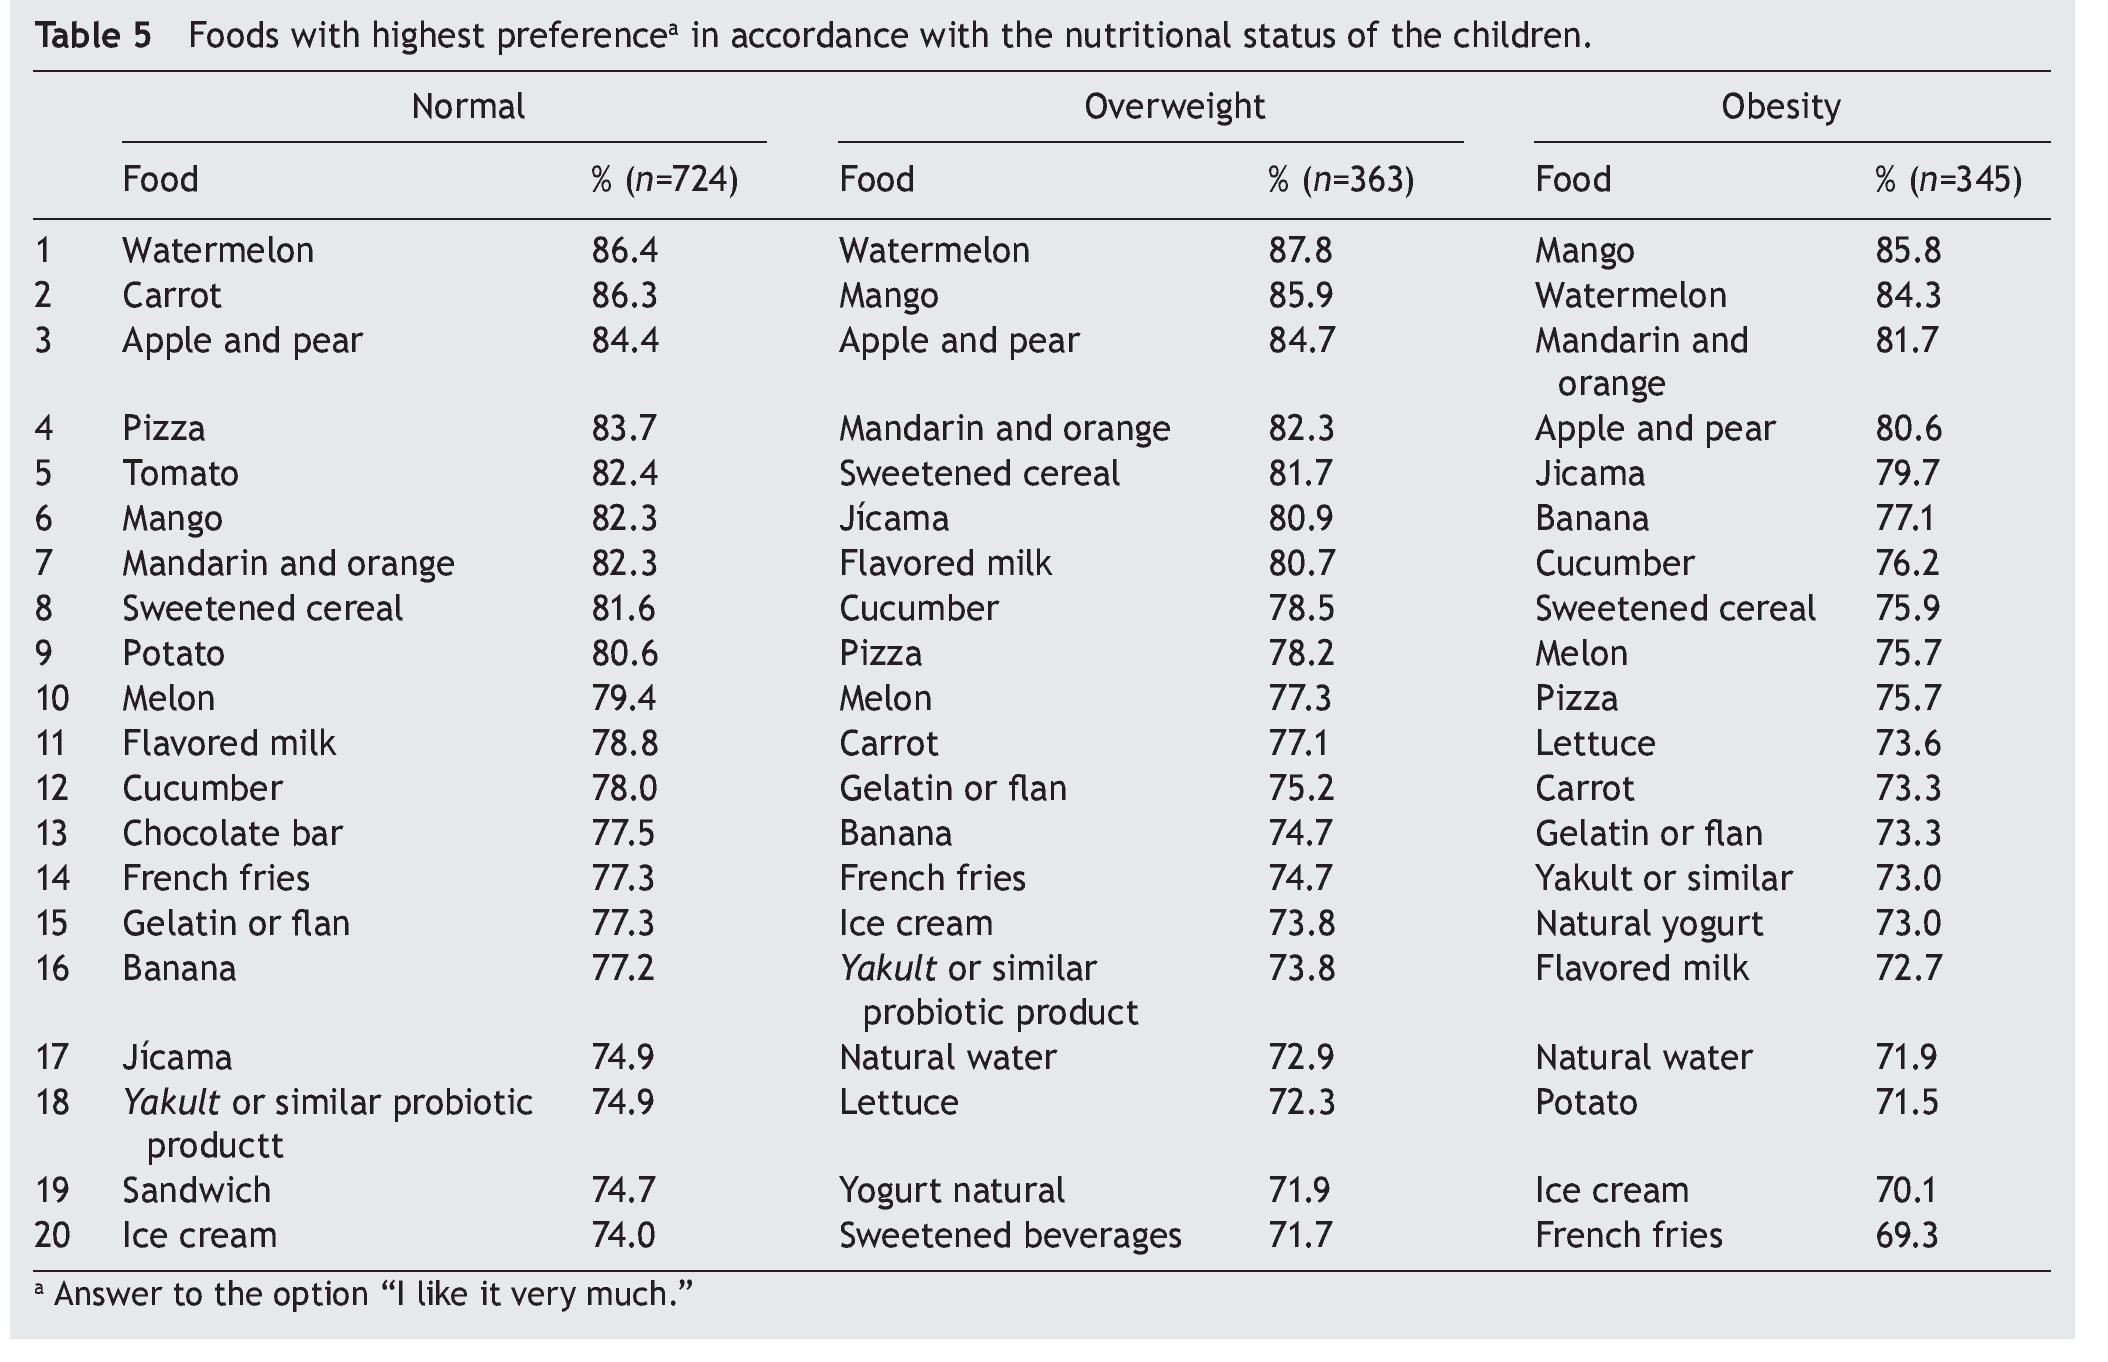
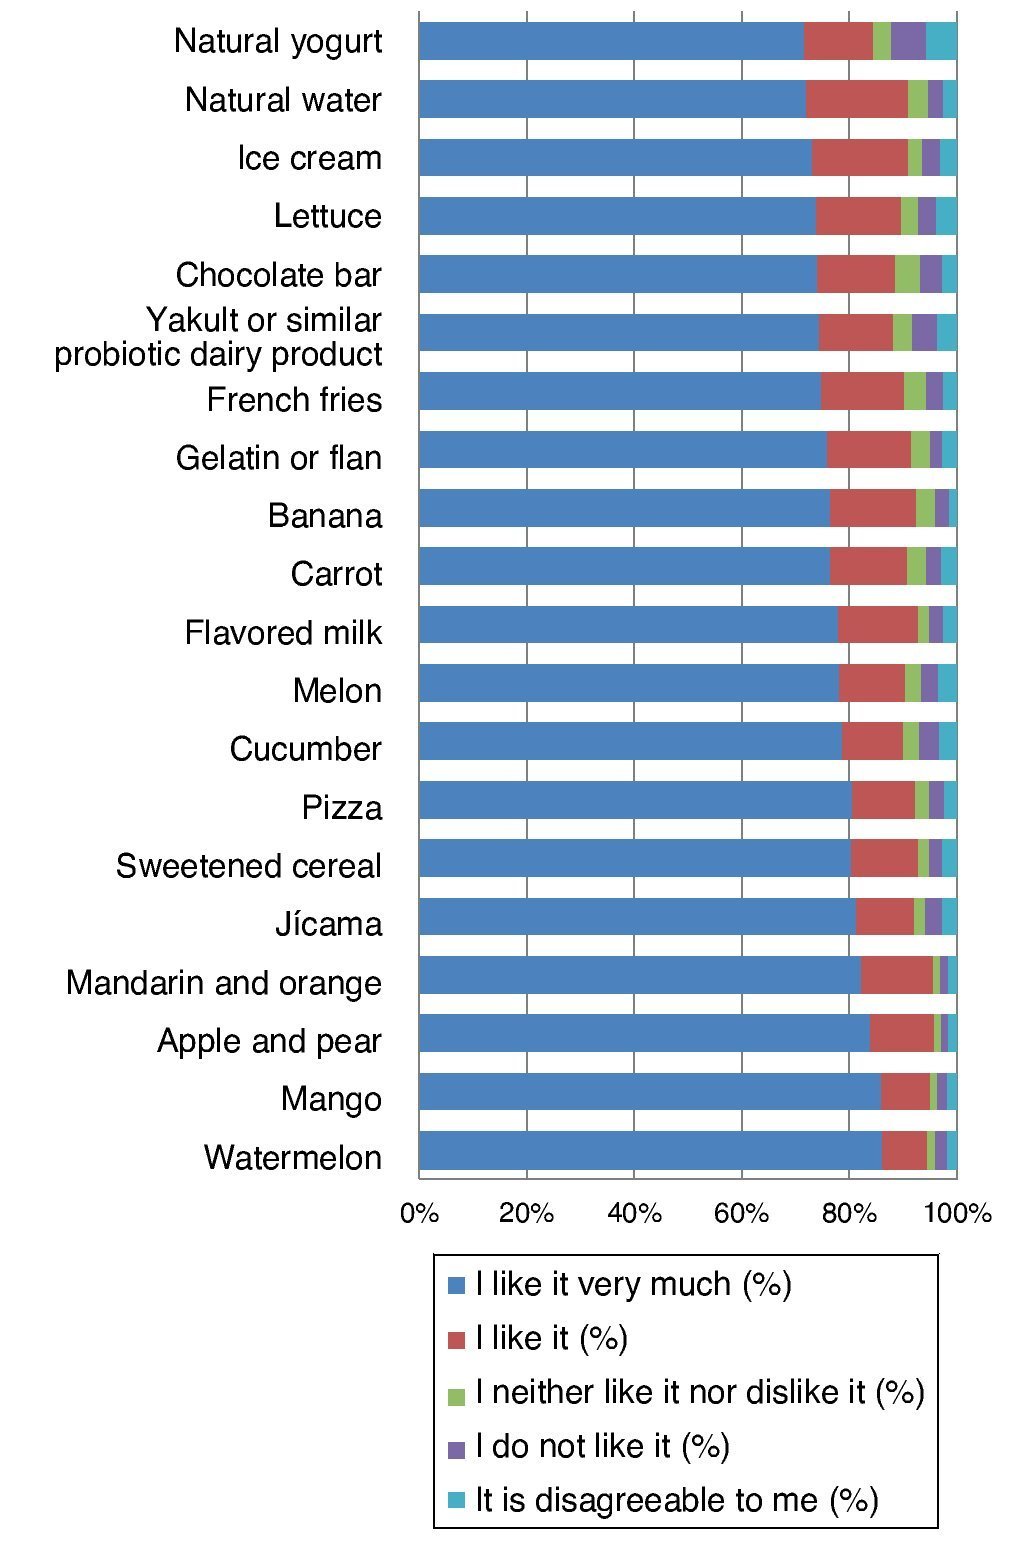
Figure 1 Foods with highest preference by school-age children.
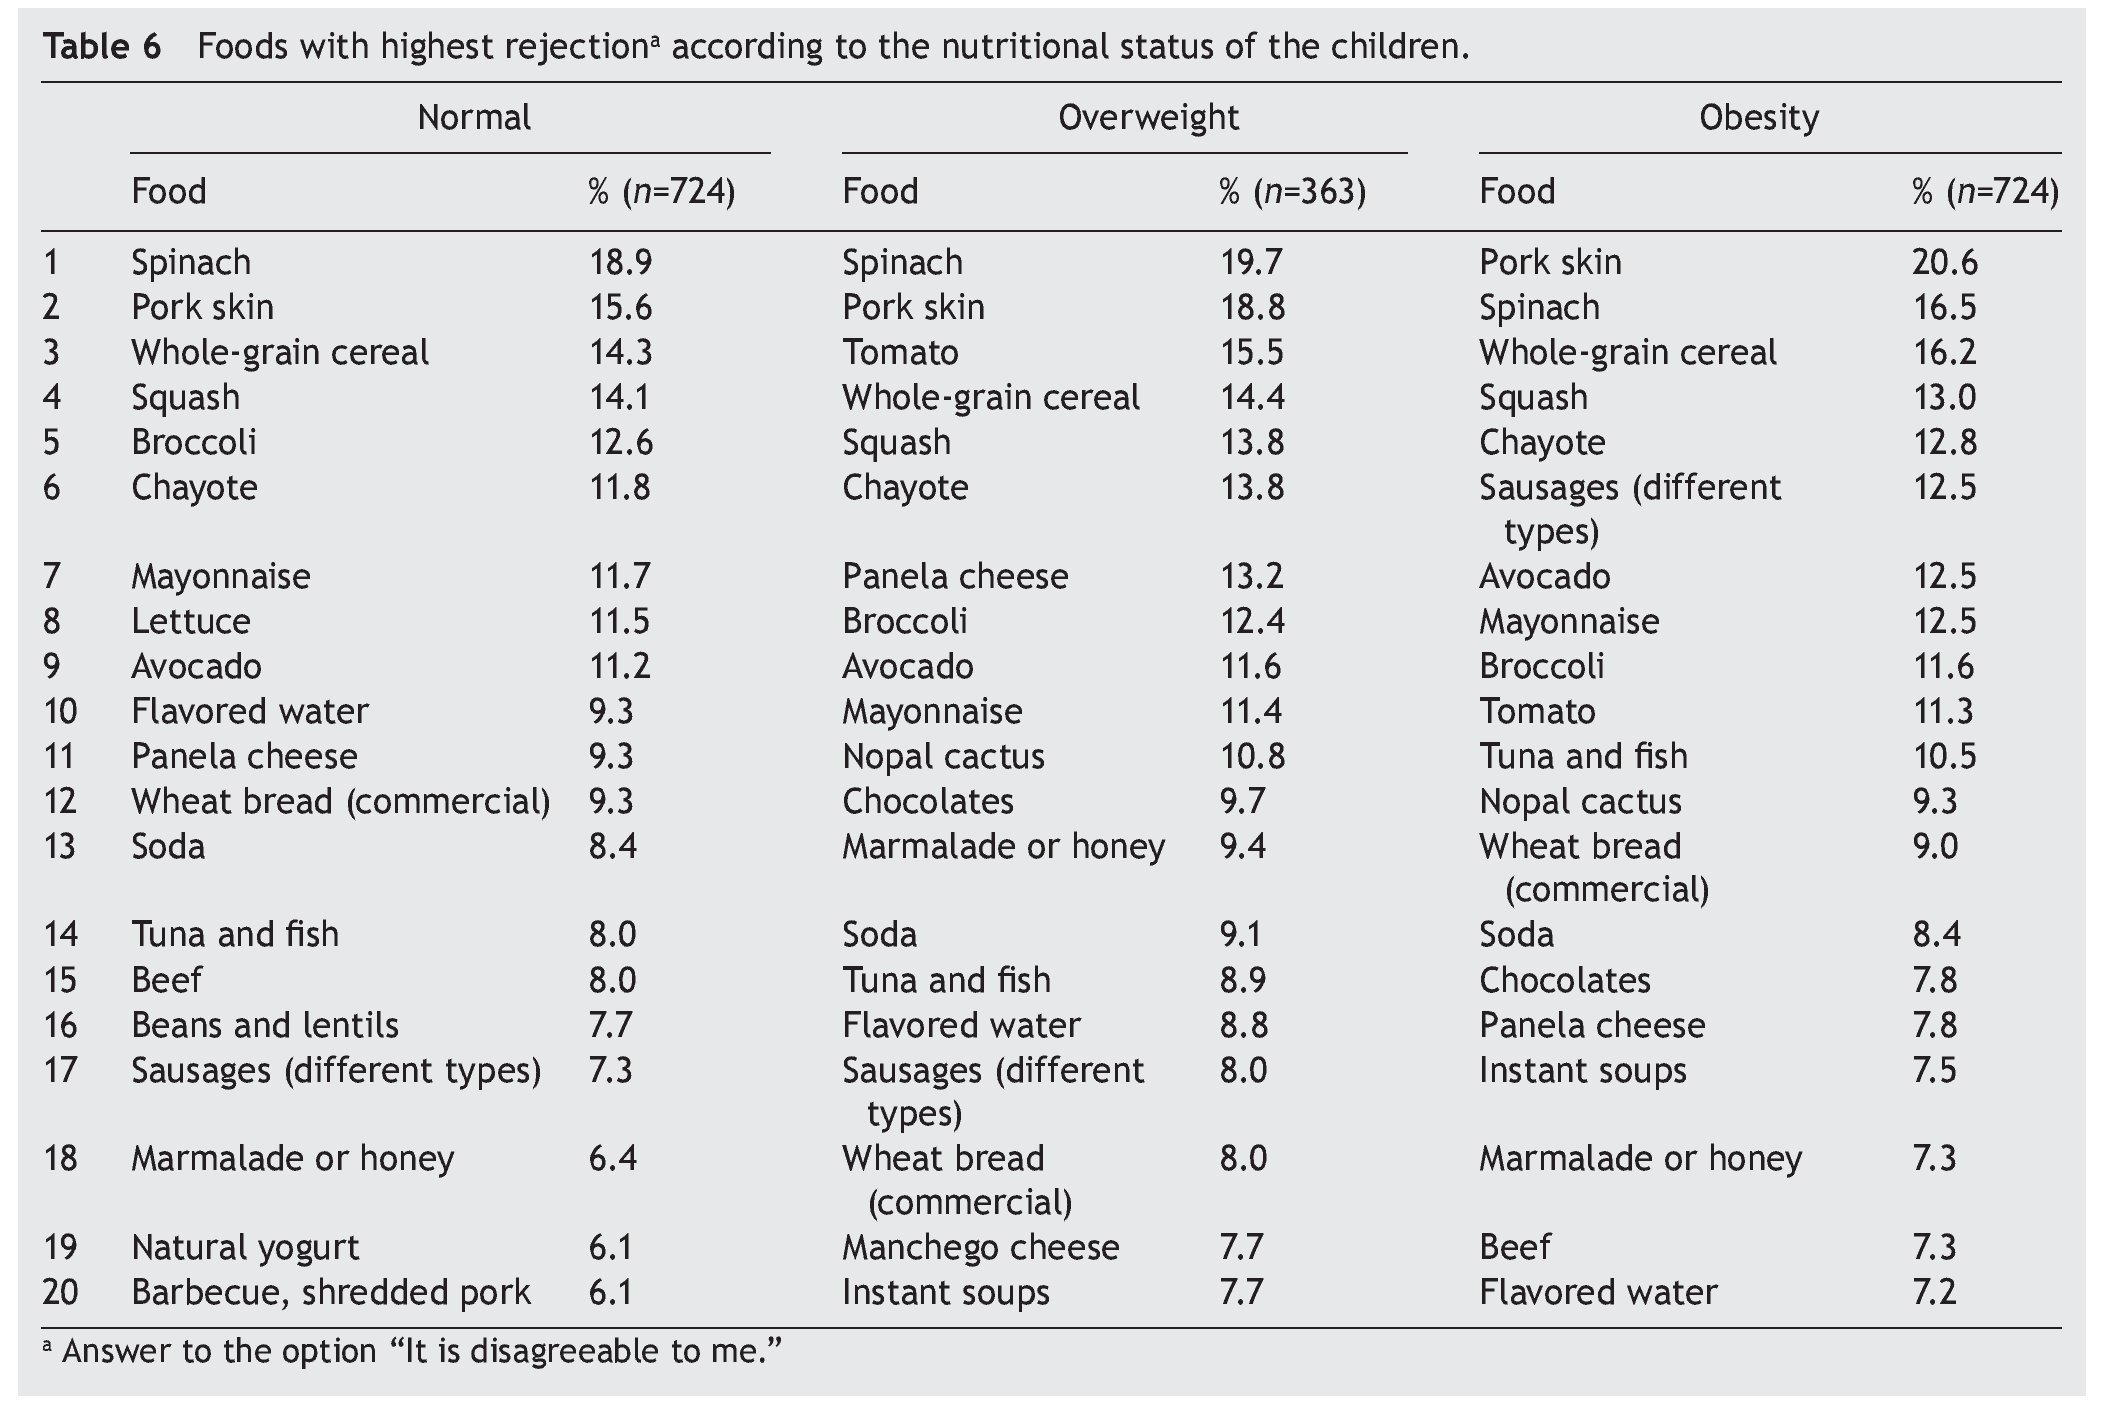
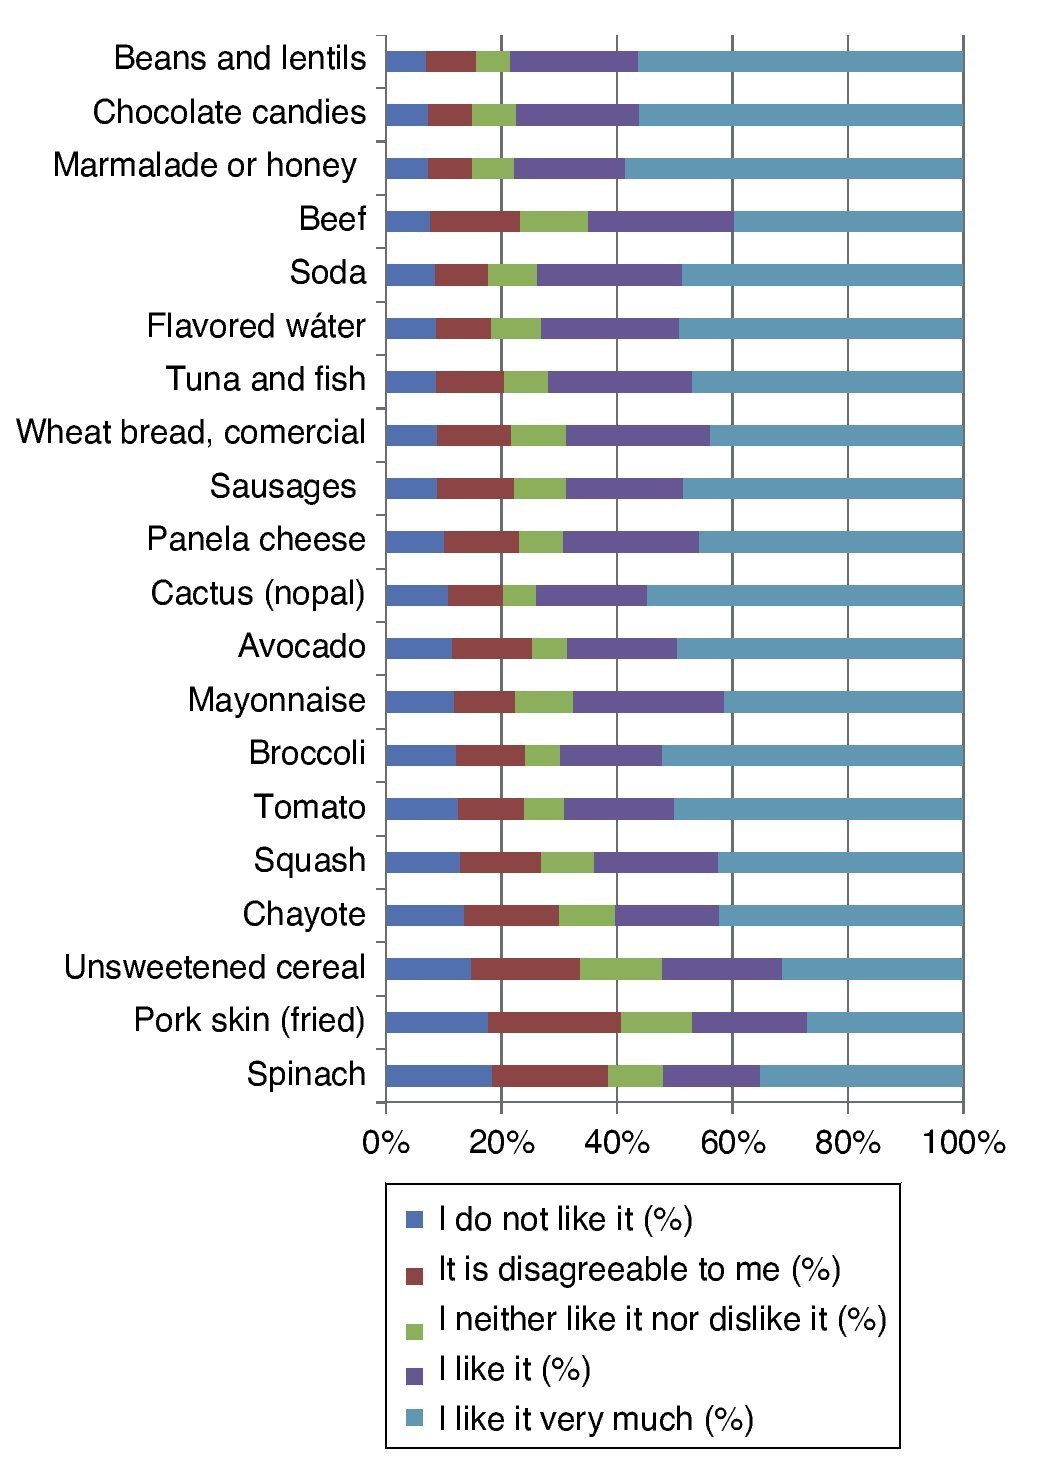
Figure 2 Foods most highly rejected by school-age children.
4. Discussion
This study shows various interesting findings about the food preferences of school-age children. The first is the confirmation for foods with sweet taste and shows that fruits are in first place of foods that are liked. A small proportion of the children reported not to like them as well as not liking processed sweet foods such as flavored milk, gelatins and ice cream, which are also found in first places. The second result to highlight is the preference for high-caloric foods and little nutritive value such as pizza or French fries within the first 20 places of the 70 foods evaluated. In third place is noted the low proportion of children who like vegetables (nopal cactus, broccoli, squash, the most commonly mentioned), which appear in 50th place or higher on the list. The pattern formed in accordance with the nutritional characteristics of foods by children with respect to their preferences represents a high risk for their consumption and, consequently, for the generation of overweight and obesity.
Currently, special emphasis has been placed worldwide on the importance of the consumption of sweetened drinks, among which soft drinks stand out as a risk factor for obesity.14 In Mexico in 2012, soft drinks occupied the fourth place among the “product or products of everyday consumption in Mexican households in which the most money was spent on average.”15 It has been reported that the high consumption of soft drinks, fruit drinks and sweetened drinks among Mexican adolescents is positively associated with their BMI.16 This situation has supported the implementation of programs to increase the consumption of natural water through mass media and actions to facilitate its access in schools through the installation of drinking fountains as well as the replacement of the sale of soft drinks for plain water.17 The present study identified a greater proportion for preference of plain water (19th place with 72% mentions of “I like it very much”) than soft drinks (57th place with 48.6% of the same category of likes). This could reflect a favorable result of the strategies directed at improving healthy behavior, although sweetened drinks based on juice or fruit still continue to have an elevated place of preference. The relevance of cultural and social aspects that favor consumption of these products in school-age children in Mexico has been recently documented,18 which shows the difficulty in achieving permanent changes both from the environment as well as individual preferences and reinforces the need to continue with solid education programs on nutrition as well as an effective health regulation policy on the production, distribution and marketing of these drinks.
As a complement of the preferences, it is important to emphasize that among the 20 foods with greatest rejection are many of those recommended for good nutrition and for the prevention of overweight and obesity such a foods rich in fiber, animal proteins and vegetables. Several of these had a higher rejection than soft drinks. This reflects the low impact of the promotion for the consumption of vegetables, despite their accessibility, both for their availability in the market as well their low cost. It will be necessary to incorporate, in the nutritional programs, actions that favor the inclusion of vegetables in daily food consumption of the children after the first years of life with the goal of developing a permanent taste for the flavor of these foods, as has been recommended in prior studies.19
With respect to the nutritional status of the children included in the study, the frequency of overweight and obesity was almost 15% higher than that reported in the last health and nutritional national survey (ENSANUT 2012), both at the national level4 as well as for the Federal District (DF).20 This difference could be attributed to the disadvantaged socioeconomic characteristics of the study population, which constitute a health vulnerability that could express itself as a higher risk for the development of obesity.21
The fact that listings of food preference according to the different nutritional status do not show significant variations could imply that consumption is influenced by other variables, mainly knowledge of nutrition and parental influence for the availability and consumption of certain types of food at home, as has been previously reported.22 Food preferences of the parents has shown to be a powerful modulator of the children’s preferences and determine nutritional behaviors from earlier ages such as the type, portions and schedule of foods and the customs of certain food environments (restaurants, television at mealtime, etc.).23
The findings of this study do not coincide with what has been reported in other contexts in which an association has been found between food preferences and body weight.24 This may be possibly due to the fact that during school age the pattern of food preferences is not yet expressed as a pattern of consumption that implies a modification in their nutritional status. This may be as a result of children not having the freedom to freely choose the foods in their daily diet, although they are available in their school environment. In this sense, one limitation of this study consists of the impossibility of identifying the concordance between the foods that the children preferred with the actual consumption, although it is assumed that the self-reporting was reliable and that, in fact, it reflected their likes and dislikes of the evaluated foods and beverages. It should be recognized that some foods could have been omitted in the a priori selection of the listing provided in the questionnaire. It will be necessary to continue with this line of research to achieve a more detailed identification of the pattern of preferences, of the relationship of the preferences in their consumption and their modification through time.
In conclusion, in this population of school-age children from a low socioeconomic status, the pattern of food preferences did not vary according to the nutritional status of the children. However, this pattern of preferences identified aspects of risk for an adequate nutritional status. If consumption is carried out according to these preferences, in the medium term a nutritional practice will most likely be foods that will further increase the already high prevalence of obesity in vulnerable populations. Because of this, and based on the evidence presented here, it is urgent that actions in health promotion programs are strengthened to promote nutrition education from the first years of life in order to form, on a permanent basis, healthy habits in children.
Funding
Funding: CONACYT (Salud 2007-01-68854).
Conflict of interest
The authors declare no conflict of interest of any nature.
Received 24 December 2014;
accepted 29 December 2014
☆ Please cite this article as: Sánchez-García R, Reyes-Morales H, González-Unzaga MA. Preferencias alimentarias y estado de nutrición en niños escolares de la Ciudad de México. Bol Med Hosp Infant Mex. 2014;71:358-366
* Corresponding author.
E-mail: marcounzaga@gmail.com (M.A. González-Unzaga).