


The nurseries program (NP) was created to support parents with 1 to 3-year-old children living in poverty situation in Mexico, and includes education and child daycare for 8hours five days per week. The objective of this study was to evaluate the association between length of stay in the NP and the level of development in children.
MethodsCross-sectional, population-based study conducted in two Mexican states. All children aged between 12 to 48 months enrolled in NP from November 2014 to January 2015 were included. The Child Development Evaluation (CDE) test was used to screen early development. Normal early development prevalence odds ratio (OR) was calculated and adjusted for gender, impairment, and state, using as a reference those children with less than 30 days in the program.
ResultsThe study included 3,387 children from 177 NP nurseries, 53% were male; age by group was divided in 12-24 months (22.3%), 25-36 months (37.6%) and 37-42 months (40.1%). Normal development adjusted OR by age were 1.9 (CI95%: 1.30-2.78) for 6-11 months, 2.36 (95%IC: 1.60-3.50) for 12-17 months, 2.78 (95%IC: 1.65-4.65) for 18-23 months and 3.46 (95%IC: 2.13-5.60) for > 24 months. Regarding area of development, a greater probability of having a normal result for language and social areas was observed after six months in the program, and for the motor (both gross and fine) and knowledge areas after 12 months.
ConclusionThe length of the stay in the NP after six months significantly and progressively increases the probability of normal development regardless of gender and age.
El Programa de Estancias Infantiles (PEI) se enfoca en padres de niños de 1-3 años en situación de pobreza. Incluye educación y cuidado de los niños por 8h, 5 días por semana. El objetivo del estudio fue evaluar la asociación entre el tiempo de permanencia en el PEI y el nivel de desarrollo infantil.
MétodosEstudio transversal de base poblacional en dos estados de México. Se incluyeron todos los niños de 12-48 meses inscritos al PEI de noviembre de 2014 a enero de 2015. Se evaluó el nivel de desarrollo con la prueba EDI. Se calculó la razón de momios de prevalencia (RMP) para desarrollo normal por tiempo de estancia, ajustado por sexo, edad y discapacidad, teniendo como referencia a los niños que tenían < 30 días en el PEI.
ResultadosSe incluyeron 3387 niños de 177 estancias infantiles: 53% de sexo masculino; 22.3% de 12-24 meses, 37.6% de 25-36 meses y 40.1% de 37-42 meses de edad. El RMP ajustado para desarrollo normal fue de 1.90 (IC95%:1.30-2.78) para 6-11 meses, 2.36 (IC95%:1.60-3.50) para 12-17 meses, 2.78 (IC95%:1.65-4.65) para 18-23 meses y 3.46 (2.13-5.60) para > 24 meses. Por área de desarrollo, se observó una mayor probabilidad de desarrollo normal a partir de 6 meses de estancia para lenguaje y social, y a partir de 12 meses para motor grueso, fino y conocimiento.
ConclusionesEl tiempo de permanencia en el PEI a partir de 6 meses incrementa, de forma significativa y progresiva, la probabilidad de tener un desarrollo normal independiente del sexo y edad.
During the last decades, there has been a worldwide trend towards an increase in public investment to promote neurodevelopment of children at an early age. In this context, the goals of the United Nations for Sustainable Development 2030 set as a goal 4.2 “to ensure that all girls and boys have access to early childhood care and development services and quality early childhood education, so they are ready for primary schooling”.1 One reason for this objective is the recognition and dissemination of environmental factors, such as malnutrition, lack of care and inadequate education, which are crucial for proper early childhood development (ECD).2 This period, which ranges from 0 to 5 years, is of utmost importance since it is when the bases of brain architecture and structure for the formation of new cognitive, social and emotional skills are established.3
In the international context, the implementation of new government programs to boost ECD in children under five years old has proved to be cost-effective in promoting early learning and cognitive abilities and achieving an overall better level of development.3–5 Among the long-term effects observed are a greater number of individuals who completed their high school education, a higher number of years studied, obtaining better income and a reduction in crime and teenage pregnancy.6 From a macroeconomic point of view, there are data indicating a recovery of $ 3 to $ 7 USD per dollar invested in children younger than five years old.6–8 Therefore, coordination between the health, education and child protection sectors is essential for the establishment of the required intersectoral actions to cover those needs.4
In Mexico, although pre-school education is compulsory since 2002, in 2013, only 44% of children under three years old entered the first year of preschool education.9 During this period, additional strategies were implemented with the aim of reducing the gap regarding access and employment in vulnerable populations. Thus, in 2006, the nurseries program (NP) was created by the Ministry of Social Development (SEDESOL), in response to the high demand for child care,10 and with the objective of “supporting mothers, single parents and guardians who work or are looking to work or study, whose estimated per capita income per household does not exceed the welfare line (poverty situation) and declare that they do not have access to child care services through public social security institutions or other means, and who have kids between 1 and 3 years 11 months old, or before the age of 6 if they have a disability”.11
By 2012, the NP had taken care of 1.05 million children. It is estimated that if the program were interrupted, 34% of beneficiaries would have to quit their jobs to take care of their children.12 Since its inception, the NP has evolved with changes resulting from different evaluations,13,14 and has established itself as a comprehensive and standardized model which includes, in addition to education, the overall health care of the child. This model includes the attention of children from Monday to Friday for 8hours every day, during which many social, motor, cognitive and interaction activities are carried out, promoting ECD. In addition, two meals per day are awarded.15
With the purpose of exploring the results of this educational model, the objective of this study was to evaluate the association between the length of stay in the NP and children level of development.
2MethodsA cross-sectional population-based study was conducted in two Mexican states, which were selected for having different sociodemographic and cultural characteristics. One of the states (Baja California) is located in the northwest of the country, on the border with the United States, and has 3,155,070 inhabitants. Its main economic activities are the manufacturing industry, tourism, and hotels. In Baja California, 90% of households have electricity, water and drainage.16 In contrast, Campeche, located in the southeast of the country, has its southern border with Guatemala, and has 822,441 inhabitants. Its economy is based on oil, tourism, agriculture, fishing, and manufacturing. In Campeche, 74.5% of homes have electricity, water and drainage.16
3Studied populationChildren between 12 to 48 months old were enrolled in NP child placements located in the selected states from November 2014 to January 2015. For each participant, the following information was recorded: gender, age, time of assistance to the child care facilities and the presence of a disability reported by the nursery and defined as “any person who, by congenital or acquired reason, has one or more deficiencies physical, mental, intellectual or sensory impairment, permanent or temporary”.11
The developmental measurement was performed using the axis of development areas of the Child Development Evaluation test (CDE);17 a screening tool developed18 and validated19 in Mexico for early detection of child development problems in children from one month old to one day before the age of 5 years. The CDE test has adequate sensitivity and specificity to identify the level of both global19 and each particular domain20 of development. The obtained results are based on a semaphore in which differentiated interventions are justified21 and whose properties have been assessed and corroborated in the population for children identified in risk of developmental delay.22
The evaluation of development was carried out by the personnel responsible of each of the nurseries included in the study. For the right management of CDE items, the staff was trained through a course, and information was reinforced with brief videos about the evaluation technique for each item. To maintain the quality of the information, the supervisors of the NP at the participating states verified the correct application of the test. The supervisor collected the application formats in each of the nurseries and electronically captured the information. At the central level, the information was collected, and the final database was structured.
4Instrument descriptionThe CDE test consists of 26 to 35 items, grouped into five axes: biological risk factors, warning signs, alarm signals, neurological exploration and developmental areas (fine motor, gross motor, language, social and knowledge). Possible outcomes are normal development (green), developmental lag (yellow) or in risk of developmental delay (red). It can be classified as red based on the results obtained in one or more of the following axes: developmental areas, neurological exploration or alarm signals. For the age group of the participants, the only way an overall result of developmental lag could be obtained is through the development areas axis.17
The development evaluation was carried out globally and for each development area as follows:
Globally. It was conducted in two ways: with the semaphore and with the global percentage: The result by the semaphore system was obtained using the criteria of the CDE test in the development areas axis,17 whose properties for the identification of problems have been previously reported.20 Three possible outcomes exist: normal (green semaphore), when the evaluated participant meets all or most of the items of its corresponding age group for all areas of development; developmental gap (yellow semaphore), when the participant performs only one activity of its corresponding age group, or performs all or most of the activities of the previous age group in one or more areas. Finally, in risk of developmental delay (red semaphore), when the participant meets only one or none item of previous age group in one or more areas of development.
To obtain the overall percentage, we considered the total number of items in the age group of the participant as the denominator and the number of correct items multiplied by 100 as the numerator. Cut points were established as > 95% and 100%.
By area of development. We considered the semaphore individually for each area. In the case of the gross and fine motor, language and social engine, results for children 12-48 months are described. The area of knowledge only was evaluated in children older than 36 months; thus, results shown are only those from the 37-48-month-old group. The overall result was calculated as previously described.
The exposure variable was the length of stay in the NP. It was classified as less than 30 days, 1 to 5 months, 6 to 11 months, 12 to 17 months, 18 to 23 months and longer than 24 months.
The adjustment variables were the age of the children grouped in three stages (12 to 24 months, 25 to 36 months and 37 to 48 months), sex, the presence of disability and state of the Mexican Republic.
4.1Statistical analysisQualitative variables were presented as absolute frequencies and percentages, and quantitative variables were expressed as median and interquartile range (ICR).
To know the association between length of stay in the NP and other co-variables with the probability of having normal development (green semaphore or a global development level > 95%), the odds ratio (OR) was obtained, with 95% confidence intervals (95% CI), in a bivariate manner. The adjusted OR with 95% CI was obtained through logistic regression models, both for the probability of a normal global development and for each developmental area (gross motor, fine motor, language).
A value of p <0.05 on two tails was considered as statistical significance. The analysis was performed using the IBM, SPSS version 20.0 software.
4.2ResultsThe study included 3,387 children between 12 to 48 months old from the NP (47.8% and 52.2% from Baja California and Campeche, respectively). The median length of stay per nursery was 17 months (interquartile range: 11.5-26.5) in Baja California and 18 months (interquartile range: 12-24) in Campeche.
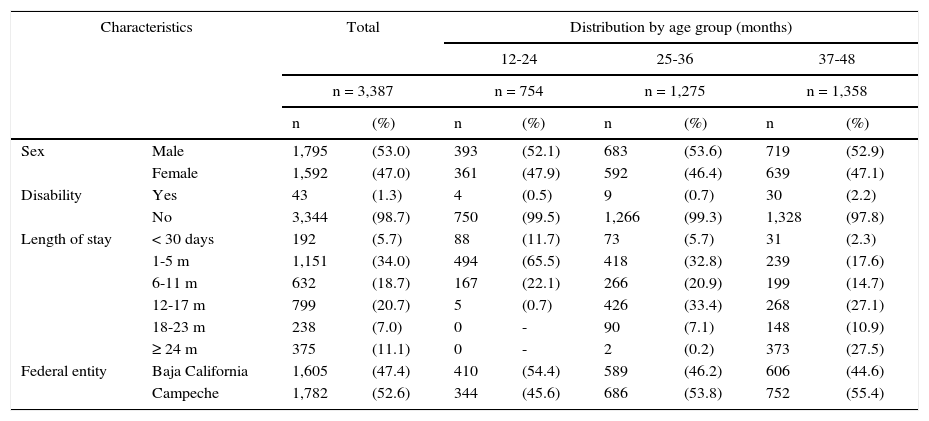
Of the children evaluated, 53% (n = 1,795) were males. The age distribution was 22.3% (n = 754) from 12 to 24 months, 37.6% (n = 1,275) from 25 to 36 months and 40.1% (n = 1.358) from 37 to 42 months. Only 1.3% (n = 43) of children had a disability (Table 1).
Characteristics of the population studied by age group.
| Characteristics | Total | Distribution by age group (months) | |||||||
|---|---|---|---|---|---|---|---|---|---|
| 12-24 | 25-36 | 37-48 | |||||||
| n = 3,387 | n = 754 | n = 1,275 | n = 1,358 | ||||||
| n | (%) | n | (%) | n | (%) | n | (%) | ||
| Sex | Male | 1,795 | (53.0) | 393 | (52.1) | 683 | (53.6) | 719 | (52.9) |
| Female | 1,592 | (47.0) | 361 | (47.9) | 592 | (46.4) | 639 | (47.1) | |
| Disability | Yes | 43 | (1.3) | 4 | (0.5) | 9 | (0.7) | 30 | (2.2) |
| No | 3,344 | (98.7) | 750 | (99.5) | 1,266 | (99.3) | 1,328 | (97.8) | |
| Length of stay | < 30 days | 192 | (5.7) | 88 | (11.7) | 73 | (5.7) | 31 | (2.3) |
| 1-5 m | 1,151 | (34.0) | 494 | (65.5) | 418 | (32.8) | 239 | (17.6) | |
| 6-11 m | 632 | (18.7) | 167 | (22.1) | 266 | (20.9) | 199 | (14.7) | |
| 12-17 m | 799 | (20.7) | 5 | (0.7) | 426 | (33.4) | 268 | (27.1) | |
| 18-23 m | 238 | (7.0) | 0 | - | 90 | (7.1) | 148 | (10.9) | |
| ≥ 24 m | 375 | (11.1) | 0 | - | 2 | (0.2) | 373 | (27.5) | |
| Federal entity | Baja California | 1,605 | (47.4) | 410 | (54.4) | 589 | (46.2) | 606 | (44.6) |
| Campeche | 1,782 | (52.6) | 344 | (45.6) | 686 | (53.8) | 752 | (55.4) | |
m: months.
In the global semaphore evaluation for the total population, 80.8% (n = 2,738) obtained a normal result; 15.8% (n = 536), developmental lag; and 3.3% (n = 113), in risk of developmental delay. Significant differences (p <0.001) between the time spent in the nurseries and the overall semaphore (Figure 1A) were found. There was a progressive increase in participants with normal outcome (70.8% for <1 month and 87.7% for > 24 months in the nurseries) and a decrease in any abnormal outcome (developmental lag of 24% to 9.1% and in risk of developmental delay from 5.2% to 3.2% for <1 month and > 24 months for stays, respectively). Taking as reference the 0-30 days of stay category, we found a greater probability of having a normal result (crude OR) in the participants who had a stay longer than six months in the nurseries (Table 2).
. A. Distribution of the result as a global semaphore. B. Distribution of the overall percentage result.")
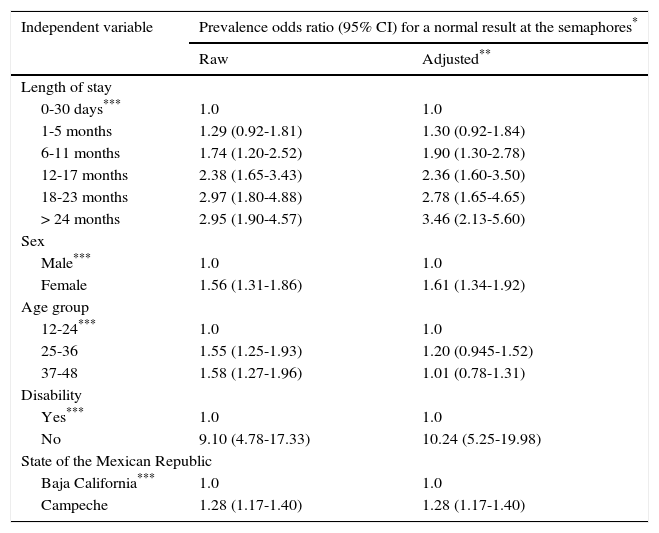
Raw and adjusted prevalence odds ratio to obtain a normal development result at the semaphore.
| Independent variable | Prevalence odds ratio (95% CI) for a normal result at the semaphores* | |
|---|---|---|
| Raw | Adjusted** | |
| Length of stay | ||
| 0-30 days*** | 1.0 | 1.0 |
| 1-5 months | 1.29 (0.92-1.81) | 1.30 (0.92-1.84) |
| 6-11 months | 1.74 (1.20-2.52) | 1.90 (1.30-2.78) |
| 12-17 months | 2.38 (1.65-3.43) | 2.36 (1.60-3.50) |
| 18-23 months | 2.97 (1.80-4.88) | 2.78 (1.65-4.65) |
| > 24 months | 2.95 (1.90-4.57) | 3.46 (2.13-5.60) |
| Sex | ||
| Male*** | 1.0 | 1.0 |
| Female | 1.56 (1.31-1.86) | 1.61 (1.34-1.92) |
| Age group | ||
| 12-24*** | 1.0 | 1.0 |
| 25-36 | 1.55 (1.25-1.93) | 1.20 (0.945-1.52) |
| 37-48 | 1.58 (1.27-1.96) | 1.01 (0.78-1.31) |
| Disability | ||
| Yes*** | 1.0 | 1.0 |
| No | 9.10 (4.78-17.33) | 10.24 (5.25-19.98) |
| State of the Mexican Republic | ||
| Baja California*** | 1.0 | 1.0 |
| Campeche | 1.28 (1.17-1.40) | 1.28 (1.17-1.40) |
95% CI: 95% confidence interval.
In addition, significative differences (p <0.001) were found in the distribution of a normal result by sex (77.7% and 84.4% for male and female, respectively); age (75.1%, 82.4% and 82.6% for 12-24 months, 25-36 months and 37-48 months, respectively); disability (32.6% and 81.5% in those with or with no disability, respectively); and state (76.8% and 84.5% for Baja California and Campeche, respectively). When analyzing each of these variables separately, we found a greater probability of having a normal result (crude OR) for the female sex, age > 24 months, not having a disability and being a native of Campeche (Table 2).
When adjusting the probability of obtaining a normal semaphore result by the other variables through a logistic regression model, we found that there were no differences by age group, and there was no change in the probability of having a normal result in the state of Campeche. The likelihood of having a normal result for females increased by 3.2% and the probability of a normal result rose by 12.5% if the participant did not have a disability. Similarly, the probability of having a normal result by length of stay in the nurseries continued without being significant for the group of 1-6 months; increased 9.1% in the group of 6-11 months; decreased 0.8% and 6.4% in the groups of 12-17 months and 18-23 months, respectively; and increased by 17.3% in the group > 24 months (Table 2).
4.4Global percentage resultThe 98.7% of the population with a normal result, 27.4% with development lag and 0.9% with a risk of developmental delay performed > 95% of the evaluated items corresponding to their ages. Additionally, 81.7% of the participants with normal global results performed 100% of the items.
In participants with developmental lag who obtained a global percentage between 95 and 99.9% (n = 147), a 96.6% of them had it only in one area, of which 81.7% performed all the activities of the previous age group and some of their own age group (55.8% and 61.4%, respectively) in comparison with those who had an overall percentage of 94.9% (n = 389). It was found that 0.16% of the participants with a result between 95.0-99.9% were classified as in risk of developmental delay, compared with 20.52% of those participants with an overall result of <95%.
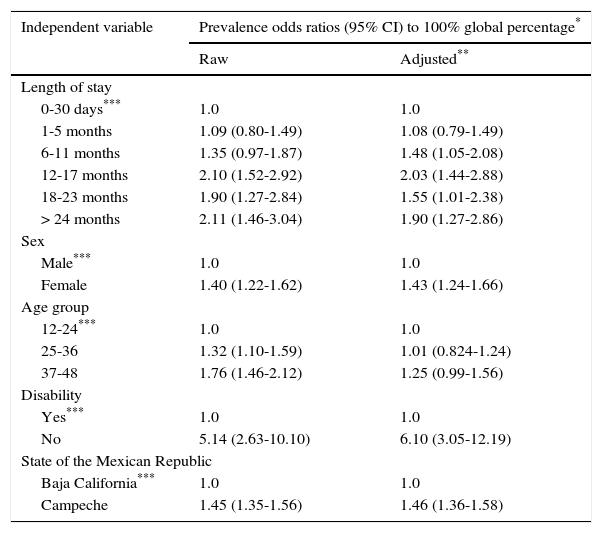
Significant differences (p <0.001) between the length of stay in the NP and the overall percentage results (Figure 1B) were found. There was a progressive increase in participants with 100% of the items corresponding to their age (57.3 to 79.3% for <1 month and > 24 months in the nurseries, respectively). Additionally, significant differences (p <0.001) were found in the distribution of the overall results of 100% by sex (62.5% and 70.1% for male and female, respectively); age (58.5%, 65.0% and 71.3% for 12-24 months, 25-36 months and 37-48 months, respectively); disability (7.3% and 44.2% in those with and without disabilities, respectively); and state (57.3% and 74.0% in Baja California and Campeche, respectively). When the probability of having a 100% result was evaluated for each variable, similar results with the normal semaphore evaluation were found (Table 3).
Raw and adjusted prevalence odds ratio for 100% global percentage of development level.
| Independent variable | Prevalence odds ratios (95% CI) to 100% global percentage* | |
|---|---|---|
| Raw | Adjusted** | |
| Length of stay | ||
| 0-30 days*** | 1.0 | 1.0 |
| 1-5 months | 1.09 (0.80-1.49) | 1.08 (0.79-1.49) |
| 6-11 months | 1.35 (0.97-1.87) | 1.48 (1.05-2.08) |
| 12-17 months | 2.10 (1.52-2.92) | 2.03 (1.44-2.88) |
| 18-23 months | 1.90 (1.27-2.84) | 1.55 (1.01-2.38) |
| > 24 months | 2.11 (1.46-3.04) | 1.90 (1.27-2.86) |
| Sex | ||
| Male*** | 1.0 | 1.0 |
| Female | 1.40 (1.22-1.62) | 1.43 (1.24-1.66) |
| Age group | ||
| 12-24*** | 1.0 | 1.0 |
| 25-36 | 1.32 (1.10-1.59) | 1.01 (0.824-1.24) |
| 37-48 | 1.76 (1.46-2.12) | 1.25 (0.99-1.56) |
| Disability | ||
| Yes*** | 1.0 | 1.0 |
| No | 5.14 (2.63-10.10) | 6.10 (3.05-12.19) |
| State of the Mexican Republic | ||
| Baja California*** | 1.0 | 1.0 |
| Campeche | 1.45 (1.35-1.56) | 1.46 (1.36-1.58) |
95% CI: 95% confidence interval.
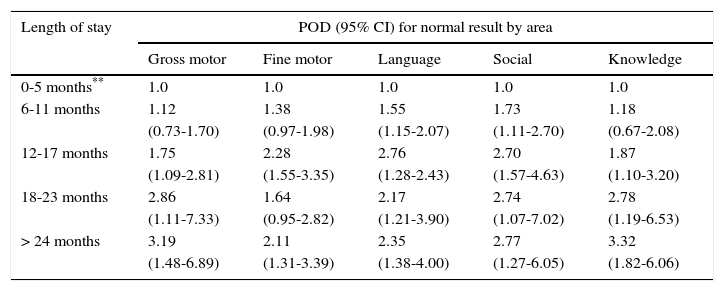
For each of the areas, a significant association (p <0.001) between the length of stay and the semaphore result (Figure 2) was observed. When adjusting for sex, state, disability and age group, a progressive and significant increase in the probability of obtaining a normal result was observed, taking as reference the participants who were less than six months in the nurseries for the language and social areas. For the areas of gross motor, fine motor and knowledge it was significant with 12 months of stay or longer (Table 4).

Probability of normal development by area evaluated according to length of stay.*
| Length of stay | POD (95% CI) for normal result by area | ||||
|---|---|---|---|---|---|
| Gross motor | Fine motor | Language | Social | Knowledge | |
| 0-5 months** | 1.0 | 1.0 | 1.0 | 1.0 | 1.0 |
| 6-11 months | 1.12 | 1.38 | 1.55 | 1.73 | 1.18 |
| (0.73-1.70) | (0.97-1.98) | (1.15-2.07) | (1.11-2.70) | (0.67-2.08) | |
| 12-17 months | 1.75 | 2.28 | 2.76 | 2.70 | 1.87 |
| (1.09-2.81) | (1.55-3.35) | (1.28-2.43) | (1.57-4.63) | (1.10-3.20) | |
| 18-23 months | 2.86 | 1.64 | 2.17 | 2.74 | 2.78 |
| (1.11-7.33) | (0.95-2.82) | (1.21-3.90) | (1.07-7.02) | (1.19-6.53) | |
| > 24 months | 3.19 | 2.11 | 2.35 | 2.77 | 3.32 |
| (1.48-6.89) | (1.31-3.39) | (1.38-4.00) | (1.27-6.05) | (1.82-6.06) | |
POR, prevalence odds ratio; 95% CI, 95% confidence interval.
The results of this study, the first performed in children under 3 years of age in a nursery setting, showed a progressive and significant increase in the probability of having a normal development from a stay in the NP of more than six months compared to those children who stayed for less than one month in the program, regardless of their age. This corroborates the crucial importance of promoting the incorporation of children into childcare programs that include activities to foster their development from an early age.
It is worth noting that in studies that have evaluated the development of children in the general population in this age group using the CDE test,23,24 it has been reported a decrease of 3.1% in the proportion of children with normal development at three years old compared to 1-year-old children. According to the results of this study, the above suggests that the length of stay in the nursery can be a protective factor for development lag or risk of developmental delay problems; this is consistent with other authors’ findings regarding pre-scholar education.5,6,25
An additional contribution is that these data corroborate the results of an evaluation of the NP conducted in 2011,13,14 which identified a positive impact on the personal-social and communication areas and added a positive effect on gross motor, fine motor, and cognitive areas.
It should be recognized that the studied population is highly vulnerable due to their low socioeconomic status. It will be necessary to carry out studies that allow evaluating if the positive effect is maintained in other population groups without so many social disadvantages. Although it has been shown that there are differences in the level of development by sex, this should also be deepened for other non-studied variables related to social determinants, and the follow-up of children in the NP to corroborate any change or improvement in the level of development directly associated with length of stay in the nurseries.
In conclusion, a stay of six months in the NP significantly and progressively increases the probability of having a normal development independently of gender and age. A longitudinal evaluation is required to corroborate this result.
Ethical disclosuresProtection of human and animal subjectsThe authors declare that the procedures followed were in accordance with the regulations of the relevant clinical research ethics committee and with those of the Code of Ethics of the World Medical Association (Declaration of Helsinki).
Confidentiality of dataThe authors declare that they have followed the protocols of their work center on the publication of patient data.
Right to privacy and informed consentThe authors have obtained the written informed consent of the patients or subjects mentioned in the article. The corresponding author is in possession of this document.
FundingNone.
Conflict of interestThe authors declare they do not have conflicts of interest.
To Samuel Medina García, Mario Paredes Rangel, Jesús Homero Trujillo Flores, Perla María Ortega Lomelin, Yara Luisa Caraveo Cervera, Lizbeth Gabriela Salado Meléndez, Magdalena Ferrusquía Figueroa, Miriam Oran Ibáñez, Alexander Palma Tavera, Daniel Eduardo Álvarez Amado and all those responsible of The DIF / SEDESOL Children's Nurseries of Baja California and Campeche that participated in this study.
Please cite this article as: Rizzoli-Córdoba A, Vargas-Carrillo LI, Vásquez-Ríos JR, Reyes-Morales H, Villasís-Keever MÁ, O'Shea-Cuevas G, et al. Asociación entre el tiempo de permanencia en el Programa de Estancias Infantiles para niños en situación de pobreza y el nivel de desarrollo infantil. Bol Med Hosp Infant Mex. 2017;74:98–106.