


After the implementation of “Share 35”, several concerns arose such as the potential to increase travel distance, costs, and decreased liver availability. These elements could have a negative impact on waitlist outcomes among ethnic minorities. We aimed to determine waitlist survival after the implementation of the Share 35 policy in non-Hispanic white and Hispanic patients.
Materials and methodsWe identified non-Hispanic whites and Hispanics who were listed for liver transplantation from June 18th, 2013 to June 18, 2018. We excluded pediatric patients, patients with acute hepatic necrosis, re-transplants, multiorgan transplant, living donor, and exception cases. The primary outcome was death or removal from the waitlist due to clinical deterioration. We used competing risk analysis to compare waitlist survival between the two groups.
ResultsThere were 23,340 non-Hispanic whites and 4938 Hispanics listed for transplant. On competing risk analysis, Hispanic patients had a higher risk of being removed from the waitlist for death or clinical deterioration compared to their counterpart (SHR 1.23, 95% CI 1.13–1.34; P < 0.001).
ConclusionAfter the implementation of Share 35, disparities are still present and continue to negatively impact outcomes in minority populations especially Hispanic patients.
Liver transplant (LT) remains the definitive treatment for patients with end-stage liver disease and it is the second most common solid organ transplantation after kidney transplant worldwide [1]. Whereas the number of patients with irreversible liver injury has increased, the number of available organs has remained comparatively low creating a shortage of organs for transplantation [2]. This imbalance emphasizes the need for systems of equitable organ allocation. In 2002, the Organ Procurement and Transplantation Network (OPTN) adopted the model for end-stage liver disease (MELD) score, both for listing and recipient selection, changing the policy of organ allocation [3]. This new allocation system was aimed to ensure that patients at greatest risk for mortality are given the highest priority for transplantation [4]. Unfortunately, significant racial and ethnic disparities in waitlist outcomes have been documented during the post-MELD era and some of these disparities have been attributed to geographic differences in organ availability [5].
On June 18th, 2013, the OPTN implemented a new policy, known as “Share 35”, to reduce the number of deaths on the waitlist by increasing regional sharing of livers for patients with a MELD score ≥35 [6]. However, concerns such as the potential to increase travel distance, increased costs, and lowered liver availability in some areas of the country arose [7]. These elements could potentially negatively impact waitlist outcomes among ethnic minorities, especially Hispanics.
Therefore, we aimed to determine waitlist survival after the implementation of the Share 35 policy in non-Hispanic white and Hispanic patients. Identification of potential disparities is an important first step in developing interventions to reduce these inequalities and allows public health professionals to target populations at particular risk.
2Methods2.1Study populationThe UNOS Standard Transplant Analysis and Research (STAR) file was used to identify all patients who underwent LT from June 18th, 2013 to June 18, 2018. These dates were chosen to allow 5 years of analysis data after the implementation of Share 35 policy. We excluded pediatric patients (age <18 years), ethnicity other than Hispanic or non‐Hispanic white, patients listed as status 1, re-transplants, multiorgan transplant, living donor transplant, and those receiving MELD exception points. The study population was divided into Hispanic and non-Hispanic white based on the ethnic group provided by patients when registering on the waiting list. Our final study population included 28,278 patients. Using the same exclusion criteria, a cohort of 31,967 patients from June 18th, 2008 to June 17th, 2013, was selected in order to compare 5 years prior the implementation of Share 35. This study was exempt from institutional review board approval as it was based on an already existing dataset of deidentified information.
2.2Study variables and definitionsDemographics, including gender, age, payment source, highest educational achievement, and citizenship were compared between groups. Clinical characteristics at listing such as body mass index (BMI), blood type, primary diagnosis, history of diabetes or hepatocellular carcinoma (HCC), presence of encephalopathy, ascites, muscle wasting or spontaneous bacterial peritonitis (SBP), MELD score, and functional status were also collected. Characteristics at the time of transplant such as level of care, MELD score, time spent on the waitlist, removal from the waitlist, and distribution MELD regions were also compared between groups.
The etiology of liver disease was extracted from the primary diagnosis codes in the Scientific Registry of Transplant Recipient (SRTR) dictionary. Our study focused on the following liver disease etiologies: non‐alcoholic steatohepatitis (NASH), alcohol-related liver disease (ALD), hepatitis B (HBV), hepatitis C (HCV), cholestatic liver disease, and autoimmune hepatitis (AIH). All other diagnoses were combined into the category of “Other”. As described in previous studies, we included obese patients (body mass index ≥30 kg/m [2]) with cryptogenic cirrhosis in NASH cirrhosis [8]. Similarly, patients with HCV and ALD were categorized as HCV [9]. Patients with primary biliary cholangitis, secondary biliary cirrhosis, and primary sclerosing cholangitis were recategorized as cholestatic liver disease [10]. Among patients with HCC, the underlying liver disease was determined based on the secondary disease diagnosis codes provided to estimate the contribution of each underlying etiology to the overall LT population [11].
The primary source of payment was classified as private insurance, public insurance, and other (self, donation, free care, pending, foreign government and US/State Government Agency). Education level was divided into college degree or above, and less than college degree (included non-formal education). Citizenship status was considered as US and non‐US citizen (included resident alien and non‐resident alien). Since geographic racial and ethnic disparities in access to liver transplantation have been documented [12] we considered the median MELD score in each UNOS region as a surrogate measure of organ shortage. Regions were categorized depending on the median national MELD score at listing as either low MELD < 19 (noted on regions 1, 8, 9, and 10), or high MELD ≥19 (as seen in regions 2, 3, 4, 5, 6, 7, and 11) [13].
2.3Statistical analysisThe primary outcome was waitlist survival using the composite outcome of death or removal for clinical deterioration (United Network of Organ Sharing [UNOS] removal codes 5, 8, and 13). We compared waitlist survival among groups using competing risk analysis with liver transplantation as a competing risk.
Recipient ethnicity was used to stratify the demographics and clinical characteristics of patients listed for LT. Categorical variables were presented as frequencies and percentages and were compared using the Pearson’s chi-squared test (χ2). Continuous variables that were not normally distributed were reported as medians and interquartile range (IQR) and were analyzed with the Kruskal‐Wallis test.
Our outcomes of interest, death/delisting and transplant represented competing risks. Therefore, we built competing risk models to evaluate the cumulative incidence of death/delisting. We adjusted for recipient characteristics including age, sex, education, payment source, citizenship, comorbidities (diabetes), blood type, primary diagnosis, MELD region in which the patient was listed and MELD score at listing. The competing risk model was also used to conduct a subgroup analysis excluding those patients with MELD score < 35. All covariates had less than 5% of missing data. All statistical analyses were conducted using Stata version 14.0 (College Station, TX StataCorp LP).
3Results3.1Characteristics of the populationClinical and demographic differences between groups are displayed in Table 1. In both the pre and post-Share 35 era, non‐Hispanic white recipients accounted for the majority (83%) of the population. A greater proportion of Hispanics were female and were younger at the time of listing when compared to non-Hispanic whites. Hispanic patients also had less college education and more public insurance. They also had characteristics of more severe disease such as a greater proportion of comorbidities including diabetes (34%) and HCC (6.2%).
Baseline characteristics.
| Pre-share 35 | Post-share 35 | |||||
|---|---|---|---|---|---|---|
| Non-Hispanic whiten = 26,424 (83) | Hispanicn = 5543(17) | p value | Non-Hispanic whiten = 23,340 (83) | Hispanicn = 4938 (17.4) | p Value | |
| Gender (female), n (%) | 8924 (34) | 2011 (36) | <0.001 | 8761 (38) | 1991 (40.3) | <0.001 |
| Age, median (IQR) | 56 (51–61) | 55 (49–60) | <0.001 | 57 (50–63) | 56 (48−62) | <0.001 |
| BMI, median (IQR) | 28 (25–33) | 29 (25–33) | <0.001 | 29 (25–33) | 29 (25–33) | 0.0077 |
| BMI ≥ 30, n (%) | 10,252 (39) | 2268 (41) | 0.003 | 9525 (41) | 2066 (42) | 0.182 |
| Blood type, n (%) | <0.001 | <0.001 | ||||
| A | 10,852 (41) | 1739 (31) | 9572 (41) | 1491 (30.1) | ||
| B | 2805 (11) | 554 (10) | 2526 (11) | 513 (10.3) | ||
| AB | 1053 (4) | 113 (2) | 908 (4) | 96 (2) | ||
| O | 11,714 (44) | 3137 (57) | 10,334 (44.2) | 2838 (57.4) | ||
| Public insurance, n (%) | 10,093 (38) | 2983 (54) | <0.001 | 9906 (42.4) | 2908 (59) | <0.001 |
| College education, n (%) | 12,513 (53) | 1457 (29) | <0.001 | 12,656 (54.2) | 1475 (30) | <0.001 |
| Citizenship Non-US, n (%) | 380 (1) | 721 (13) | <0.001 | 453 (2) | 868 (18) | <0.001 |
| Comorbidities at listing, n (%) | ||||||
| Diabetes | 6442 (24) | 1748 (32) | <0.001 | 6179 (26.4) | 1673 (34) | <0.001 |
| Encephalopathy | 16,746 (63) | 3555 (64) | 0.135 | 16,332 (70) | 3256 (66) | <0.001 |
| Ascites | 20,573 (78) | 4352 (79) | 0.132 | 19,622 (84) | 4006 (81) | <0.001 |
| SBP | 1667 (6) | 424 (8) | <0.001 | 2403 (10.3) | 527 (11) | 0.007 |
| HCC diagnosis ever, n (%) | 1060 (4) | 202 (4) | 1024 (4.3) | 309 (6.2) | <0.001 | |
| Functional status at listing, n (%) | <0.001 | <0.001 | ||||
| No assistance | 9830 (37) | 1778 (32) | 5127 (22) | 983 (20) | ||
| Some assistance | 11,278 (42) | 2399 (43) | 11,132 (48) | 2471 (50) | ||
| Total assistance | 4505 (17) | 1300 (23) | 6717 (29) | 1464 (30) | ||
| Missing | 811 (3) | 66 (1) | 364 (1.5) | 20 (0.4) | ||
| Level of care at transplant, n (%) | <0.001 | <0.001 | ||||
| Outpatient | 8455 (32) | 1297 (23) | 6395 (27.4) | 879 (18) | ||
| Inpatient non-ICU | 2678 (10) | 608 (11) | 2982 (13) | 603 (12.2) | ||
| Inpatient ICU | 1356 (5) | 363 (7) | 1935 (8.2) | 600 (12.1) | ||
| Missing | 13,935 (52) | 3275 (59) | 12,028 (52) | 2856 (58) | ||
| Primary diagnosis, n (%) | ||||||
| NASH | 41,152 (16) | 773 (14) | <0.001 | 5639 (24.1) | 1105 (22.3) | 0.008 |
| ALD | 5711 (22) | 1222 (22) | 0.477 | 8099 (35) | 1614 (33) | 0.007 |
| HBV | 318 (1) | 50 (1) | 0.056 | 201 (1) | 44 (1) | 0.837 |
| HCV | 11,053 (42) | 2527 (46) | <0.001 | 4528 (19.4) | 1124 (23) | <0.001 |
| AIH | 742 (3) | 225 (4) | <0.001 | 760 (3.2) | 257 (5.2) | <0.001 |
| Cholestatic liver disease | 2138 (8) | 282 (5) | <0.001 | 1879 (8) | 324 (7) | <0.001 |
| Other | 2310 (9) | 464 (8) | 0.372 | 2234 (10) | 470 (10) | 0.907 |
| MELD score at listing, median (IQR) | 16 (12–22) | 16 (12–23) | <0.001 | 19 (14–27) | 20 (15–29) | <0.001 |
| Days on waitlist, median (IQR) | 191 (39–672) | 237 (44–813) | <0.001 | 132 (21–551) | 152 (22–643) | 0.0019 |
| MELD regions, n (%) | <0.001 | <0.001 | ||||
| Low MELD region (1, 8, 9, 10) | 7408 (28) | 1060 (19) | 6487 (28) | 845 (17.1) | ||
| High MELD region (2, 3, 4, 5, 6, 7, 11) | 19,016 (72) | 4483 (81) | 16,853 (72.2) | 4093 (83) | ||
| MELD score at transplant, median (IQR) | 20 (13–29) | 21 (14–33) | <0.001 | 23 (16–33) | 25 (16–36) | <0.001 |
| Transplanted, n (%) | 12,492 (47) | 2269 (41) | <0.001 | 11,336 (49) | 2091 (42) | <0.001 |
| Removed from waitlist for being too sick or death, n (%) | 7444 (28) | 1823 (33) | <0.001 | 5320 (23) | 1378 (28) | <0.001 |
SBP, spontaneous bacterial peritonitis. ICU, Intensive Care Unit. NASH, non-alcoholic steatohepatitis. ALD, alcohol related liver disease. HBV. hepatitis B. HCV, hepatitis C. AIH, autoimmune hepatitis. MELD, model for end-stage liver disease. IQR, interquartile range.
Patients with ALD, NASH, and HCV formed a larger proportion of the subjects undergoing liver transplantation in both eras across the two ethnic groups. In accordance with regional demographics, a greater proportion of Hispanic patients were transplanted at high MELD regions (83% vs 72%; P < 0.001) in the post-share 35, a slight increase from pre-share 35 (81% vs 72%). Finally, Hispanic recipients experienced longer median waitlist times for transplant 237 days [IQR 44-813] in the pre-share 35 era and 152 days [IQR 22‐643] in the post-share 35 era when compared to their counterparts.
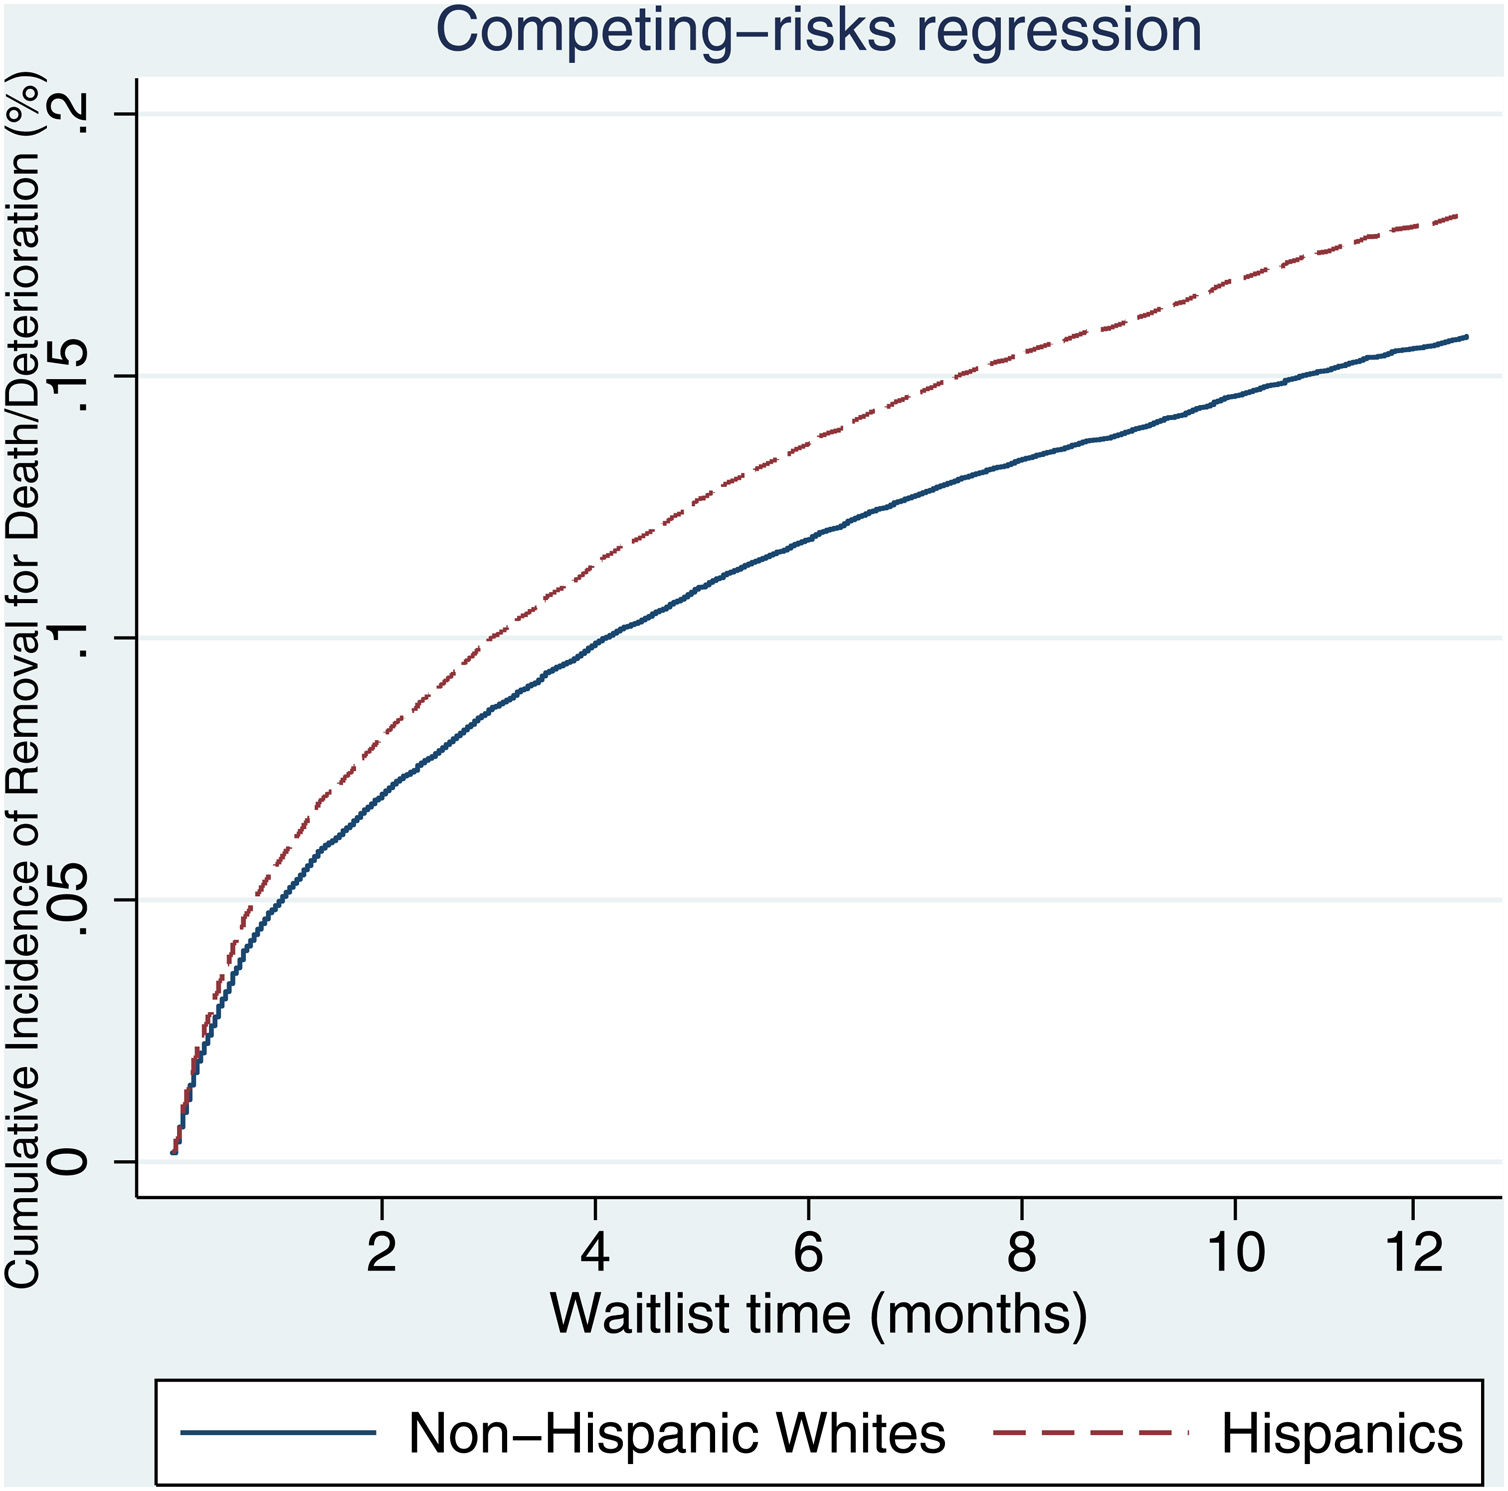
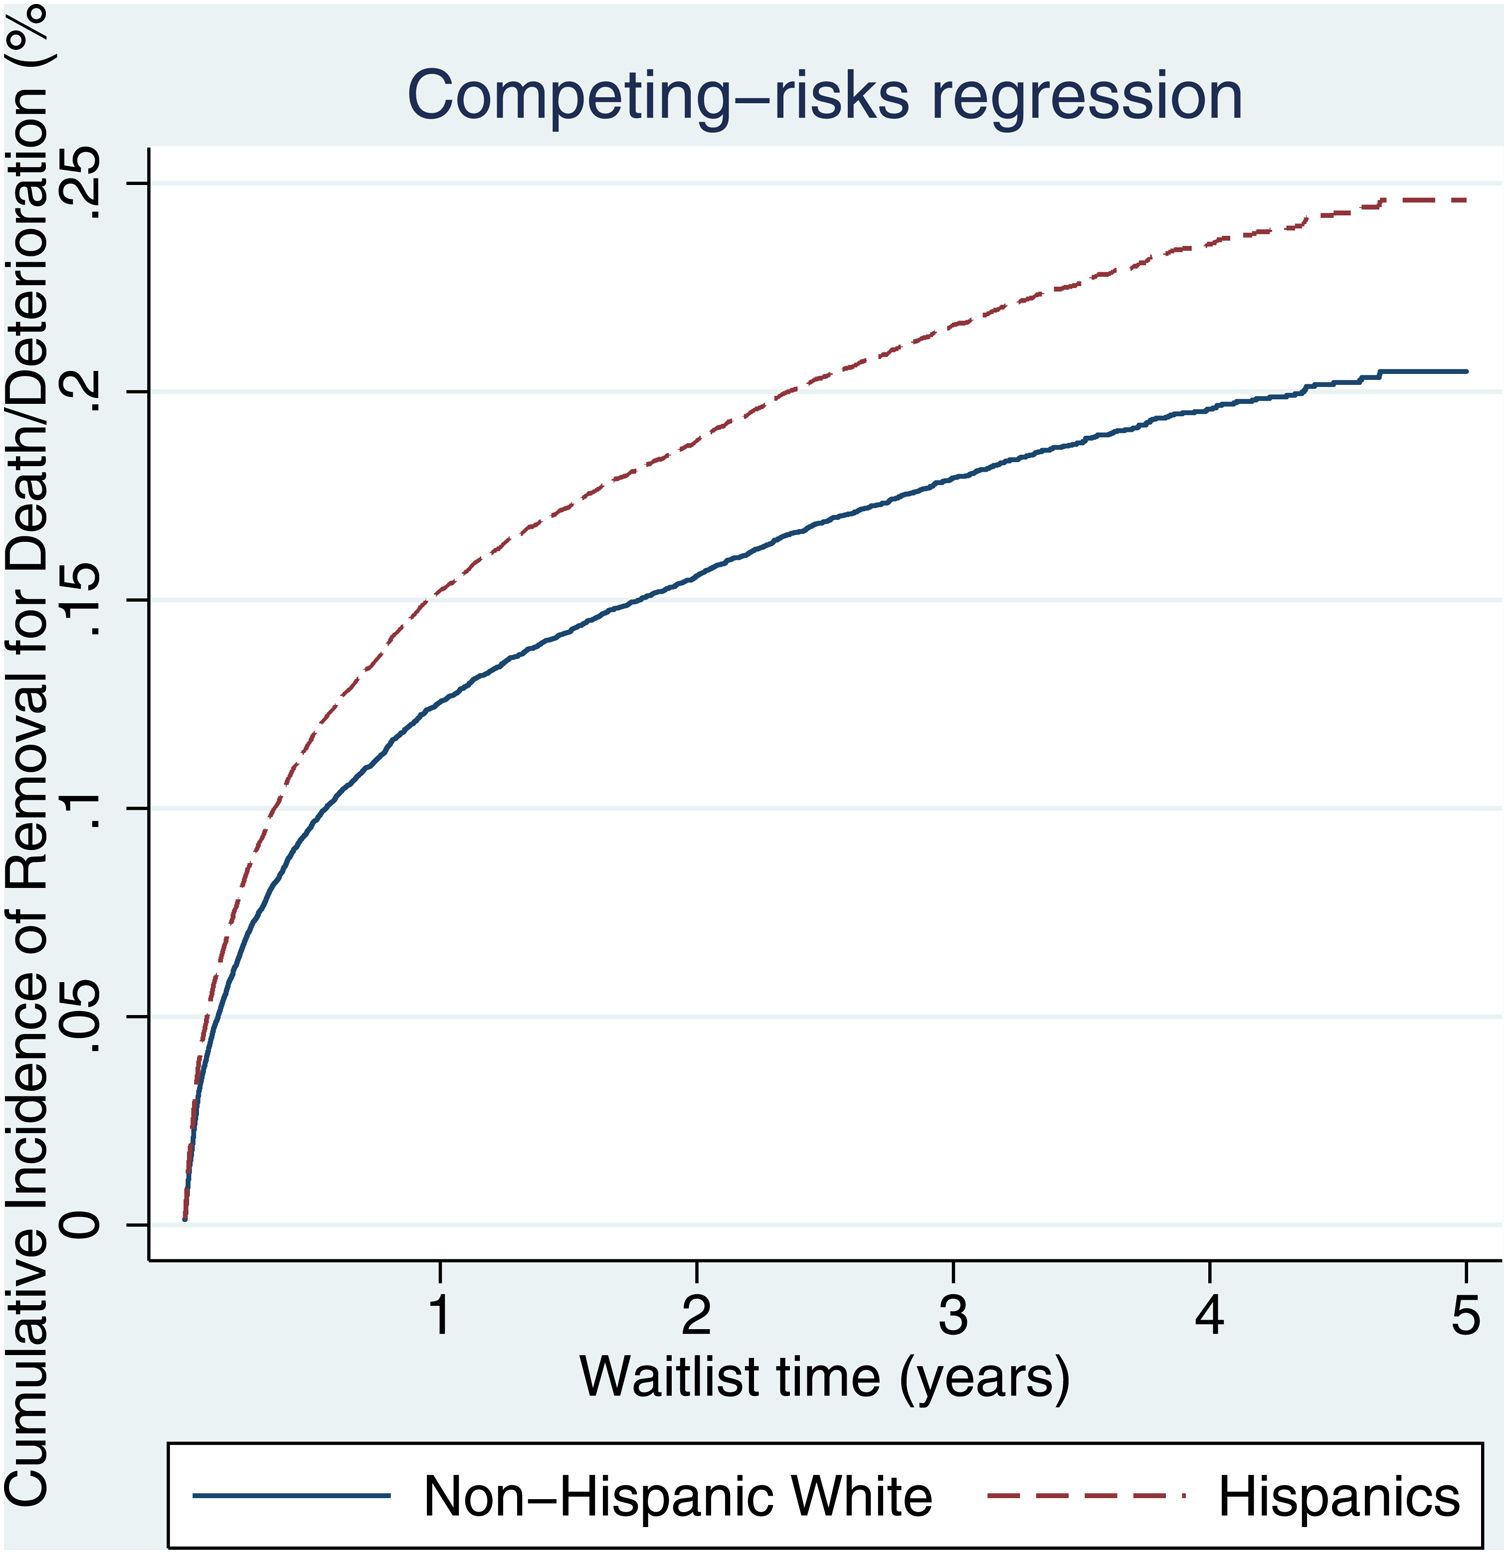
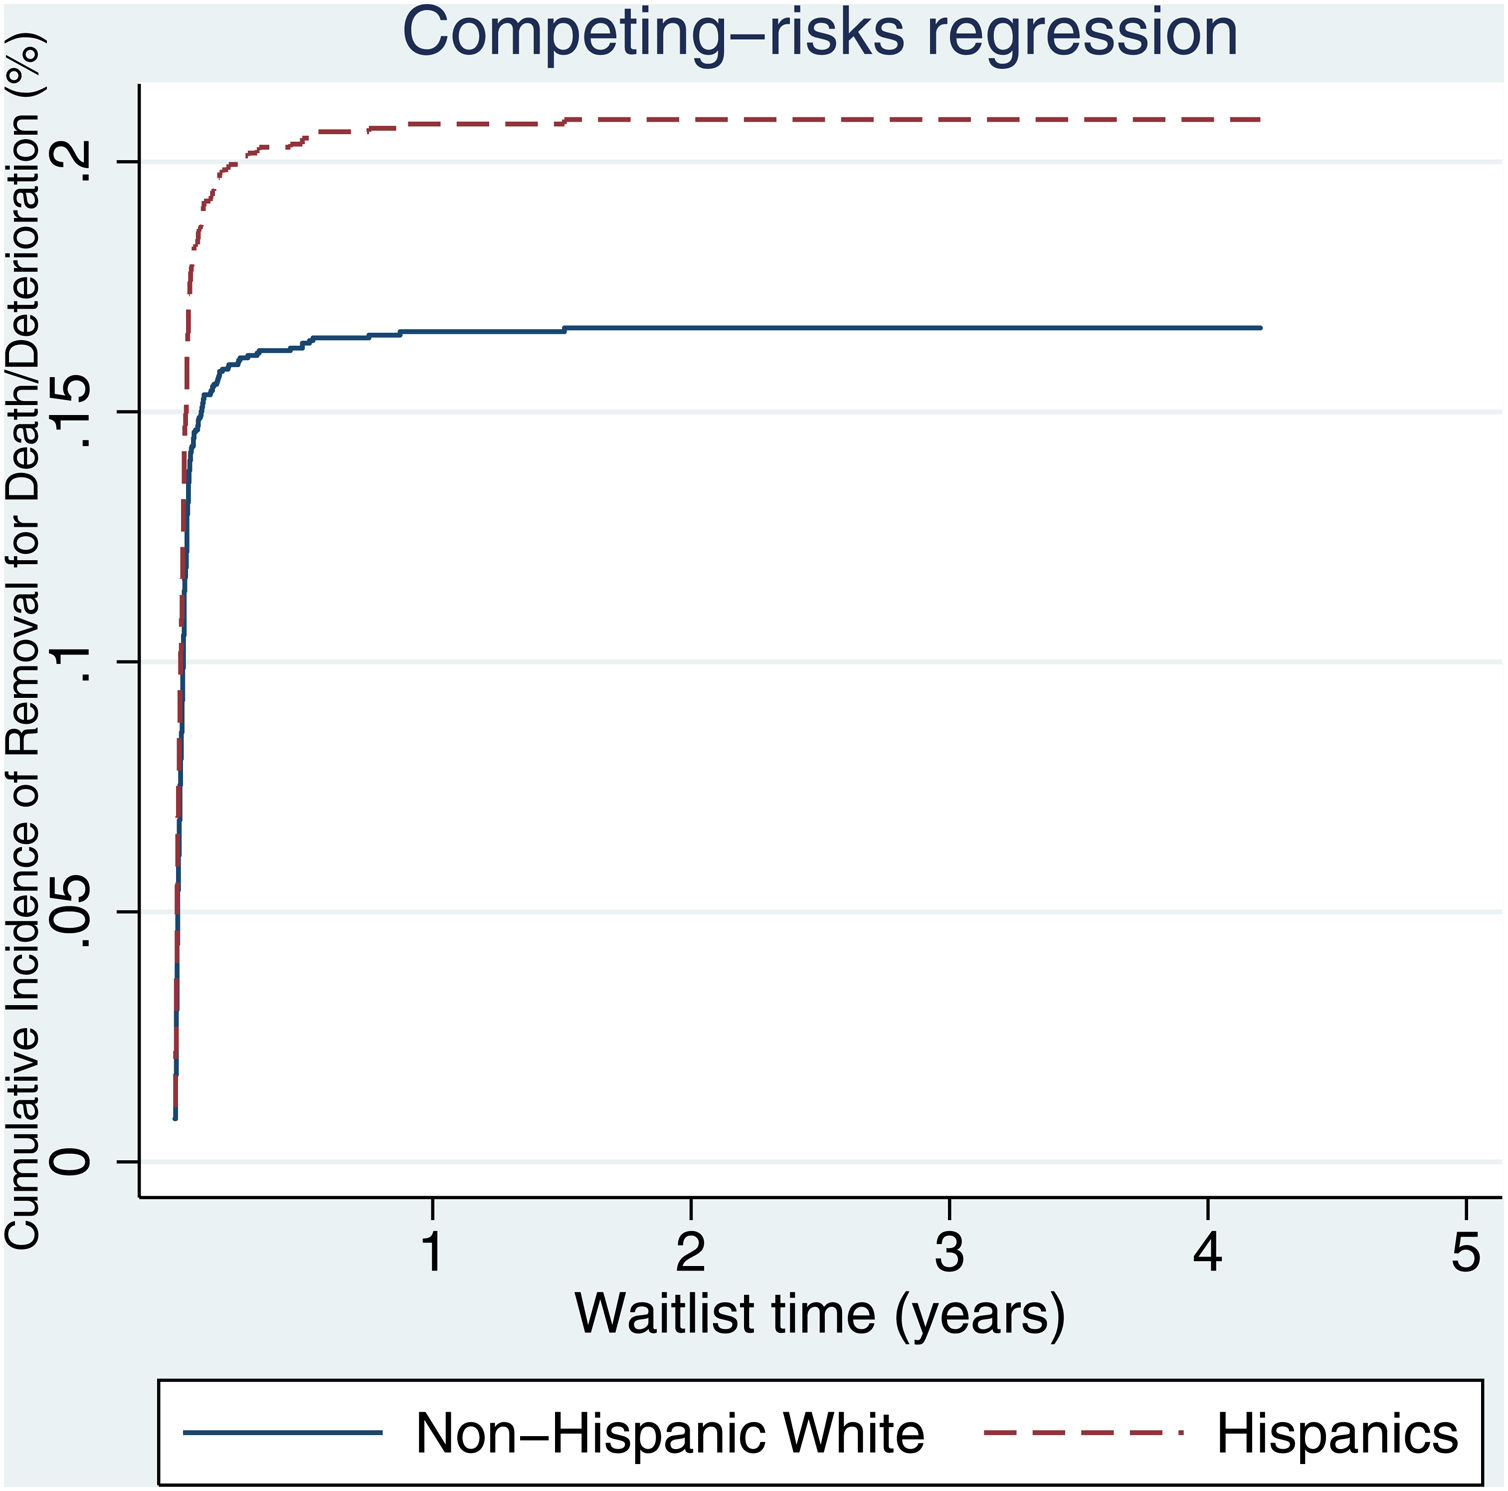
3.2Waitlist survivalOn competing risk analysis with transplant as a competing risk, Hispanic patients also had a higher risk of being removed from the waitlist for death or clinical deterioration compared to non-Hispanic whites in the pre-share 35 era (SHR 1.12, 95% CI 1.05–1.18; P < 0.001) (Fig. 1) and in the post-share 35 era (subdistribution hazard ratio [SHR] 1.23, 95% CI 1.13–1.34; P < 0.001) (Table 2, Fig. 2). Other variables associated with higher risk of the waitlist mortality on the competing risk analysis were age, diabetes, having public insurance, no-college education and a high MELD score whereas being male, having blood type B and AB were associated with lower risk of being removed from the waitlist (Table 2). Regarding geography, there was no statically significant difference in the waitlist mortality between high and low MELD score regions in the post-share 35 era. In the subgroup analysis of patients with MELD > 35, Hispanics also had a higher risk of delisting from the waitlist due to death or clinical deterioration. (SHR 1.28, 95% CI 1.01–1.61; P = 0.037) (Fig. 3, Table 3).

Competing risk analysis of time to death or waitlist removal for clinical deterioration with transplant as competing risk.
| Variables | Pre-share 35 | Post-share 35 | ||||
|---|---|---|---|---|---|---|
| SHR | 95% CI | P value | SHR | 95% CI | P value | |
| Age | 1.02 | 1.02–1.03 | <0.001 | 1.03 | 1.03–1.04 | <0.001 |
| Gender (male) | 0.82 | 0.79–0.87 | <0.001 | 0.81 | 0.76–0.86 | <0.001 |
| Comorbidities | ||||||
| Diabetes | 1.22 | 1.16–1.28 | <0.001 | 1.32 | 1.23–1.42 | <0.001 |
| No-college education | 0.93 | 0.89–0.97 | 0.005 | 1.10 | 1.03–1.18 | 0.005 |
| Payment source | ||||||
| Private | Ref | Ref | ||||
| Public | 1.21 | 1.15–1.26 | <0.001 | 1.21 | 1.13–1.30 | <0.001 |
| Other | 1.14 | 0.85–1.53 | 0.359 | 0.91 | 0.58–1.42 | 0.678 |
| Citizenship (Non-US) | 1.04 | 0.92–1.16 | 0.533 | 1.03 | 0.88–1.20 | 0.668 |
| MELD score at listing | 1.03 | 1.02–1.03 | <0.001 | 1.02 | 1.01–1.03 | <0.001 |
| MELD Region (Low) | 1.02 | 1.05–1.15 | <0.001 | 1.03 | 0.96–1.11 | 0.439 |
| Blood type | ||||||
| A | Ref | Ref | ||||
| B | 0.81 | 0.75–0.88 | <0.001 | 0.71 | 0.64–0.81 | <0.001 |
| AB | 0.47 | 0.40–0.55 | <0.001 | 0.53 | 0.42–0.66 | <0.001 |
| O | 0.97 | 0.93–1.02 | 0.322 | 0.96 | 0.89–1.03 | 0.257 |
| Primary diagnosis | ||||||
| NASH | Ref | Ref | ||||
| ALD | 0.98 | 0.91–1.06 | 0.765 | 0.97 | 0.88–1.06 | 0.493 |
| HBV | 0.84 | 0.66–1.06 | 0.156 | 0.79 | 0.52–1.19 | 0.268 |
| HCV | 1.15 | 1.07–1.22 | <0.001 | 0.99 | 0.89–1.10 | 0.866 |
| AIH | 1.07 | 0.93–1.23 | 0.312 | 1.21 | 1.01–1.44 | 0.030 |
| Cholestatic liver disease | 1.07 | 0.97–1.18 | 0.163 | 1.03 | 0.90–1.18 | 0.616 |
| Other | 1.08 | 0.98–1.18 | 0.099 | 1.44 | 1.28–1.61 | <0.001 |
| Ethnicity (Hispanics) | 1.12 | 1.05–1.18 | <0.001 | 1.23 | 1.13–1.34 | <0.001 |
MELD, model for end-stage liver disease. HCC, Hepatocellular carcinoma. NASH, non-alcoholic steatohepatitis. ALD, alcohol related liver disease. HBV. hepatitis B. HCV, hepatitis C. AIH, autoimmune hepatitis. SHR, subdistribution hazard ratio.CI, confidence interval. REF, reference.


Subgroup competing risk analysis of time to death or waitlist removal for clinical deterioration with transplant as competing risk: population with MELD score ≥ 35.
| Variables | SHR | 95% CI | P value |
|---|---|---|---|
| Age | 1.04 | 1.03–1.05 | <0.001 |
| Gender (male) | 1.02 | 0.84–1.24 | 0.837 |
| Comorbidities | |||
| Diabetes | 1.54 | 1.23–1.92 | <0.001 |
| No-college education | 0.96 | 0.78–1.17 | 0.675 |
| Payment source | |||
| Private | |||
| Public | 1.03 | 0.84–1.25 | 0.788 |
| Other | 0.32 | 0.75–1.34 | 0.120 |
| Citizenship (Non-US) | 1 | 0.67–1.47 | 0.996 |
| MELD score at listing | 1.07 | 1.05–1.10 | <0.001 |
| MELD Region (Low) | 1.37 | 1.09–1.72 | 0.006 |
| Blood type | |||
| A | |||
| B | 0.77 | 0.55–1.09 | 0.145 |
| AB | 0.60 | 0.31–1.13 | 0.116 |
| O | 0.90 | 0.74–1.10 | 0.318 |
| Primary diagnosis | |||
| NASH | |||
| ALD | 1.08 | 0.80–1.44 | 0.599 |
| HBV | 0.92 | 0.35–2.42 | 0.871 |
| HCV | 1.04 | 0.74–1.48 | 0.786 |
| AIH | 1.17 | 0.69–1.97 | 0.551 |
| Cholestatic liver disease | 1.14 | 0.72–1.82 | 0.562 |
| Other | 1.84 | 1.29–2.64 | <0.001 |
| Ethnicity (Hispanics) | 1.28 | 1.01–1.61 | 0.037 |
MELD, model for end-stage liver disease. HCC, Hepatocellular carcinoma. NASH, non-alcoholic steatohepatitis. ALD, alcohol related liver disease. HBV. hepatitis B. HCV, hepatitis C. AIH, autoimmune hepatitis. SHR, subdistribution hazard ratio.CI, confidence interval. REF, reference.
Our study has demonstrated that racial/ethnic disparities in waitlist outcomes are still present and remain an area of concern in the post-Share 35 era. These disparities extend to Hispanics who are both more likely to be removed from the waitlist and less likely to receive a transplant than their non-Hispanic white counterparts. Although previous studies have shown that Hispanic candidates appeared to fare slightly better under Share 35, their mortality was not significantly different across eras [14].
Within the constraints of a retrospective study using a large database without granular data, we provide several hypotheses for these disparities. First, Hispanic patients were listed with a higher MELD score compared to non-Hispanic whites, potentially indicating a delay in referral of these patients for transplant which may play a role in their higher rate of adverse waitlist outcomes. Such delays may be due to socioeconomic disparities like educational level or source of health care payment insurance status playing a larger role [15]. Second, we may intuitively attribute such observations to language barriers, which may impair Hispanic patients’ ability to better understand their conditions, thus making them less likely to seek medical care earlier in disease course. Third, differences in literacy and numeric skills have shown to affect individuals’ ability to obtain relevant information and their opportunity to apply that information in communications with health professionals [16]. The complexity of liver cirrhosis requires extensive self-care management that also increases the demands on patients to understand, and utilize health information [17].
Nonetheless, after accounting for these covariates, Hispanic patients remained at higher risk compared to non-Hispanic white patients by the nature of ethnicity alone. Pingitore et al. have described that a variant of the human patatin-like phospholipase domain-containing 3 (PNPLA3) gene, which encodes for a protein of 481 amino-acids, is highly expressed in the liver and strongly associated with entire spectrum of liver diseases [18]. Its mutant protein has a negative effect on triglycerides mobilization from liver droplets that leads to inflammatory infiltrate and the initial presence of fibrotic lesions [19,20]. The frequency of this variant is higher in the Hispanic population and accounts for an elevated risk for hepatic injury compared to individuals of other ethnicities [21,22]. Consequently, these inherent biologic factors could serve as an explanation of their higher waitlist mortality.
In contrast to our study, a recent study by Kaswala et al. found a lower risk of waitlist death in Hispanics compared to non-Hispanic whites (HR 0.84, 95% CI 0.79–0.90, P < 0.001) [23]. In their analysis, they used only waitlist death and not removal for clinical deterioration which generally also results in death. In addition, they used only Cox regression in their analysis and not competing risk regression which treats those who are transplanted (generally higher MELD and also higher risk of death) the same as those who are censored and does not accurately reflect the survival probability [24].
Our study also shows that a greater proportion of Hispanics are transplanted at high MELD score regions and experience longer waitlist time. However, on a competing risk analysis we found no differences in waitlist mortality between high and low MELD regions in the post-share 35 era. These results are in contrast to that of Volk et al. who found that Hispanics have not fared as well during the post-MELD era and are less likely than Caucasians to receive a transplant given that they live in transplant regions with more severe organ shortage [5]. Even though the implementation of share 35 has resulted in liver transplant being more equitable across regions, it has not addressed racial/ethnic disparities that are still present.
The strength of this study is the utilization of the competing risk analysis method, which allows the simultaneous assessment of the effects of competing risks such as waitlist removal for death or deterioration and transplant on the survival probability for each failure type. In addition, the utilization of a large database and the large scale of the study allows for a better reflection and assessment of the disparities that are currently present in the allocation of liver transplants in Hispanic populations. However, like all similar studies, this study is limited by the retrospective nature of the analysis that is limited by the available data in the UNOS database. For example, there was not available data on patient’s occupation, psychosocial characteristics or proximity to transplant centers, which have been shown in small single center studies to impact access to liver transplantation [16]. In addition, Hispanic ethnicity in our data was self‐reported and may represent a heterogeneous mix of races. Given the strong effect of race on many health outcomes, there is a risk of misclassification bias. Although the multivariate model attempts to include adjustments for potential confounders, it should be acknowledged that our study was only able to include variables that were available in SRTR and thus there remains the potential for unmeasured confounders. Finally, the SRTR database presents challenges related to accurate coding and data availability.
5ConclusionsOur study demonstrates that despite the improvement of geographic disparities with the new Share 35 policy, racial/ethnic disparities remain an area of concern. A combination of factors such as differences in socioeconomic status, health literacy, or even genetic factors potentially play an important role. Clinicians should continue to ensure patients have access to readily available translators, health care information in their native language, and social workers with experience in ethnic minorities in order to detect and avoid inequalities in the fair allocation of scarce life-saving organs.
FundingThis research did not receive any specific grant from funding agencies in the public, commercial, or not-for-profit sectors.
DisclosureThe authors declare no conflicts of interest.


