


We examined whether Mac-2-binding protein glycosylation isomer (M2BPGi) levels could be a predictive marker for the presence of esophagogastric varices (EGV) in cirrhotic patients after hepatitis C virus (HCV) eradication with direct-acting antivirals (DAAs).
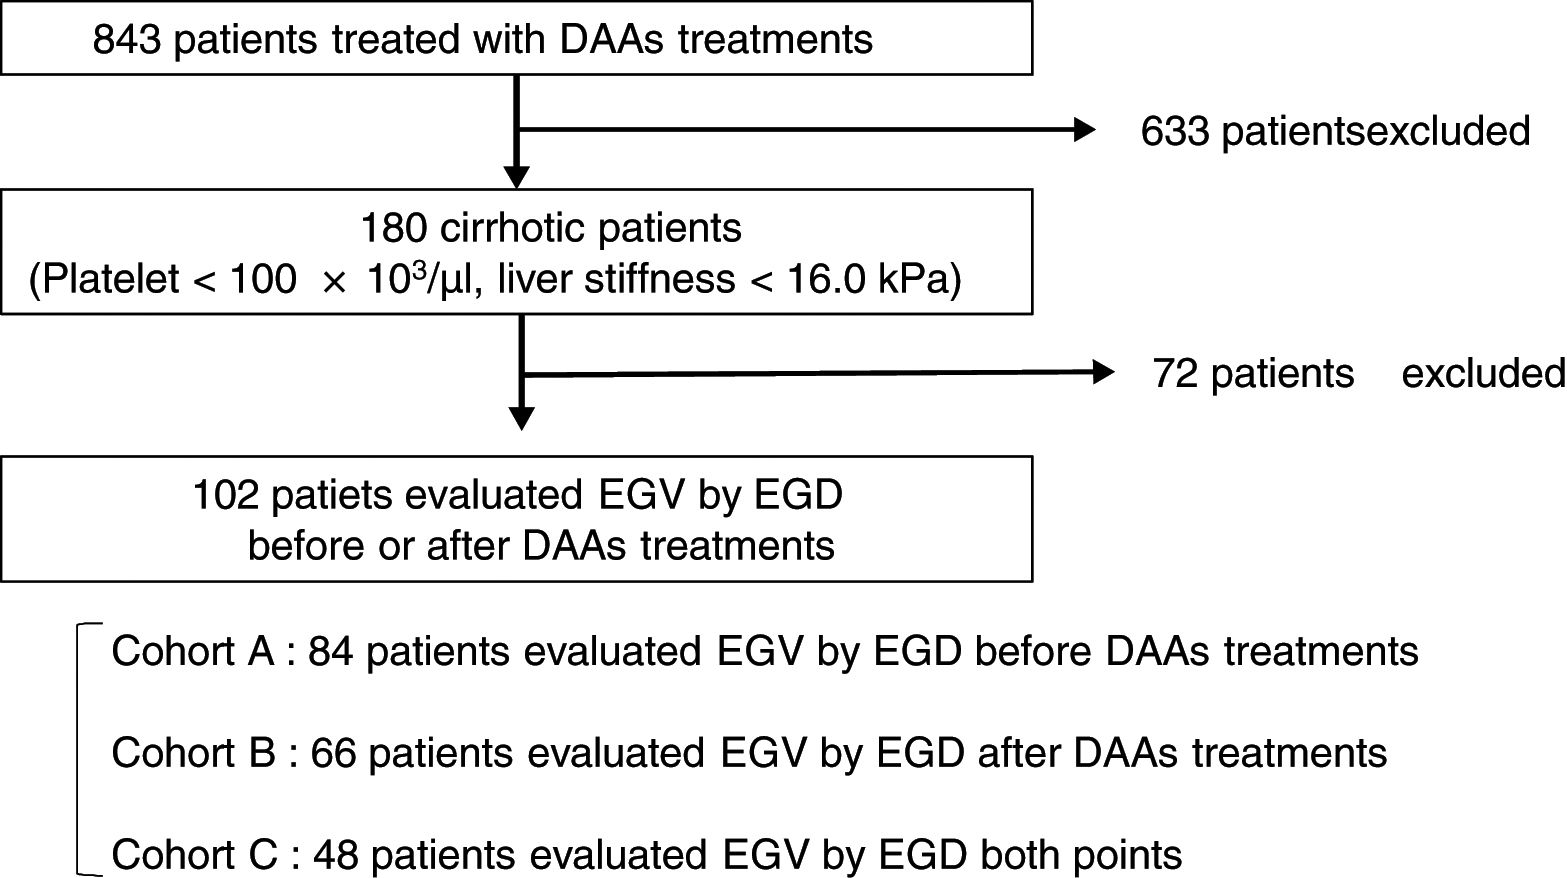
Patients and methodsA total of 102 cirrhotic patients with HCV infection treated with DAAs were enrolled. Esophagogastroduodenoscopy was performed in 84 of the patients before treatment (Cohort A), in 66 after treatment (Cohort B), and in 48 at both time points (Cohort C). We examined factors associated with EGV before and after DAA treatment.
ResultsIn Cohort A, M2BPGi levels and liver stiffness were significantly higher in the EGV-positive group than the EGV-negative group (p=0.034, and p=0.042, respectively). The proportion of EGV-positive patients with before-treatment levels of M2BPGi ≧ 7.3 C.O.I. was significantly higher than in patients with M2BPGi levels<7.3 C.O.I. (p=0.015). In Cohort B, M2BPGi levels were significantly higher in the EGV-positive group than EGV-negative group (p=0.003). The proportion of EGV-positive patients with after-treatment levels of M2BPGi ≧ 3.4 C.O.I. was significantly higher than in patients with M2BPGi levels<3.4C.O.I. (p=0.001). In Cohort C, M2BPGi levels decreased during DAA treatment regardless of EGV development, but there was no significant difference in the reduction of M2BPGi among the EGV-improvement, EGV-invariant, and EGV-exacerbation groups (p=0.659).
ConclusionsM2BPGi levels may be a novel serum marker for the presence of EGV before and after DAA treatment.
Chronic hepatitis C virus (HCV) infection is associated with significant morbidity and mortality due to liver cirrhosis and hepatocellular carcinoma (HCC). Current therapies with direct-acting antiviral agents (DAAs) result in high rates of sustained virological response (SVR), generally exceeding 90% [1,2]. In addition, DAAs improve liver function even in advanced cirrhotic patients [3–7]. However, it has been reported that HCC develops in cirrhotic patients even if SVR is achieved [8,9].
Another important issue in cirrhotic patients is portal hypertension. A recent study showed that hepatic wedge pressure decreased in SVR patients compared with before treatment [10–12]. However, esophagogastric varices (EGV), a potentially fatal complication, has not been sufficiently evaluated in SVR patients. Among SVR patients treated with interferon (IFN)-based therapies, the incidence of de novo EGV decreases and portal hypertension improves [13,14]. However, few studies have evaluated patients after achieving SVR using IFN-free DAA treatment [11,15]. Clinically, after DAA treatment, there have been reports of persistent portal hypertension and EGV [11]. Thus, it is important for cirrhotic patients to undergo EGV monitoring even after achieving SVR.
Esophagogastroduodenoscopy (EGD) is the most reliable tool for evaluating EGV and should be performed periodically in cirrhotic patients after achieving SVR [17–19]. However, EGD poses a physical and economic burden on patients. Some patients refuse EGD despite understanding the importance of the procedure. Therefore, a noninvasive examination that can replace EGD is required.
Several reports have identified noninvasive variables that could predict the presence of EGV, such as platelet count, albumin concentration, spleen, and liver stiffness measured by elastography, as well as ultrasonographic parameters including splenomegaly and portal vein diameter [16,20–25]. However, elastography and ultrasonographic techniques are not as useful in patients with obesity due to decreased reproducibility [26]. Platelet count and albumin in nonalcoholic fatty liver disease (NAFLD) patients are higher than in HCV patients with advanced fibrosis [27,28]. Since the number of obese and NAFLD patients is increasing, a novel reliable marker is required to predict EGV.
Serum Mac-2-binding protein glycosylation isomer (M2BPGi) has been reported as a novel serum marker for assessing liver fibrosis in chronic viral hepatitis C patients [9,29–32]. However, the association between M2BPGi and EGV has not been explored. The aim of this study was to evaluate M2BPGi as a serum marker of EGV in cirrhotic patients receiving IFN-free DAA treatment.
2Patients and methods2.1PatientsThis is a retrospective study of 180 cirrhotic patients, among 843 patients with chronic HCV infection receiving antiviral therapy with an IFN-free DAA treatment in Osaka City University Hospital from September 2014 to March 2017. The cirrhosis was clinically diagnosed by each attending physician based on platelet counts of under 100×103/μl or liver stiffness of 16.0kPa, as measured by transient elastography (FibroScan®) [33]. Among 180 patients, 102 patients underwent EGD for screening EGV before or after DAA treatment. This study was conducted according to the guidelines of the Declaration of Helsinki. Written informed consent was obtained from all patients prior to treatment. The study protocol was approved by the Ethics Committee of Osaka City University Hospital (No. 3685).
2.2Laboratory and ultrasonographic examinationsLiver stiffness, spleen index calculated as [(maximum width)×(maximum length)] of the spleen [34] aspartate aminotransferase (AST), alanine aminotransferase (ALT), platelet count, albumin, bilirubin, prothrombin time (PT), M2BPGi, ammonia (NH3), fibrosis-4 (FIB-4) index, and AST-to-platelet ratio index (APRI) could discriminate patients at the start and end of IFN-free DAA treatment. The FIB-4 index and APRI were also calculated [35,36].
2.3Esophagogastric varices evaluationEGV was evaluated using EGD in 84 patients (82%) before treatment in Cohort A, in 66 (65%) after treatment in Cohort B, and in 48 (47%) at both time points in Cohort C (Fig. 1). All EGD procedures were performed by well-trained endoscopists within 1 year before the start and end of DAA treatment. EGV were described according to the JGES classification; F0, no varicose appearance; F1, straight, small-caliber varies; F2, moderately enlarged, beady varies; and F3, markedly enlarged, nodular, or tumor-shaped varices [37,38]. We divided patients into two groups: an EGV-positive group (F1/F2/F3, red-color sign positive, or history of treatment for varices) and an EGV-negative group (F0). Furthermore, in Cohort C we compared the F factor of EGV before and after DAA treatment and divided patients into three groups: EGV-improvement, EGV-invariant, and EGV exacerbation groups.
2.4Measurement of serum Wisteria floribunda agglutinin positive M2BPGi levels
M2BPGi was measured by sandwich immunoassay with anti-WFA and anti-M2BP antibodies using the fully automatic immunoanalyzer, HISCL-2000i (Sysmex Co., Tokyo, Japan), as described previously [30]. M2BPGi values conjugated to WFA were indexed with scored values using the following equation: Cutoff index (C.O.I)=([M2BPGi] sample−[M2BPGi] NC)/([M2BPGi] PC−[M2BPGi] NC), where [M2BPGi] sample is the M2BPGi level in the serum sample, PC is the positive control, and NC is negative control. The positive control was supplied as a calibration solution preliminarily standardized to yield a cutoff value of 1.0 [32].
2.5Statistical analysisStatistical analysis was performed with EZR software (ver. 1.37; Saitama Medical Center, Jichi Medical University, Saitama, Japan). Data are expressed as the mean±standard deviation (SD) or as numbers. Patient characteristics were evaluated using the Wilcoxon signed-rank test. The characteristics of patients before and after treatment, and the factors associated with EGV, were compared using a Mann–Whitney U test. Details of EGV were evaluated using the Fisher test. To compare the reduction in M2BPGi, the Kruskal–Wallis test was used. The utility of M2BPGi levels for diagnosing EGV was assessed using time-dependent receiver operating characteristic (ROC) curves. Values of p<0.05 were considered statistically significant.
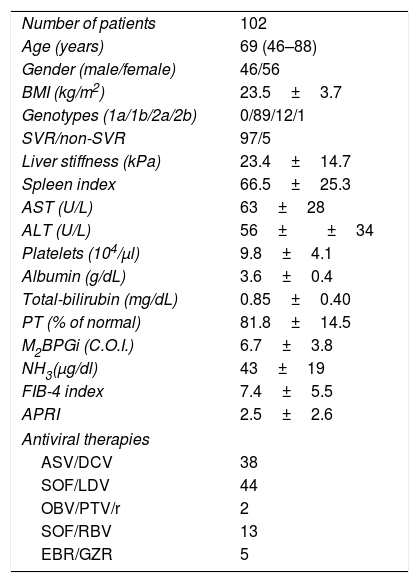
3Results3.1Baseline patient characteristicsPatient characteristics are shown in Table 1. The subjects consisted of 46 males and 56 females, aged 46–88 years (median age, 69 years). SVR was achieved in 97 (95.1%) of 102 patients. Treatment regimens of IFN-free DAA were as follows: 38 patients received 24 weeks of asunaprevir (ASV) and daclatasvir (DCV); 44 patients received 12 weeks of sofosbuvir (SOF) and ledipasvir (LDV); 2 patients received 12 weeks of ombitasvir (OBV) and paritaprevir (PTV) in combination with ritonavir; 13 patients received 12 weeks of SOF and ribavirin (RBV); and 5 patients received 12 weeks of elbasvir (EBR) and grazoprevir (GZR).
Baseline patient characteristics.
| Number of patients | 102 |
| Age (years) | 69 (46–88) |
| Gender (male/female) | 46/56 |
| BMI (kg/m2) | 23.5±3.7 |
| Genotypes (1a/1b/2a/2b) | 0/89/12/1 |
| SVR/non-SVR | 97/5 |
| Liver stiffness (kPa) | 23.4±14.7 |
| Spleen index | 66.5±25.3 |
| AST (U/L) | 63±28 |
| ALT (U/L) | 56±±34 |
| Platelets (104/μl) | 9.8±4.1 |
| Albumin (g/dL) | 3.6±0.4 |
| Total-bilirubin (mg/dL) | 0.85±0.40 |
| PT (% of normal) | 81.8±14.5 |
| M2BPGi (C.O.I.) | 6.7±3.8 |
| NH3(μg/dl) | 43±19 |
| FIB-4 index | 7.4±5.5 |
| APRI | 2.5±2.6 |
| Antiviral therapies | |
| ASV/DCV | 38 |
| SOF/LDV | 44 |
| OBV/PTV/r | 2 |
| SOF/RBV | 13 |
| EBR/GZR | 5 |
Abbreviations: BMI, body mass index; SVR, sustained virological response; AST, aspartate aminotransferase; ALT, alanine aminotransferase; PT, prothrombin time; M2BPGi; Wisteria floribunda agglutinin positive MAC-2-binding protein, NH3, ammonia; FIB-4 index, fibrosis-4 index; APRI, AST-to-platelet ratio index; ASV, asunaprevir; DCV, daclatasvir; SOF, sofosbuvir; LDV, ledipasvir; OBV, ombitasvir; PTV, paritaprevir; RBV, ribavirin; EBV, elbasvir; GZR, grazoprevir.
Data are shown as mean±SD (range).
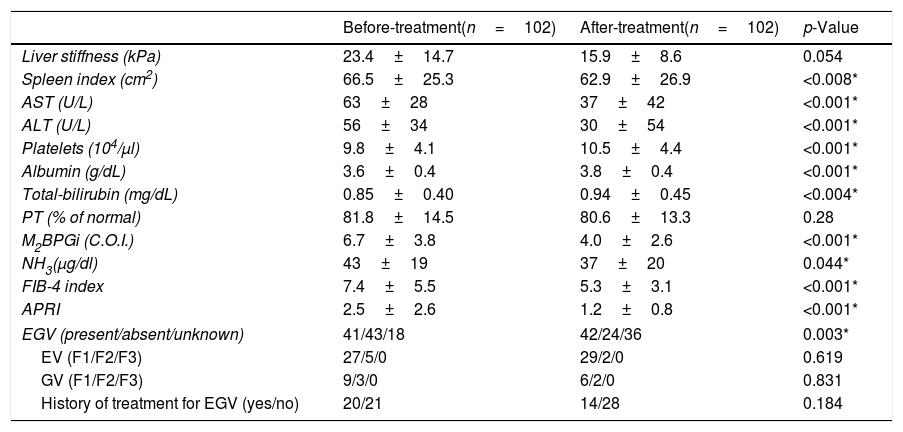
Table 2 shows patient characteristics before and after DAA treatment. There were significant improvements in the spleen index (p<0.008), AST (p<0.001), ALT (p<0.001), platelet count (p<0.001), albumin (p<0.001), M2BPGi (p<0.001), NH3 (p=0.044), FIB-4 index (p<0.001), and APRI (p<0.001) after treatment compared to before treatment. There was a trend toward an improvement in liver stiffness, and was no significant change in PT (p=0.054 and p=0.28, respectively). Although Total-bilirubin levels increased after DAA treatment, it was a change within the normal range (p=0.004).
Comparison of patient characteristics before and after DAA treatment.
| Before-treatment(n=102) | After-treatment(n=102) | p-Value | |
|---|---|---|---|
| Liver stiffness (kPa) | 23.4±14.7 | 15.9±8.6 | 0.054 |
| Spleen index (cm2) | 66.5±25.3 | 62.9±26.9 | <0.008* |
| AST (U/L) | 63±28 | 37±42 | <0.001* |
| ALT (U/L) | 56±34 | 30±54 | <0.001* |
| Platelets (104/μl) | 9.8±4.1 | 10.5±4.4 | <0.001* |
| Albumin (g/dL) | 3.6±0.4 | 3.8±0.4 | <0.001* |
| Total-bilirubin (mg/dL) | 0.85±0.40 | 0.94±0.45 | <0.004* |
| PT (% of normal) | 81.8±14.5 | 80.6±13.3 | 0.28 |
| M2BPGi (C.O.I.) | 6.7±3.8 | 4.0±2.6 | <0.001* |
| NH3(μg/dl) | 43±19 | 37±20 | 0.044* |
| FIB-4 index | 7.4±5.5 | 5.3±3.1 | <0.001* |
| APRI | 2.5±2.6 | 1.2±0.8 | <0.001* |
| EGV (present/absent/unknown) | 41/43/18 | 42/24/36 | 0.003* |
| EV (F1/F2/F3) | 27/5/0 | 29/2/0 | 0.619 |
| GV (F1/F2/F3) | 9/3/0 | 6/2/0 | 0.831 |
| History of treatment for EGV (yes/no) | 20/21 | 14/28 | 0.184 |
Abbreviations: AST, aspartate aminotransferase; ALT, alanine aminotransferase; PT, prothrombin time; M2BPGi; Wisteria floribunda agglutinin positive MAC-2-binding protein, NH3, ammonia; FIB-4 index, fibrosis-4 index; APRI, AST-to-platelet ratio index; EGV, esophageal-gastro varices; EV, esophageal varices; GV, gastric varices.
Data are shown as the mean±SD.
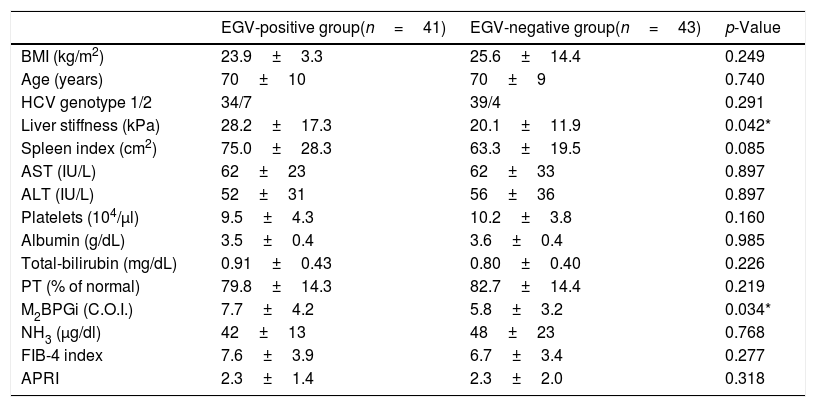
In Cohort A, 84 patients underwent EGD before DAA treatment. The EGV-positive group consisted of 41 patients and the EGV-negative group had 43 patients. In the EGV-positive group, 32 patients had esophageal varices (EV) (F1/F2/F3, 27/5/0), 12 had gastric varices (GV) (F1/F2/F3, 9/3/0), and 20 had a history of EGV treatment before DAA treatment.
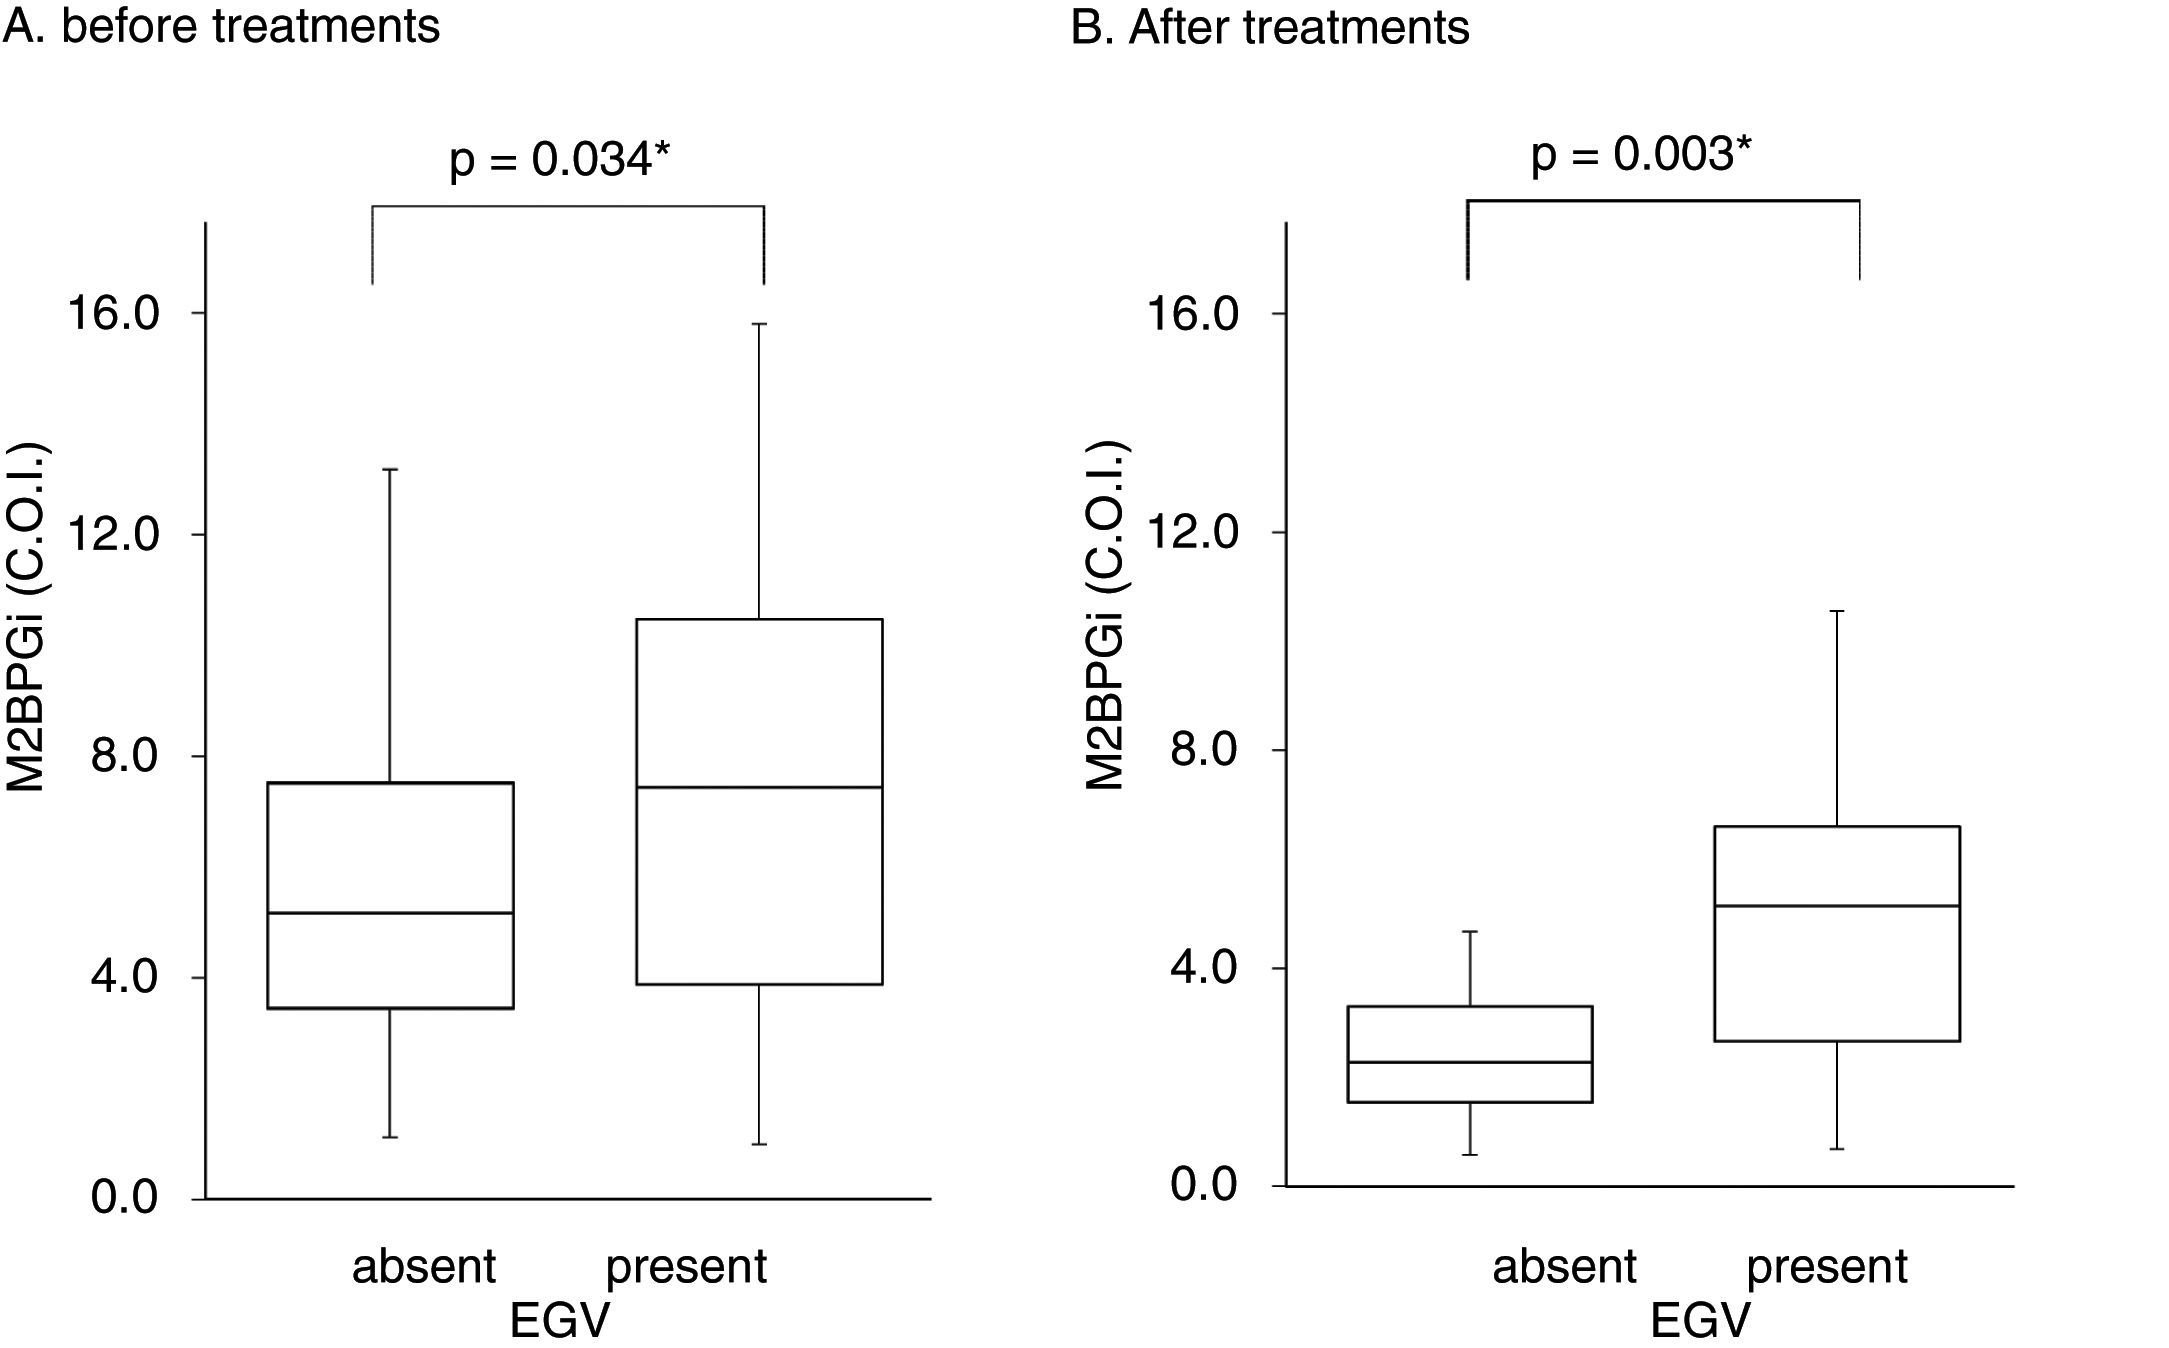
Table 3 shows factors associated with EGV before DAA treatment. Liver stiffness (28.2±17.3 vs 20.1±11.9kPa, p=0.042) and M2BPGi levels (7.7±4.2 vs 5.8±3.2C.O.I., p=0.034) in the EGV-positive group were significantly higher than in the EGV-negative group. Fig. 2A shows an association between M2BPGi levels and EGV before DAA treatment. To investigate the before-treatment level of M2BPGi to predict EGV, ROC analysis was performed. The area under the ROC curve (AUROC) for M2BPGi levels was 0.63. The cut-off value for before-treatment levels of M2BPGi was 7.3 C.O.I. Among patients with before-treatment levels of M2BPGi ≧ 7.3 C.O.I., the proportion of those with EGV was significantly higher than in those with levels of M2BPGi<7.3 C.O.I. (21/32 and 19/50, respectively; sensitivity, 52%; specificity, 74%, p=0.015).
Factors associated with varices before DAA treatment (Cohort A).
| EGV-positive group(n=41) | EGV-negative group(n=43) | p-Value | |
|---|---|---|---|
| BMI (kg/m2) | 23.9±3.3 | 25.6±14.4 | 0.249 |
| Age (years) | 70±10 | 70±9 | 0.740 |
| HCV genotype 1/2 | 34/7 | 39/4 | 0.291 |
| Liver stiffness (kPa) | 28.2±17.3 | 20.1±11.9 | 0.042* |
| Spleen index (cm2) | 75.0±28.3 | 63.3±19.5 | 0.085 |
| AST (IU/L) | 62±23 | 62±33 | 0.897 |
| ALT (IU/L) | 52±31 | 56±36 | 0.897 |
| Platelets (104/μl) | 9.5±4.3 | 10.2±3.8 | 0.160 |
| Albumin (g/dL) | 3.5±0.4 | 3.6±0.4 | 0.985 |
| Total-bilirubin (mg/dL) | 0.91±0.43 | 0.80±0.40 | 0.226 |
| PT (% of normal) | 79.8±14.3 | 82.7±14.4 | 0.219 |
| M2BPGi (C.O.I.) | 7.7±4.2 | 5.8±3.2 | 0.034* |
| NH3 (μg/dl) | 42±13 | 48±23 | 0.768 |
| FIB-4 index | 7.6±3.9 | 6.7±3.4 | 0.277 |
| APRI | 2.3±1.4 | 2.3±2.0 | 0.318 |
Abbreviations: BMI, body mass index; AST, aspartate aminotransferase; ALT, alanine aminotransferase; PT, prothrombin time; M2BPGi; Wisteria floribunda agglutinin positive MAC-2-binding protein, NH3, ammonia; FIB-4 index, fibrosis-4 index; APRI, AST-to-platelet ratio index.
Data are shown as the mean±SD values.
 values in the patients before (A) and after (B) treatment. Box areas indicate interquartile range, and horizontal bars in the interquartile range indicate median value. Whiskers represent the minimum and maximum values. M2BPGi levels were higher in the EGV-positive group than in the EGV-negative group before and after treatment (p=0.034, p=0.003). *p<0.05.")
Serum M2BPGi values associated with EGV before and after treatment. The Box and whisker charts of Serum Mac-2-binding protein glycosylation isomer (M2BPGi) values in the patients before (A) and after (B) treatment. Box areas indicate interquartile range, and horizontal bars in the interquartile range indicate median value. Whiskers represent the minimum and maximum values. M2BPGi levels were higher in the EGV-positive group than in the EGV-negative group before and after treatment (p=0.034, p=0.003). *p<0.05.
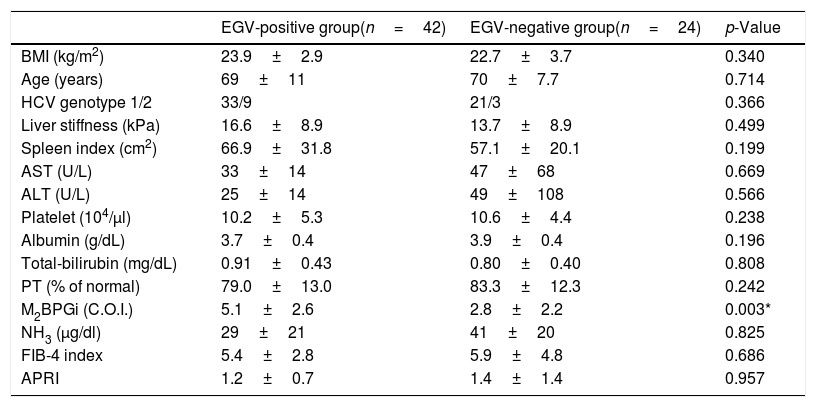
In Cohort B, 66 patients underwent EGD after DAA treatment. The EGV-positive group consisted of 42 patients and the EGV-negative group had 24 patients. In the EGV-positive group, 31 patients had EV (F1/F2/F3, 29/2/0), 8 had GV (F1/F2/F3, 6/2/0), and 14 had a history of EGV treatment before DAA treatment.
Table 4 shows the factors associated with EGV after DAA treatment. M2BPGi in the EGV-positive group was significantly higher than in the EGV-negative group after treatment (5.1±2.6 and 2.8±2.2 C.O.I., respectively, p=0.003). Fig. 2B shows an association between M2BPGi levels and EGV after DAA treatment. The AUROC for M2BPGi levels was 0.76 and the cut-off for after-treatment levels of M2BPGi for prediction of EGV was 3.4C.O.I. In patients with after-treatment levels of M2BPGi ≧ 3.4C.O.I., the proportion of those with EGV was significantly higher than that without EGV, among patients with levels of M2BPGi<3.4 C.O.I. (21/25 and 9/23, respectively; sensitivity, 70%; specificity, 78%, p=0.001).
Factors associated with varices after DAA treatment (Cohort B).
| EGV-positive group(n=42) | EGV-negative group(n=24) | p-Value | |
|---|---|---|---|
| BMI (kg/m2) | 23.9±2.9 | 22.7±3.7 | 0.340 |
| Age (years) | 69±11 | 70±7.7 | 0.714 |
| HCV genotype 1/2 | 33/9 | 21/3 | 0.366 |
| Liver stiffness (kPa) | 16.6±8.9 | 13.7±8.9 | 0.499 |
| Spleen index (cm2) | 66.9±31.8 | 57.1±20.1 | 0.199 |
| AST (U/L) | 33±14 | 47±68 | 0.669 |
| ALT (U/L) | 25±14 | 49±108 | 0.566 |
| Platelet (104/μl) | 10.2±5.3 | 10.6±4.4 | 0.238 |
| Albumin (g/dL) | 3.7±0.4 | 3.9±0.4 | 0.196 |
| Total-bilirubin (mg/dL) | 0.91±0.43 | 0.80±0.40 | 0.808 |
| PT (% of normal) | 79.0±13.0 | 83.3±12.3 | 0.242 |
| M2BPGi (C.O.I.) | 5.1±2.6 | 2.8±2.2 | 0.003* |
| NH3 (μg/dl) | 29±21 | 41±20 | 0.825 |
| FIB-4 index | 5.4±2.8 | 5.9±4.8 | 0.686 |
| APRI | 1.2±0.7 | 1.4±1.4 | 0.957 |
Abbreviations: BMI, body mass index; AST, aspartate aminotransferase; ALT, alanine aminotransferase; PT, prothrombin time; M2BPGi; Wisteria floribunda agglutinin positive MAC-2-binding protein, NH3, ammonia; FIB-4 index, fibrosis-4 index; APRI, AST-to-platelet ratio index.
Data are shown as mean±SD values.
In Cohort C, 48 patients evaluated for EGV by EGD before and after DAA treatment were divided into three groups according to the morphological change of EGV, i.e., the change of F factor: EGV improvement group (n=9), EGV invariant group (n=32), and EGV exacerbation group (n=7). We excluded eight patients with a history of EGV treatment during DAA treatment. Among the 40 patients, 29 had M2BPGi data at both times, and the others did not have the data because paired serum was not left. In all three groups, namely, the improvement group (n=4), invariant group (n=21), and exacerbation group (n=4), after-treatment levels of M2BPGi were lower than before-treatment levels. We analyzed the decrease in M2BPGi during DAA treatment in the improvement, invariant and exacerbation groups to explore the association with EGV changes, and found no significant difference among them (−3.48±1.92, −2.99±2.36, and −2.1±2.30C.O.I., respectively; p=0.659).
4DiscussionOur study showed that M2BPGi levels could serve as a noninvasive serum marker for the presence of EGV. This is the first report showing the association between EGV and M2BPGi levels in cirrhotic patients treated with DAA.
M2BPGi was associated with the stage of hepatic fibrosis in patients with chronic viral hepatitis, NAFLD, and primary biliary cholangitis, and in particular with chronic hepatitis C [29]. In addition, M2BPGi was a marker for HCC in patients with chronic hepatitis C [39], and HCC in patients who have achieved SVR with DAAs [9]. In our study, we observed associations between M2BPGi and liver stiffness, the FIB-4 index, APRI before treatments, and the FIB-4 index, APRI after treatment (data not shown). Our results confirmed that M2BPGi was associated with hepatic fibrosis markers in cirrhotic patients, and with EGV. It was reported that FIB-4 index is reliable liver fibrosis marker. However, FIB-4 index was reported to be useful marker for distinguishing low fibrosis from fibrosis stage F0-F1 to F2 [40]. EGV are observed in patients with more advanced fibrosis stage. Therefore, it was considered that FIB-4 index was not related to EGV in this study. In addition, it was reported that M2BPGi levels were associated with atherosclerosis [41] or pulmonary fibrosis [42]. Although we did not examine atherosclerosis or pulmonary hypertension in this study, EGV might be associated not only with liver fibrosis but also in conditions causing them. Therefore, we consider that only M2BPGi, but not other fibrosis markers such as FIB-4 index and APRI, was associated with EGV.
Previous studies have reported that laboratory tests, such as platelet count and albumin, were predictive serum markers of EGV [20,21]. However, we did not observe a significant association between these laboratory tests and EGV before or after treatment. These results suggest that M2BPGi was a more reliable serum marker for screening of early stage EGV than the platelet count and albumin. In general, platelet count and albumin do not decrease in compensated cirrhotic patients. Patients with decompensated cirrhosis were not enrolled in the previous study. In the study, patients with EV showed a median platelet count of 8.5×10⁴/μl and median albumin of 3.3g/dL. A total of 71 patients had small EV (F1) and 47 had a large EV (F2/F3) [23]. Compared to the report, platelet count and albumin levels were higher in our study. In addition, only 15.6% (5/32) and 6.5% (2/31) of patients showed F2 or F3 of EV before and after treatment, respectively, which was associated with severe portal hypertension in our patients. Therefore, it is possible that only M2BPGi was associated with EGV.
Several non-invasive imaging tests have been proposed for EGV screening. Elastography has been reported to be a useful tool for EGV [22–24]. In the present study, liver stiffness by elastography was associated with EGV before DAA therapy. However, it was difficult to evaluate this relationship after DAA therapy because of the small number of patients. Spleen stiffness by transient elastography [24] and portal vein diameter measurements by ultrasonography [21] are also reported to be useful to evaluate EGV. However, in patients with ascites, obesity, or gastrointestinal gas, it is difficult to obtain consistent results [21,24].
Next, we compared EGV between pre-DAA and post-DAA. Some patients showed improved EGV after DAA therapy. Previous IFN-based studies showed that EGV was not improved in patients who achieved SVR [12,43]. Overall, EGD was checked once every 2–3 years in patients with EGV after IFN-based treatments, and EGV persisted in 32/41 patients for a median 7.6 years [43]. Although some cirrhotic patients achieved SVR after IFN-based therapy, DAA could increase the proportion of patients achieving SVR. In Cohort C, the decrease in M2BPGi was lower according to the morphological exacerbation of EGV (EGV exacerbation group<EGV invariant group<EGV improvement group). There was no significant relationship between changes in M2BPGi and EGV exacerbation or improvement. The follow-up period of our study was within 1 year before treatment to 1 year after treatment, and was not long enough to evaluate changes in EGV.
Our study had several limitations. First, the number of enrolled patients in our cohort was small. Because DAA therapy was only approved in July 2014 and the observation period of cirrhotic patients treated with DAAs (within 1 year before treatment to 1 year after treatment) is relatively short, some cirrhotic patients are not undergoing EGV screening. Second, in Japan, DAA regimens were not permitted for cirrhotic patients with Child–Pugh stage B and C until February 2019. Thus, we could not evaluate-EGV in decompensated cirrhotic patients. Third, the dates of EGV screening, liver stiffness and spleen index measurements, and laboratory examinations differed because the physical and mental burden of patients was high if all examinations are performed on the same day.
In conclusion, the M2BPGi level could be a new serum marker for the presence of EGV development before and after DAA treatment. This novel surrogate marker for EGV can identify patients that require EGD.AbbreviationsM2BPGi Mac-2-binding protein glycosylation isomer esophagogastric varices hepatitis C virus direct-acting antiviral agents sustained virologic response hepatocellular carcinoma interferon esophagogastroduodenoscopy nonalcoholic fatty liver disease aspartate aminotransferase alanine aminotransferase prothrombin time ammonia fibrosis-4 index AST-to-platelet ratio index standard deviation asunaprevir daclatasvir sofosbuvir ledipasvir ombitasvir paritaprevir ribavirin elbasvir grazoprevir esophageal varices gastric varices area under the ROC curve
Akihiro Tamori received lecture's fee from MSD. Norifumi Kawada received research funding from Abbvie Inc. and Gilead Sciences, and lecture's fee from Abbvie Inc., Gilead Sciences and MSD. Dr. Hideki Fujii belongs to the Endowed Department of Liver Cirrhosis Therapeutics donated by Gilead. The other authors declare that they do not have anything to disclose regarding funding or conflict of interest with respect to this study.
We thank Ms. Yoko Yasuhara, Sanae Deguchi, and Ayano Hujikawa for their assistance with data/sample collection. The present study was supported in part by a Research Grant from the Japan Agency for Medical Research and Development. (no. 19fk0210058h0001).


