


The predictors for gastroesophageal varices (GOV) and hemorrhage development have not been well studied in different liver diseases or different population. This study aimed to evaluate whether a new algorithm focusing on chronic hepatitis B (CHB) patients is also applicable to other chronic liver diseases (CLDs) in Chinese population.
Patients or materials and methodsWe retrospectively analyzed 659 CHB patients and 386 patients with other CLDs. A total of 439 CHB patients were included in training set, the other 220 CHB patients and other patients with CLDs were included in validation set. A new algorithm for diagnosing GOV was established and its sensitivity and specificity for predicting the varices was verified.
ResultsMultivariable logistic regression revealed that the rough surface of the liver (p<0.001), splenic thickness (p<0.001), and liver stiffness (p=0.006) were independent predictors of GOV. The new algorithm was considered to be a reliable diagnostic model to evaluate the presence of varices. The AUROC was 0.94 (p<0.001) in CHB validation set and 0.90 (<0.001) in non-CHB validation set. When the cut-off value was chosen as −1.048, the sensitivity and specificity in diagnosing GOV in CHB population were 89.1% and 82.5%, respectively. Importantly, the new algorithm accurately predicted the variceal hemorrhage not only in CHB patients, but also in patients with other CLDs.
ConclusionThe new algorithm is regarded as a reliable model to prognosticate varices and variceal hemorrhage, and stratified not only the high-risk CHB patients, but also in patients with other CLDs for developing GOV and variceal bleeding.
Variceal hemorrhage is a major acute complication of cirrhotic patients and is a leading cause of death. Although multiple procedures were available to control bleeding, the mortality associated with it accounted for about 10%–20% currently [1,2]. Therefore, clinical guidelines recommend upper gastrointestinal endoscopic examination for all cirrhotic patients to identify esophageal and/or gastric varices [3,4]. The end-stage chronic liver disease (CLD) is the result of liver cirrhosis, although the complications are multiple, severe and potentially fatal in the compensated stage. Several patients with CLD in the early stage of liver cirrhosis or liver fibrosis were at increased risk of varices and hemorrhage. Apparently, early diagnosis and appropriate treatment of cirrhotic patients with clinically significant portal hypertension (CSPH) remains a critical step for improving the prognosis and quality of life of patients. Generally, CSPH is diagnosed based on hepatic venous pressure gradient of ≥10mmHg, and severe portal hypertension of ≥12mmHg [5,6]. However, direct measurement of hepatic venous pressure gradient is an invasive method, and so it is difficult to be used in clinical practice. Endoscopy is a technique to confirm gastroesophageal varices (GOV) in patients with CLDs, and it is difficult to be accepted by some patients due to its invasive nature. Endoscopic ultrasound significantly improves the diagnostic performance when compared with that of traditional endoscopy, but it is also an invasive method [7]. In fact, the above discussed methods are invasive, expensive and not available at every medical center.
Imaging methods such as X-ray, ultrasound, computed tomography (CT) scan, and magnetic resonance imaging were also generally used to diagnose CSPH [7,8]. Barium swallow is considered as a quick and reliable method for assessing esophageal varices till 1990s [9]. The major disadvantage of this method is patients are exposed to radiation, and few centers still use it currently. CT is used to screen GOV instead of endoscopy, but its suboptimal specificity should be taken into consideration [10]. Transient elastography (TE) is a relatively new noninvasive technique for diagnosing portal hypertension in patients with CLDs [7]. TE is highly sensitive in estimating the absence of liver fibrosis or the presence of high-degree liver fibrosis. Therefore, the American Gastroenterological Association and Baveno VI Consensus have recommended the use of TE to evaluate GOV. TE is a rapid and painless method, and is well accepted by most of the patients [2,11]. However, acute hepatocytes injury, fasting status, and extra-hepatic cholestasis influence TE performance in evaluating GOV [12]. Consequently, some new algorithms were reported to diagnose varices in population with CLDs [13,14]. The algorithm was based on the results of capsule endoscopy, which was relatively an expensive method. Hence, it is difficult to be used in clinical practice, especially in developing countries.
For creating a noninvasive model to predict the presence of GOV in chronic HBV infected patients and other CLDs, 1045 patients with and without chronic HBV infection were retrospectively analyzed and provided a new algorithm for diagnosing GOV, with a relatively high sensitivity and specificity.
2Methods2.1PatientsThis was a retrospective analysis conducted according to the ethical guidelines of Declaration of Helsinki. The protocol was approved by the Ethics Committee of Beijing Ditan Hospital, Capital Medical University. All patients provided written informed consent before receiving endoscopy or endotherapy. CLD was defined as an inclusive category for all patients that presented with a history and/or evidence of chronic liver dysfunction as detected by ultrasound to prove hepatomegaly and/or persistent abnormality of liver function (more than 6 months duration). For chronic HCV infection patients, all variables were recorded before they receive direct antivirals that produce sustained clearance of HCV. From October, 2015 to December, 2017, a total of 1133 patients with CLDs or suspected cirrhosis have received elastography, endoscopy, ultrasound, and systematical laboratory test during the same period in our hospital. For 1133 patients with CLDs, 88 patients were excluded from the group as 11 patients were without TE data and 77 patients have ALT levels ≥60U/L after analyzing the TE data (the ALT threshold is selected according to the suggestions of AASLD 2018 Hepatitis B Guidelines [15]). CHB patients were randomly divided into two groups (439 into training set and 220 into validation set), and CLD patients with other etiologies were also chosen as validation set. The criteria for patients in training group included HBsAg-positive for over 6 months and with nearly normal ALT levels (≤1.5ULN), and those with or without receiving antiviral therapy. For validation group, the diagnosis of patients was based on clinical guidelines, with nearly normal ALT levels (≤1.5ULN).
A total of 659 CHB patients and 386 patients with other CLDs were included. CHB is usually acquired perinatally or during childhood in China, or infected perinatally. There is a common period with normal serum ALT levels, positive sera for hepatitis B e-antigen, high HBV DNA levels, and minimal or no liver inflammation [16], and the shape of the liver might also be approximately normal (Fig. 1).
.")
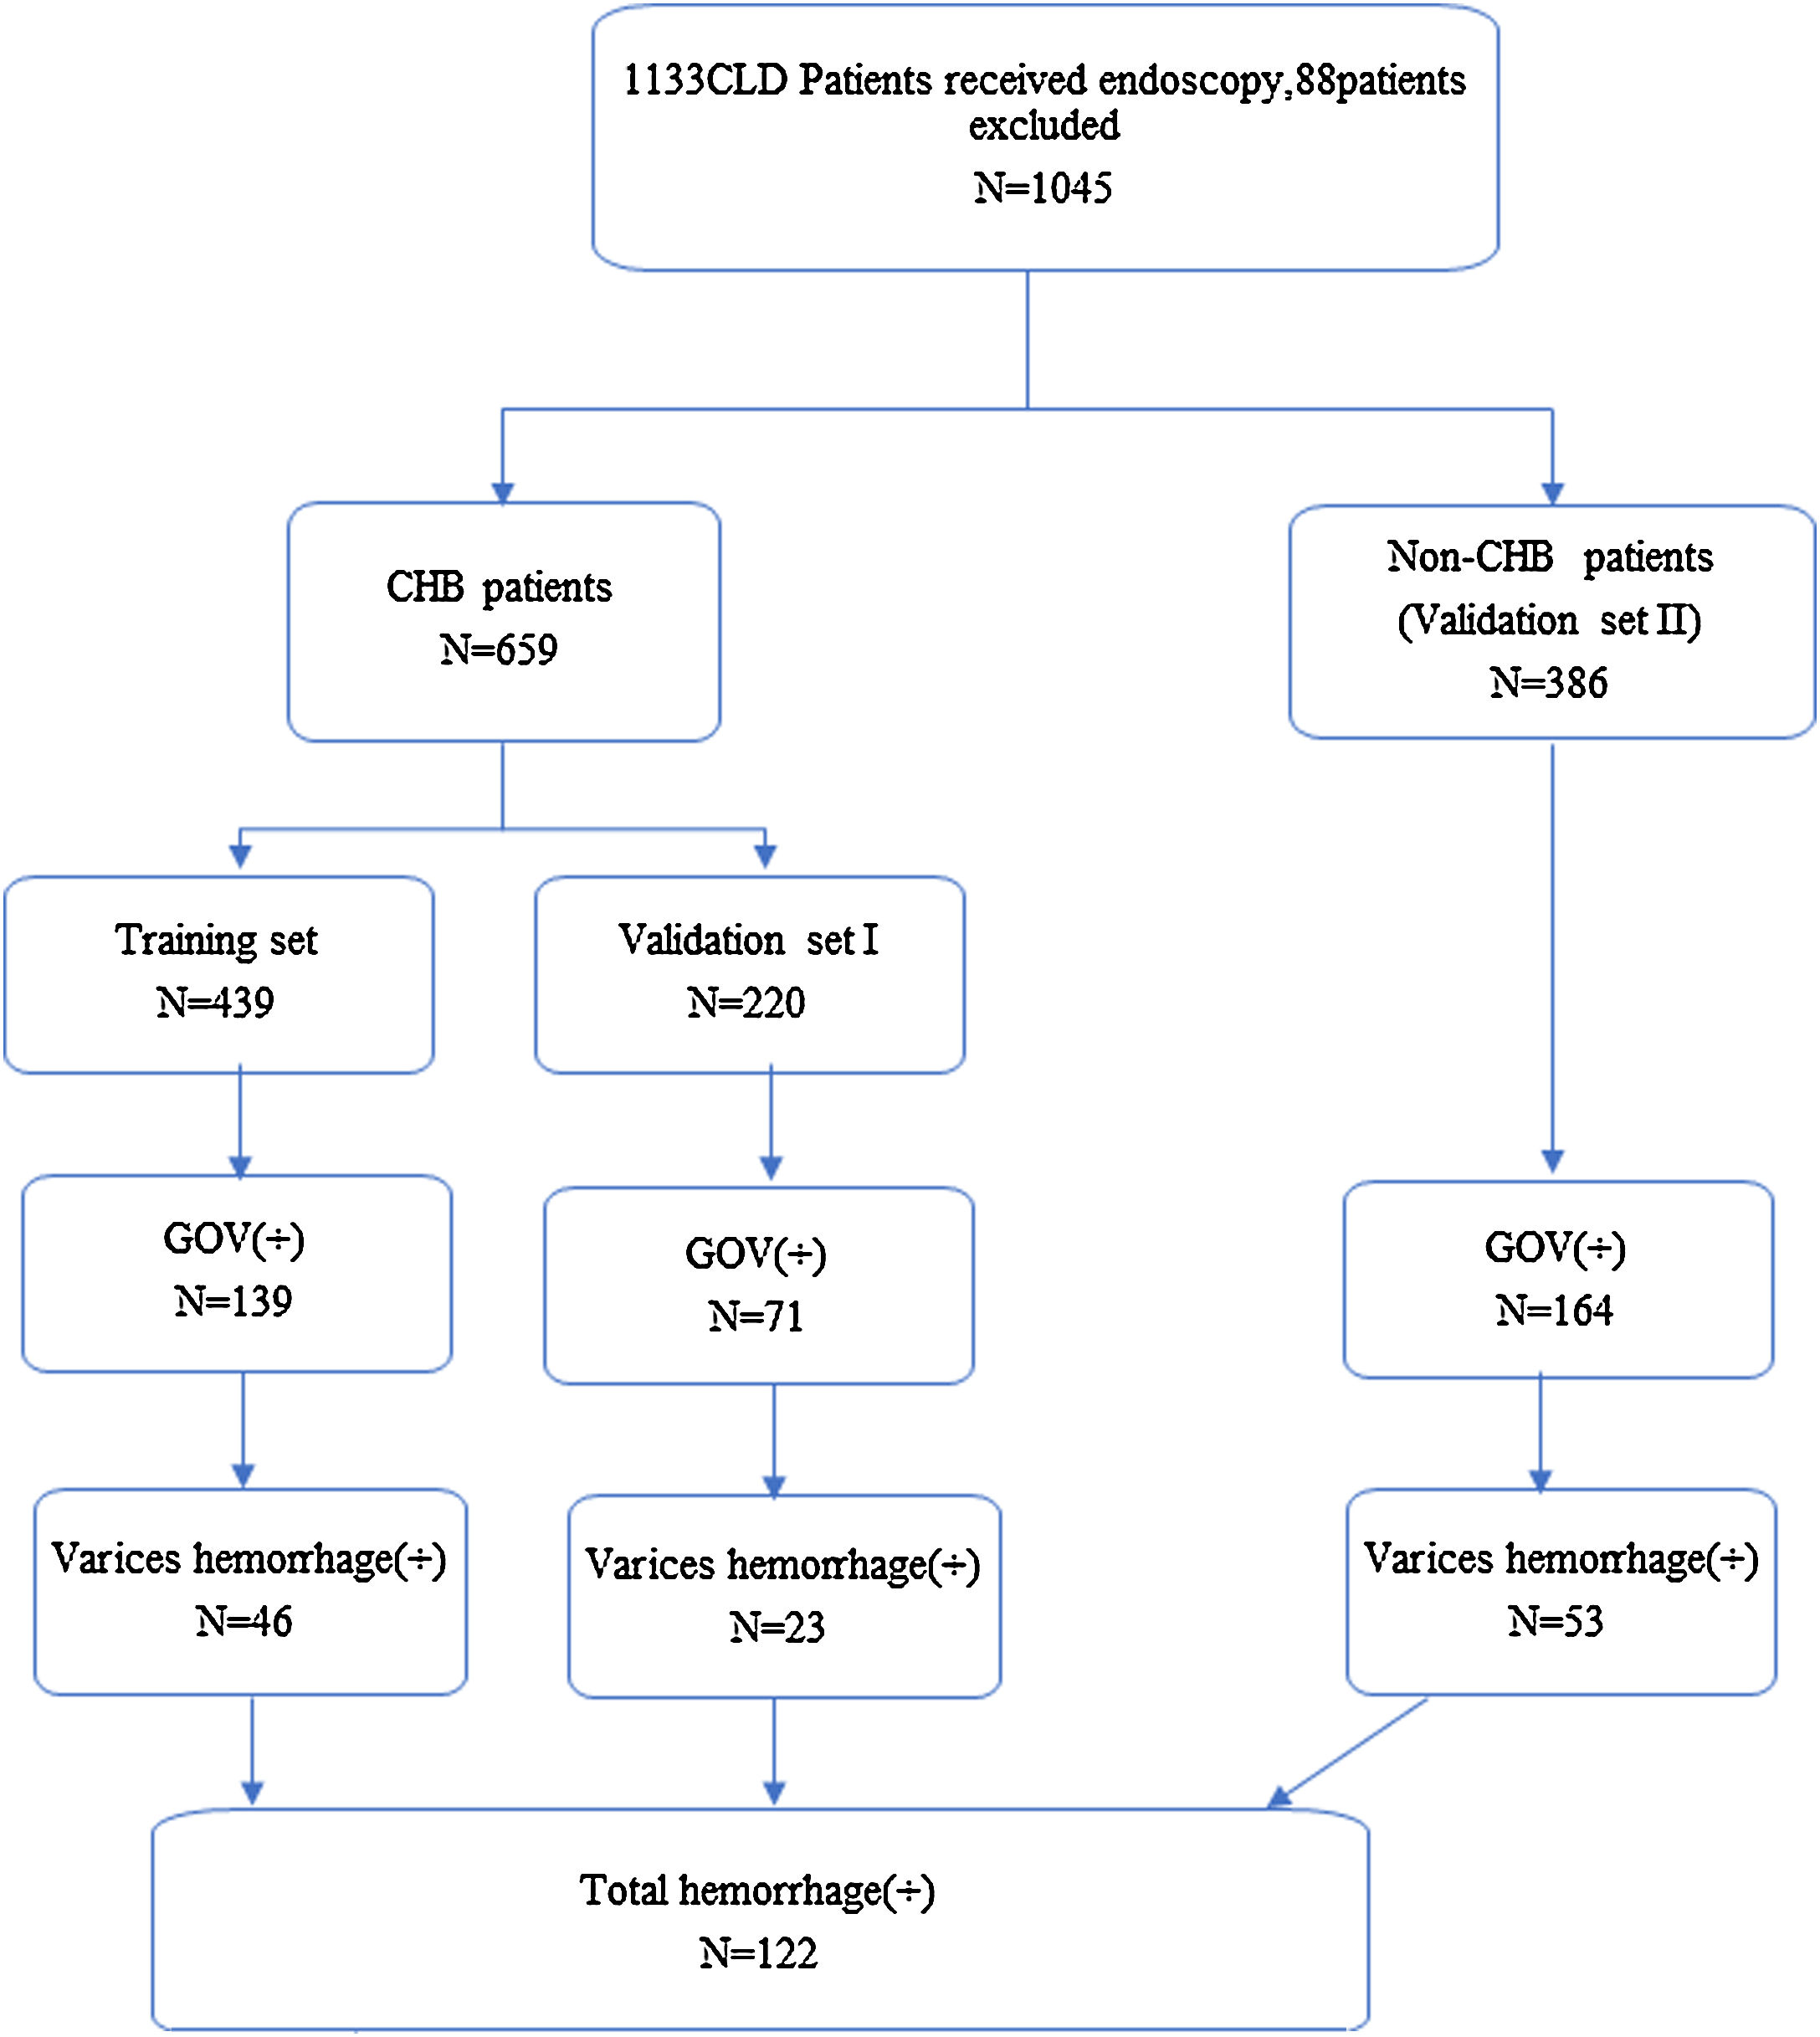
Study design. A total of 1133 CHD patients received endoscopy from October, 2015 to December, 2017 in our medical center. Eleven patients without TE and 77 patients with ALT≥60U/L, were excluded from analysis, and a total of 1045 patients were left (CLD, chronic hepatitis disease; CHB, chronic hepatitis B; non-CHB, CLD patients without hepatitis B virus infection; TE, transient elastography; ALT, alanine transaminase).
LS measurements for each patient were performed using FibroScan (FibroScan®, France) by one of the three experienced sonographers (at least 10 years experiences). Patients who have undergone Fibroscan were all in the fasting state. The method for measuring spleen thickness involves locating ultrasonic probe in the left intercostal skew, the maximum distance between the spleen and the opposite convex surface of the spleen. Liver surface nodularity was defined as rough surface, which was assessed by using a transducer to examine the whole liver surface and the outer 2–3cm of the liver parenchyma. Multiple scans were used to search the signs in both the left and the right lobes. The GOV and bleeding were diagnosed by endoscopic examination (Olympus GIF-260/H260, Japan). The gastroenterologist should have at least 10 years of experience.
2.3Sample size calculationTo achieve 80% power for a 5% significance level, the incidence of cirrhosis in CHB patients should be approximately 10% [17,18], and nearly 50% of patients with newly diagnosed liver cirrhosis should accompany the varices [19]. By considering a 20% patient dropout rate, at least 113 patients should be allocated to each group.
2.4StatisticsStatistical analysis was performed by SPSS 19.0 (IBM Corp., Armonk, NY, United States) and GraphPad Prism 7.0 (GraphPad Prism Software Inc., San Diego, CA, USA). The quantitative data were presented as means±SD. The predictive index of GOV was analyzed by multivariable logistic regression analysis. A total of 659 CHB patients were included in the training set, and 386 patients with non-HBV related to other CLDs were included in the validation set. The differences in measurement data between the training set and validation set were evaluated by univariate regression analysis. Predictive markers with significant relation to GOV were identified (p<0.05) and then were subjected to multivariate logistic regression analysis. Using the new algorithm, a risk score was calculated for each patient in the training set. Student's t test was used to evaluate the differences in risk score for diagnosing varices between training set and validation set. Receiver operating characteristic curve (ROC) analysis was used to define a plot of diagnostic sensitivity and specificity regarding the present algorithm for predicting GOV. For evaluating the predictive performance of variceal hemorrhage, the new algorithm was applied for all 1045 patients.
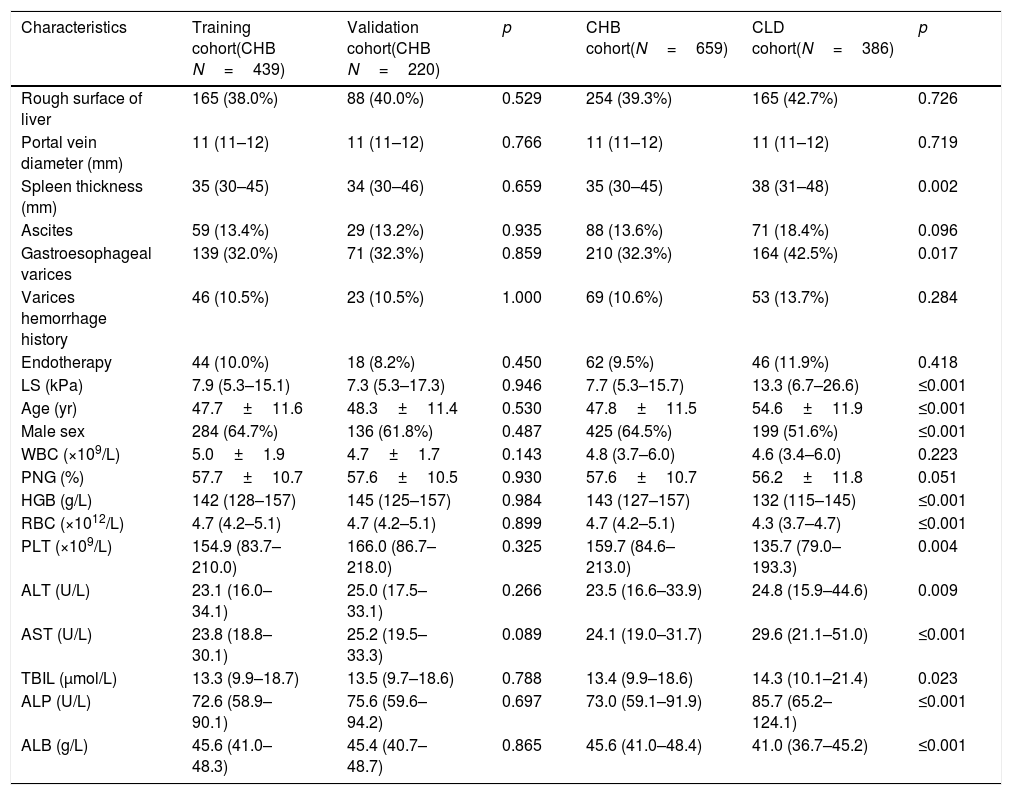
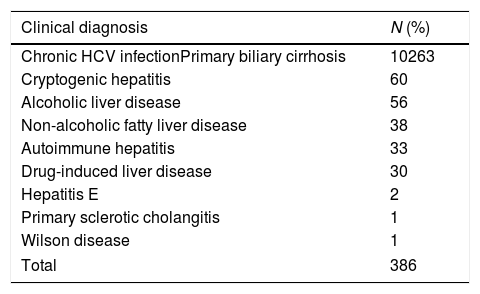
3Results3.1Demographic dataA total of 1045 patients with complete data were included in the final analysis. The mean age of patients with CHB in the training set was 47.7±11.6 years, and 284 (64.7%) of these were men. In total, 139 patients had GOV, and 46 patients had history of GOV bleeding. The mean age of CHB patients in the validation set was 48.3±11.4 years, and 136 (61.8%) of these were men. In total, 71 patients had GOV, and 23 patients had history of GOV bleeding. The mean age of 386 non-CHB patients included in the validation set was 54.6±11.9 years, and 199 (51.6%) of these were men. In total, 164 patients had GOV, 53 patients had history of GOV bleeding. Most of the patients in CLD validation set had HCV infection, primary biliary cirrhosis and cryptogenic cirrhosis. The demographic and clinical characteristics and flow chart of subjects are shown in Tables 1 and 2 and Fig. 1.
The demographic data of patients.
| Characteristics | Training cohort(CHB N=439) | Validation cohort(CHB N=220) | p | CHB cohort(N=659) | CLD cohort(N=386) | p |
|---|---|---|---|---|---|---|
| Rough surface of liver | 165 (38.0%) | 88 (40.0%) | 0.529 | 254 (39.3%) | 165 (42.7%) | 0.726 |
| Portal vein diameter (mm) | 11 (11–12) | 11 (11–12) | 0.766 | 11 (11–12) | 11 (11–12) | 0.719 |
| Spleen thickness (mm) | 35 (30–45) | 34 (30–46) | 0.659 | 35 (30–45) | 38 (31–48) | 0.002 |
| Ascites | 59 (13.4%) | 29 (13.2%) | 0.935 | 88 (13.6%) | 71 (18.4%) | 0.096 |
| Gastroesophageal varices | 139 (32.0%) | 71 (32.3%) | 0.859 | 210 (32.3%) | 164 (42.5%) | 0.017 |
| Varices hemorrhage history | 46 (10.5%) | 23 (10.5%) | 1.000 | 69 (10.6%) | 53 (13.7%) | 0.284 |
| Endotherapy | 44 (10.0%) | 18 (8.2%) | 0.450 | 62 (9.5%) | 46 (11.9%) | 0.418 |
| LS (kPa) | 7.9 (5.3–15.1) | 7.3 (5.3–17.3) | 0.946 | 7.7 (5.3–15.7) | 13.3 (6.7–26.6) | ≤0.001 |
| Age (yr) | 47.7±11.6 | 48.3±11.4 | 0.530 | 47.8±11.5 | 54.6±11.9 | ≤0.001 |
| Male sex | 284 (64.7%) | 136 (61.8%) | 0.487 | 425 (64.5%) | 199 (51.6%) | ≤0.001 |
| WBC (×109/L) | 5.0±1.9 | 4.7±1.7 | 0.143 | 4.8 (3.7–6.0) | 4.6 (3.4–6.0) | 0.223 |
| PNG (%) | 57.7±10.7 | 57.6±10.5 | 0.930 | 57.6±10.7 | 56.2±11.8 | 0.051 |
| HGB (g/L) | 142 (128–157) | 145 (125–157) | 0.984 | 143 (127–157) | 132 (115–145) | ≤0.001 |
| RBC (×1012/L) | 4.7 (4.2–5.1) | 4.7 (4.2–5.1) | 0.899 | 4.7 (4.2–5.1) | 4.3 (3.7–4.7) | ≤0.001 |
| PLT (×109/L) | 154.9 (83.7–210.0) | 166.0 (86.7–218.0) | 0.325 | 159.7 (84.6–213.0) | 135.7 (79.0–193.3) | 0.004 |
| ALT (U/L) | 23.1 (16.0–34.1) | 25.0 (17.5–33.1) | 0.266 | 23.5 (16.6–33.9) | 24.8 (15.9–44.6) | 0.009 |
| AST (U/L) | 23.8 (18.8–30.1) | 25.2 (19.5–33.3) | 0.089 | 24.1 (19.0–31.7) | 29.6 (21.1–51.0) | ≤0.001 |
| TBIL (μmol/L) | 13.3 (9.9–18.7) | 13.5 (9.7–18.6) | 0.788 | 13.4 (9.9–18.6) | 14.3 (10.1–21.4) | 0.023 |
| ALP (U/L) | 72.6 (58.9–90.1) | 75.6 (59.6–94.2) | 0.697 | 73.0 (59.1–91.9) | 85.7 (65.2–124.1) | ≤0.001 |
| ALB (g/L) | 45.6 (41.0–48.3) | 45.4 (40.7–48.7) | 0.865 | 45.6 (41.0–48.4) | 41.0 (36.7–45.2) | ≤0.001 |
HBV, hepatitis B virus; WBC, white blood cell; PNG, percent of neutrophile granulocyte; HGB, hemoglobin; RBC, red blood cell; PLT, platelet count; ALT, alanine transaminase; AST, aspartate aminotransferase; TBIL, total bilirubin; ALP, alkaline phosphatase; ALB, albumin.
The etiology of patients in validation set without HBV infection.
| Clinical diagnosis | N (%) |
|---|---|
| Chronic HCV infectionPrimary biliary cirrhosis | 10263 |
| Cryptogenic hepatitis | 60 |
| Alcoholic liver disease | 56 |
| Non-alcoholic fatty liver disease | 38 |
| Autoimmune hepatitis | 33 |
| Drug-induced liver disease | 30 |
| Hepatitis E | 2 |
| Primary sclerotic cholangitis | 1 |
| Wilson disease | 1 |
| Total | 386 |
HCV, hepatitis C virus.
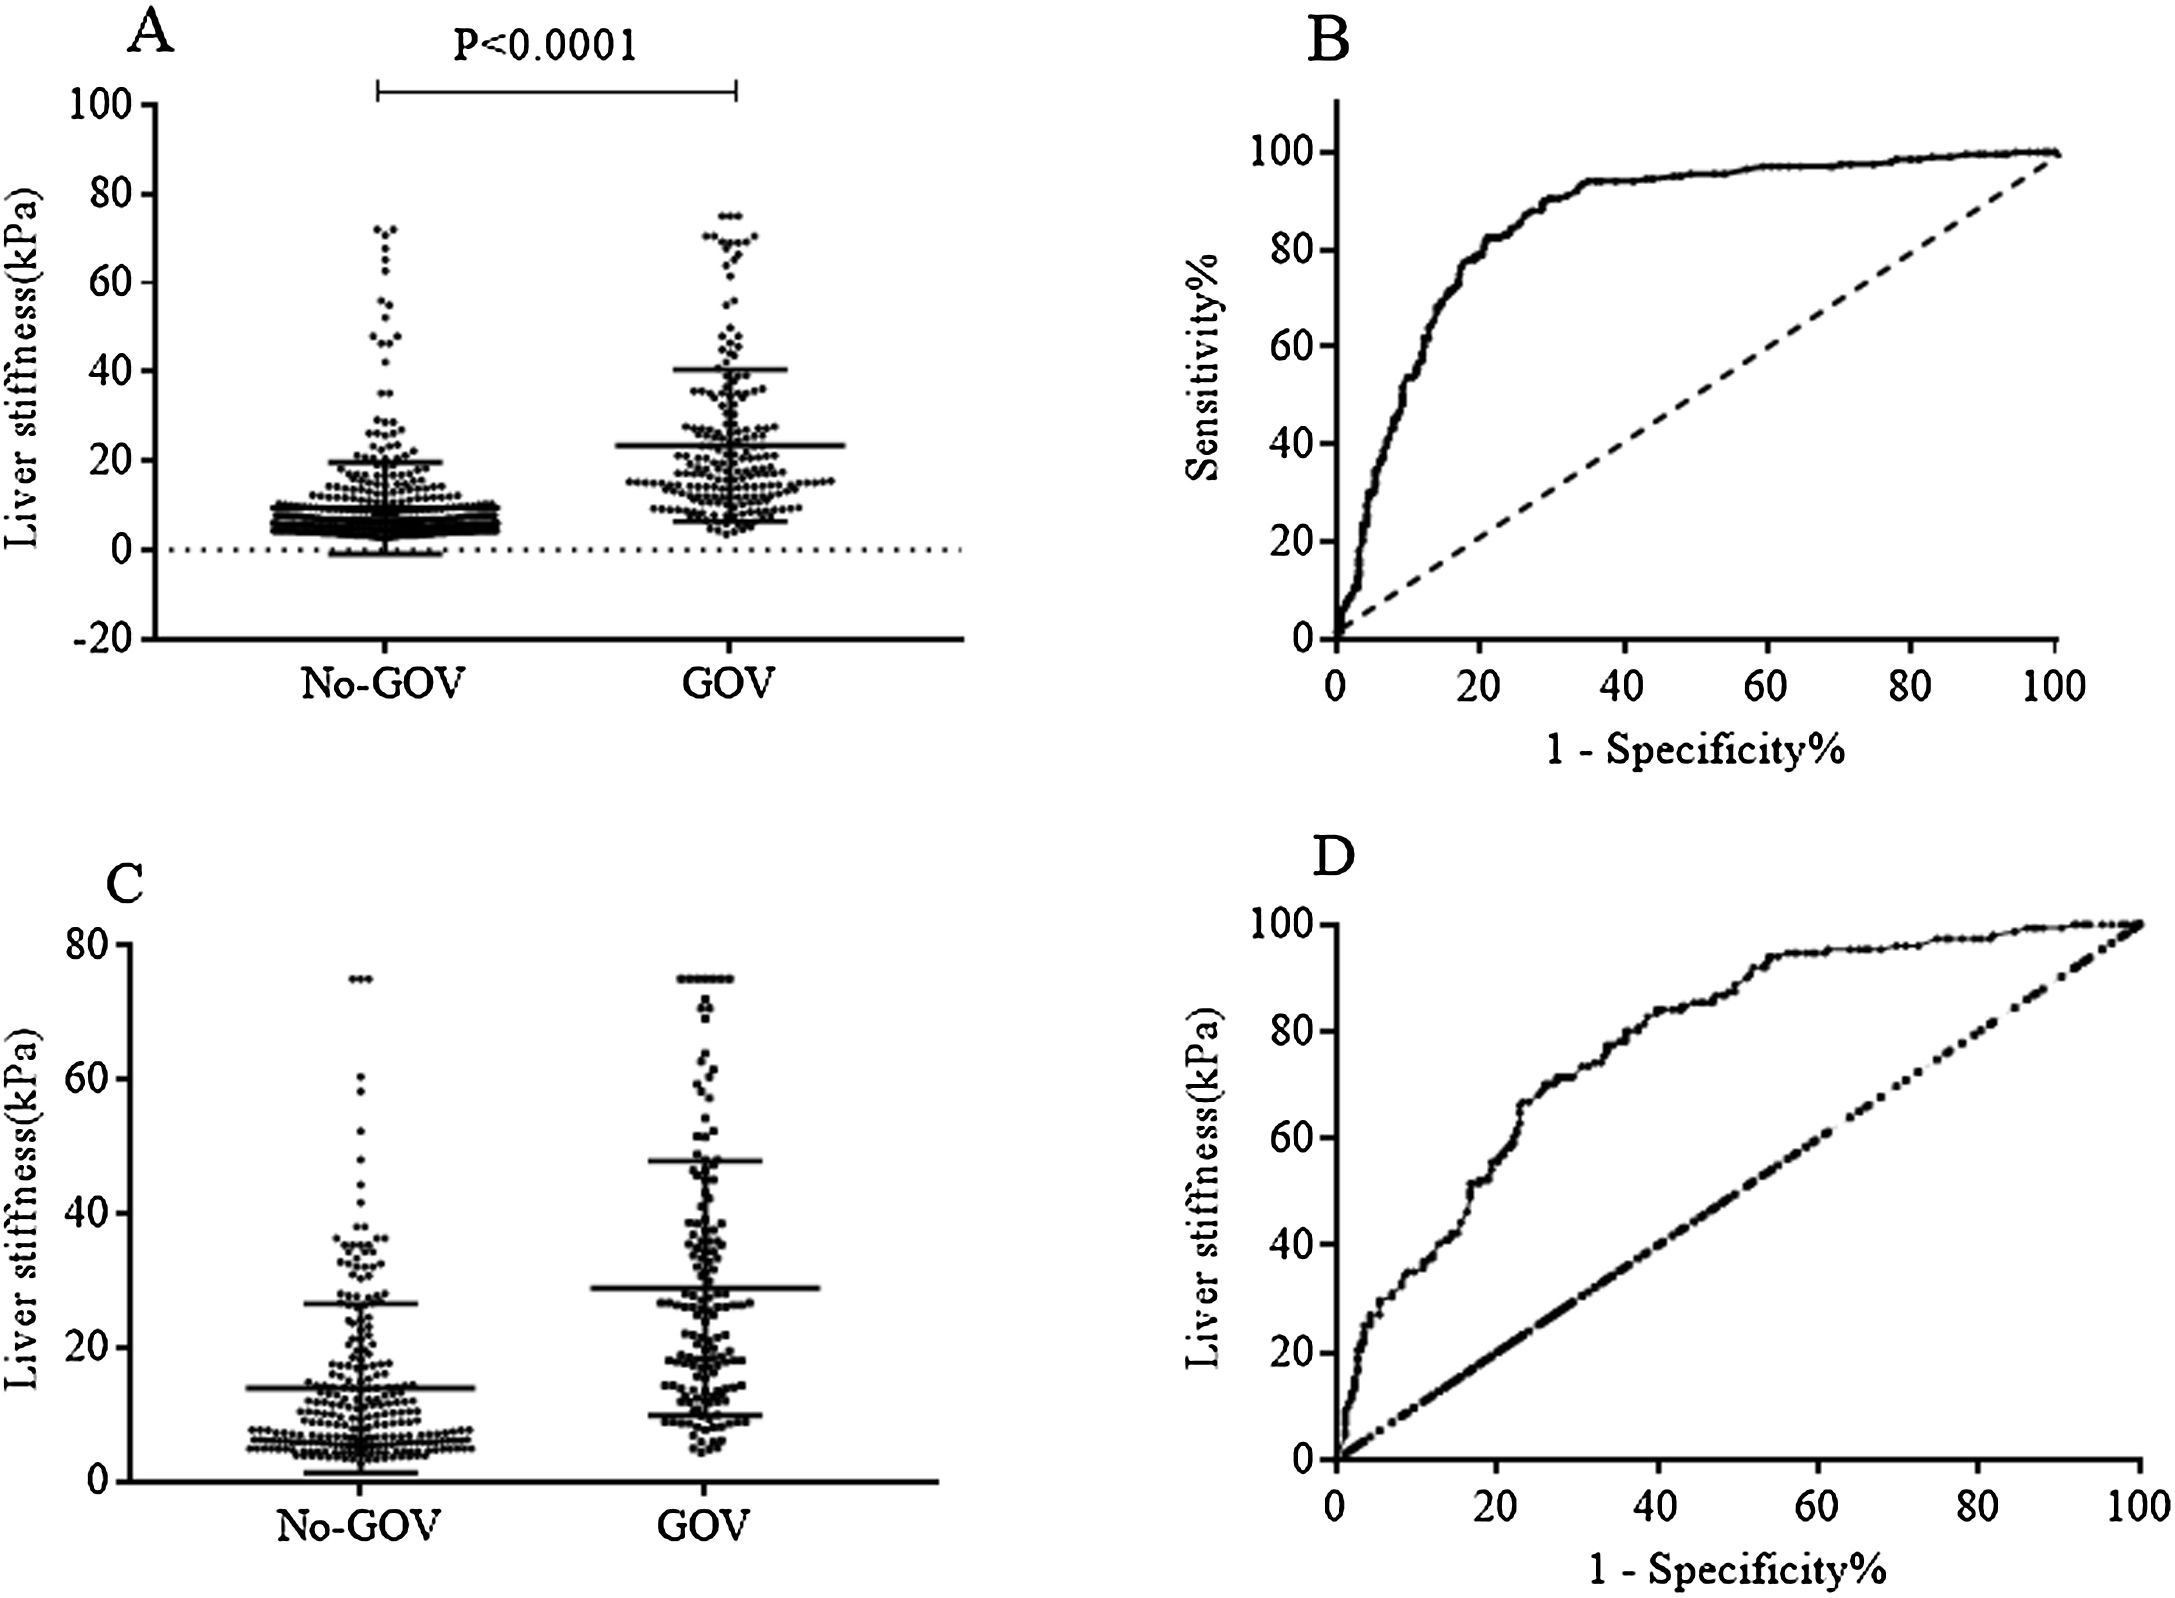
Patients with high liver stiffness were associated with high risk of varices, and the value of TE to predict varices was validated by ROC curve. In all 659 CHB patients, the results showed that TE had an area under the ROC curve of 0.84 (95% CI: 0.81–0.87, p<0.0001). The cut-off value was set as 12.5kPa, the sensitivity and the specificity were 72.90% (95% CI: 66.42–78.73%) and 80.04% (95% CI: 76.33–83.4%), respectively. In the 386 non-CHB patients, the area under the ROC curve was 0.78 (95% CI: 0.74–0.83, p<0.0001). The cut-off value was set as 16.2kPa, the sensitivity and the specificity were 70.20% (95% CI: 62.22–77.36%) and 74.03% (95% CI: 68.23–79.27%), respectively (Fig. 2).
 Liver stiffness was different between GOV positive group and GOV negative group in patients with chronic HBV infection. (B) ROC curve of liver stiffness for diagnosing GOV in population with HBV infection. (C) Liver stiffness was different between GOV positive and GOV negative in CLD patients without HBV infection. (D) ROC curve of liver stiffness for diagnosing GOV in CLD patients without HBV infection.")
Liver stiffness for diagnosing GOV in population with or without chronic HBV infection. (A) Liver stiffness was different between GOV positive group and GOV negative group in patients with chronic HBV infection. (B) ROC curve of liver stiffness for diagnosing GOV in population with HBV infection. (C) Liver stiffness was different between GOV positive and GOV negative in CLD patients without HBV infection. (D) ROC curve of liver stiffness for diagnosing GOV in CLD patients without HBV infection.
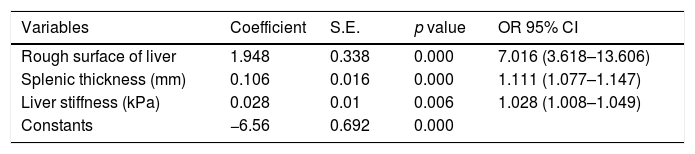
Variables associated with GOV were assessed by multivariate analysis. Table 3 shows that the rough surface of liver (p<0.001), splenic thickness (p<0.001), liver stiffness (p=0.006) were independent predictors of GOV. Based on the three related variables, the final prediction algorithm was developed, which was as follows: Index=−6.56+1.948*rough surface of liver (rough 1, smooth 0)+0.106*splenic thickness (millimeter, mm)+0.028*LS (kPa). The cut-off point was selected according to the ROC curve analyses based on the presence of GOV.
The result of multiple logistic regression.
| Variables | Coefficient | S.E. | p value | OR 95% CI |
|---|---|---|---|---|
| Rough surface of liver | 1.948 | 0.338 | 0.000 | 7.016 (3.618–13.606) |
| Splenic thickness (mm) | 0.106 | 0.016 | 0.000 | 1.111 (1.077–1.147) |
| Liver stiffness (kPa) | 0.028 | 0.01 | 0.006 | 1.028 (1.008–1.049) |
| Constants | −6.56 | 0.692 | 0.000 |
Algorithm=Index=−6.56+1.948*rough surface of liver (rough 1, smooth 0)+0.106*splenic thickness (millimeter, mm)+0.028*LS (kPa).
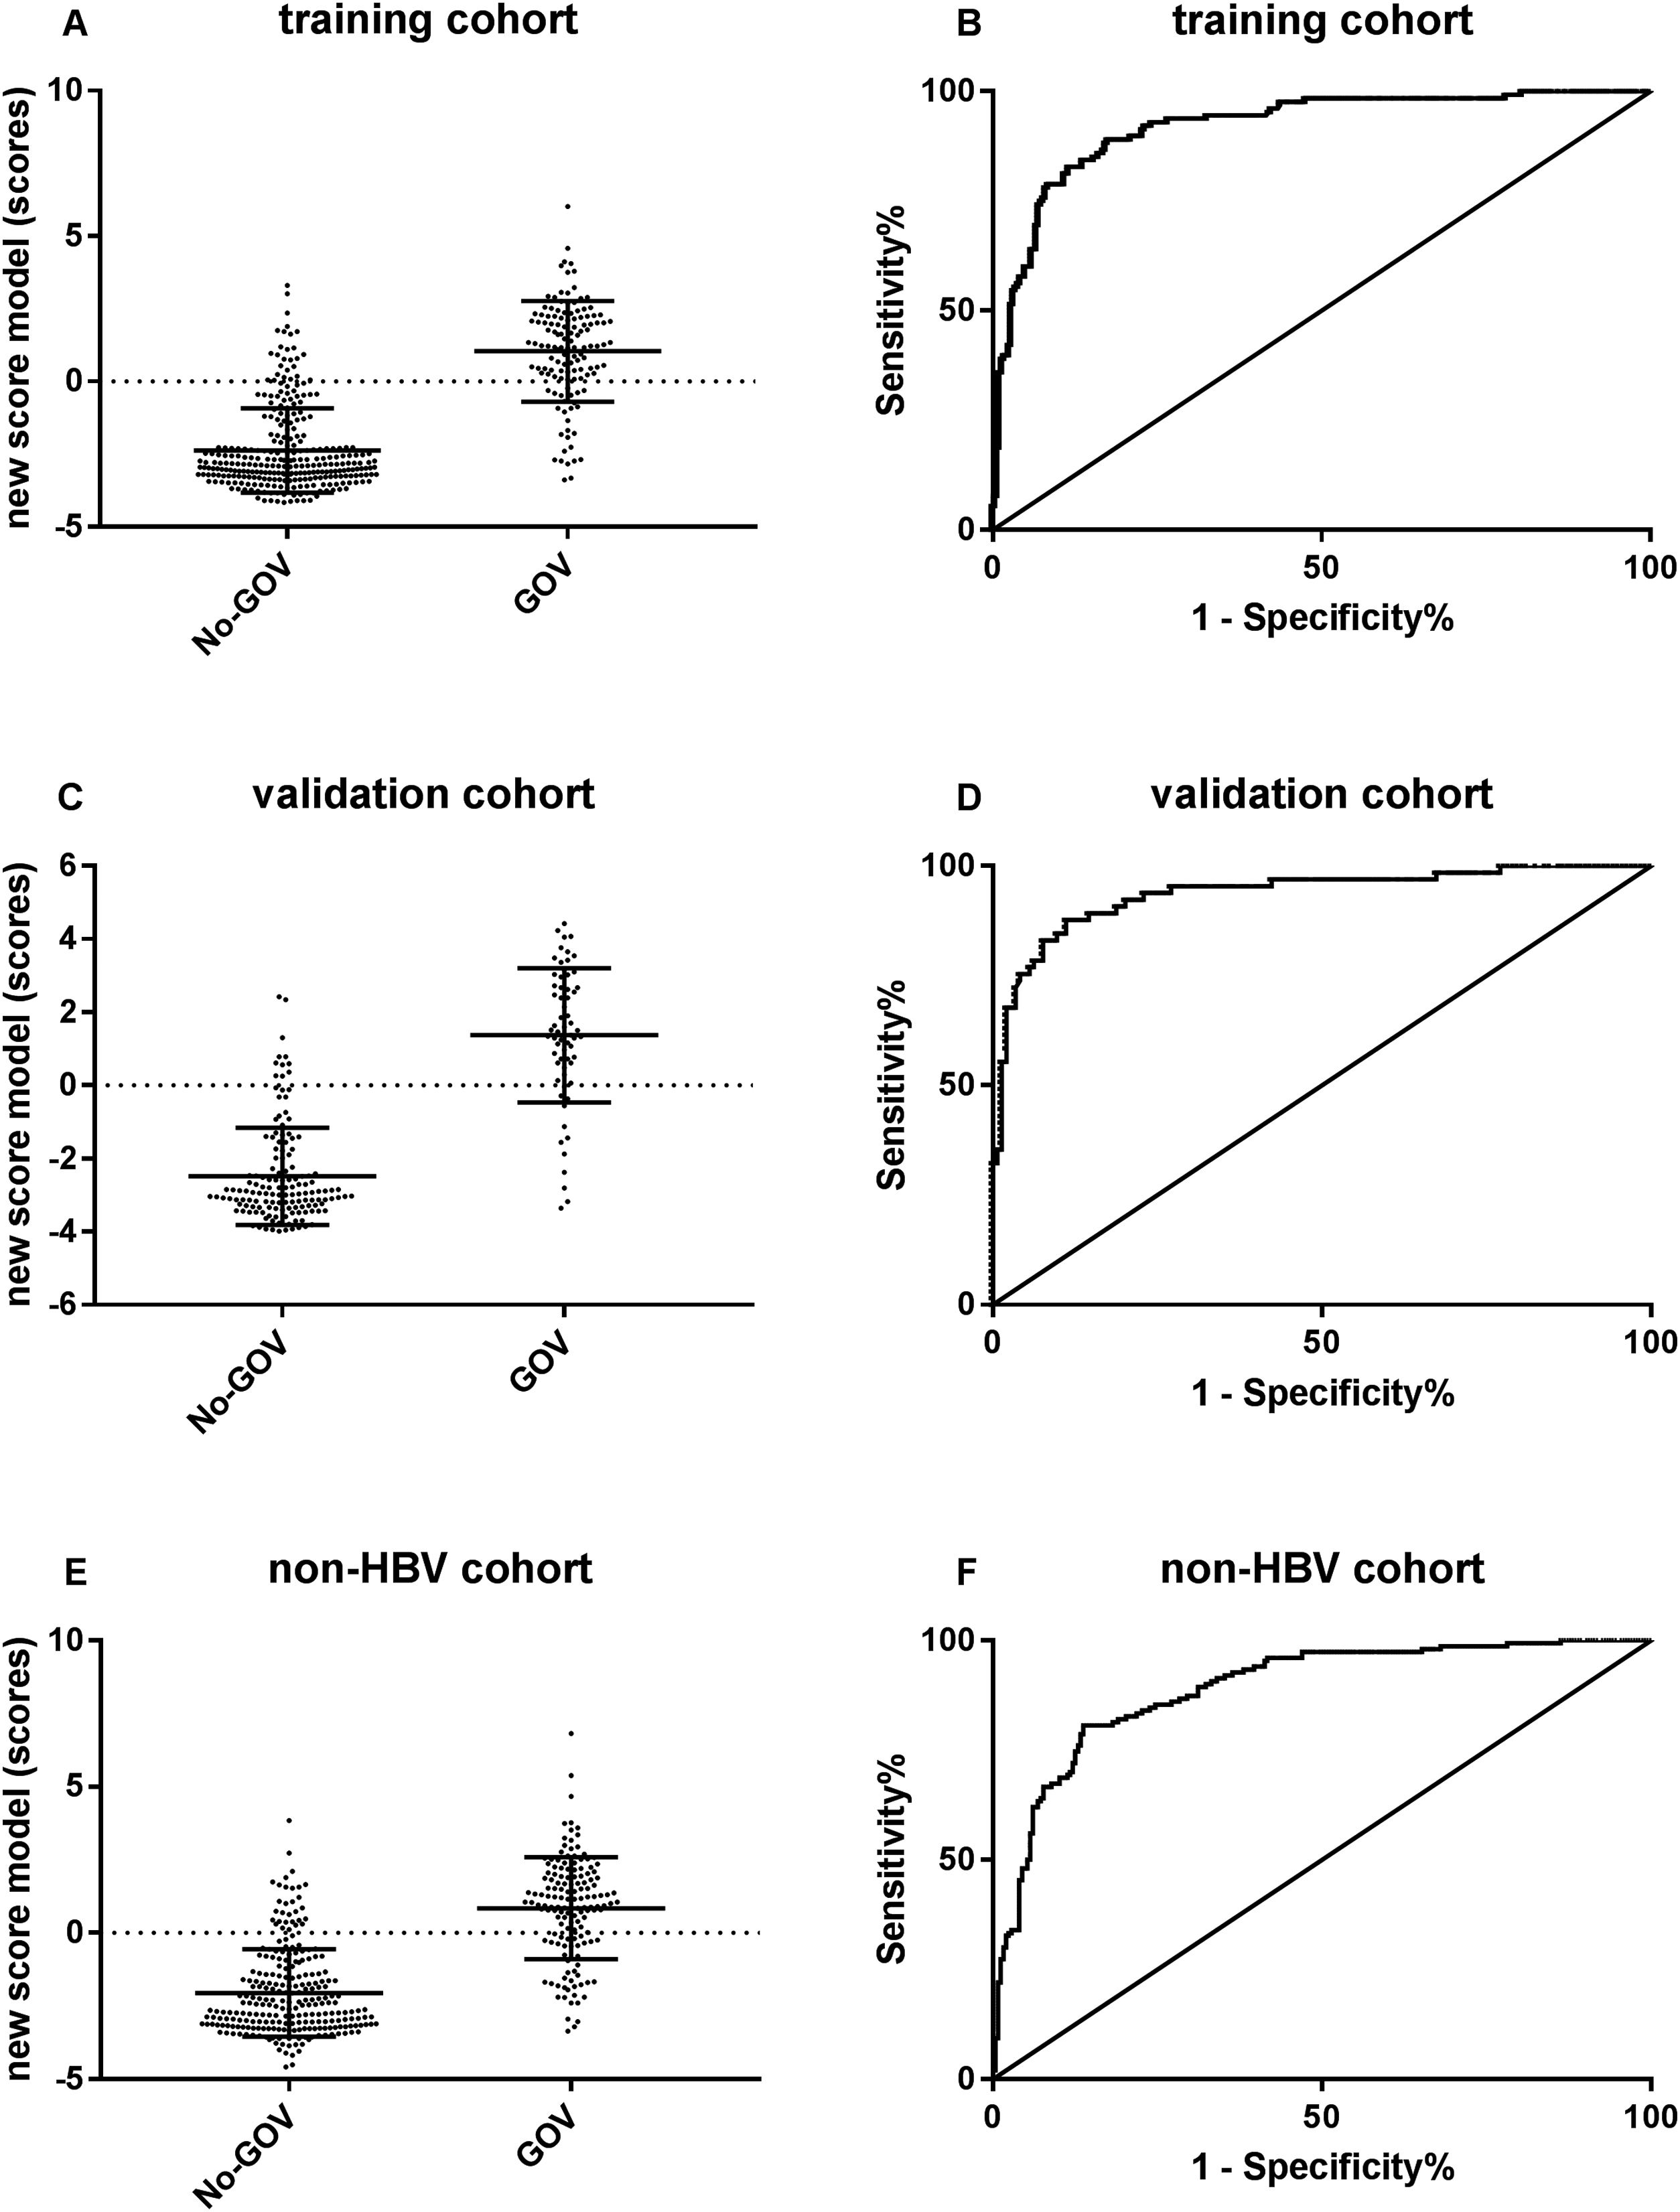
ROC curve analyses were used to evaluate the predictive effect of the algorithm in 220 CHB validation patients. The results showed that the new algorithm demonstrated a high area under the ROC curve of 0.94 (95% CI: 0.899–0.975, p<0.001). When the cut-off point was −1.048, the sensibility to predict GOV was 89.1%, and the specificity was 82.5%.
For further evaluating the predictive performance of new algorithm in non-CHB population, a new algorithm was put forwarded in 386 non-CHB patients. The results showed that the new algorithm had a similar high area under the ROC curves of 0.90 (95% CI: 0.856–0.922, p<0.001; Fig. 3).
 The model score was different between GOV positive group and GOV negative group in CHB training cohort. (B) ROC curve of the model score for diagnosing GOV in CHB training cohort. (C) The model score was different between GOV positive and GOV negative in CHB validation cohort. (D) ROC curve of the model score for diagnosing GOV in CHB validation cohort. (E) The model score was different between GOV positive and GOV negative in non-CHB validation cohort. (F) The model score was different between GOV positive and GOV negative in non-CHB validation cohort.")
The predictive performance of the new algorithm for GOV. (A) The model score was different between GOV positive group and GOV negative group in CHB training cohort. (B) ROC curve of the model score for diagnosing GOV in CHB training cohort. (C) The model score was different between GOV positive and GOV negative in CHB validation cohort. (D) ROC curve of the model score for diagnosing GOV in CHB validation cohort. (E) The model score was different between GOV positive and GOV negative in non-CHB validation cohort. (F) The model score was different between GOV positive and GOV negative in non-CHB validation cohort.
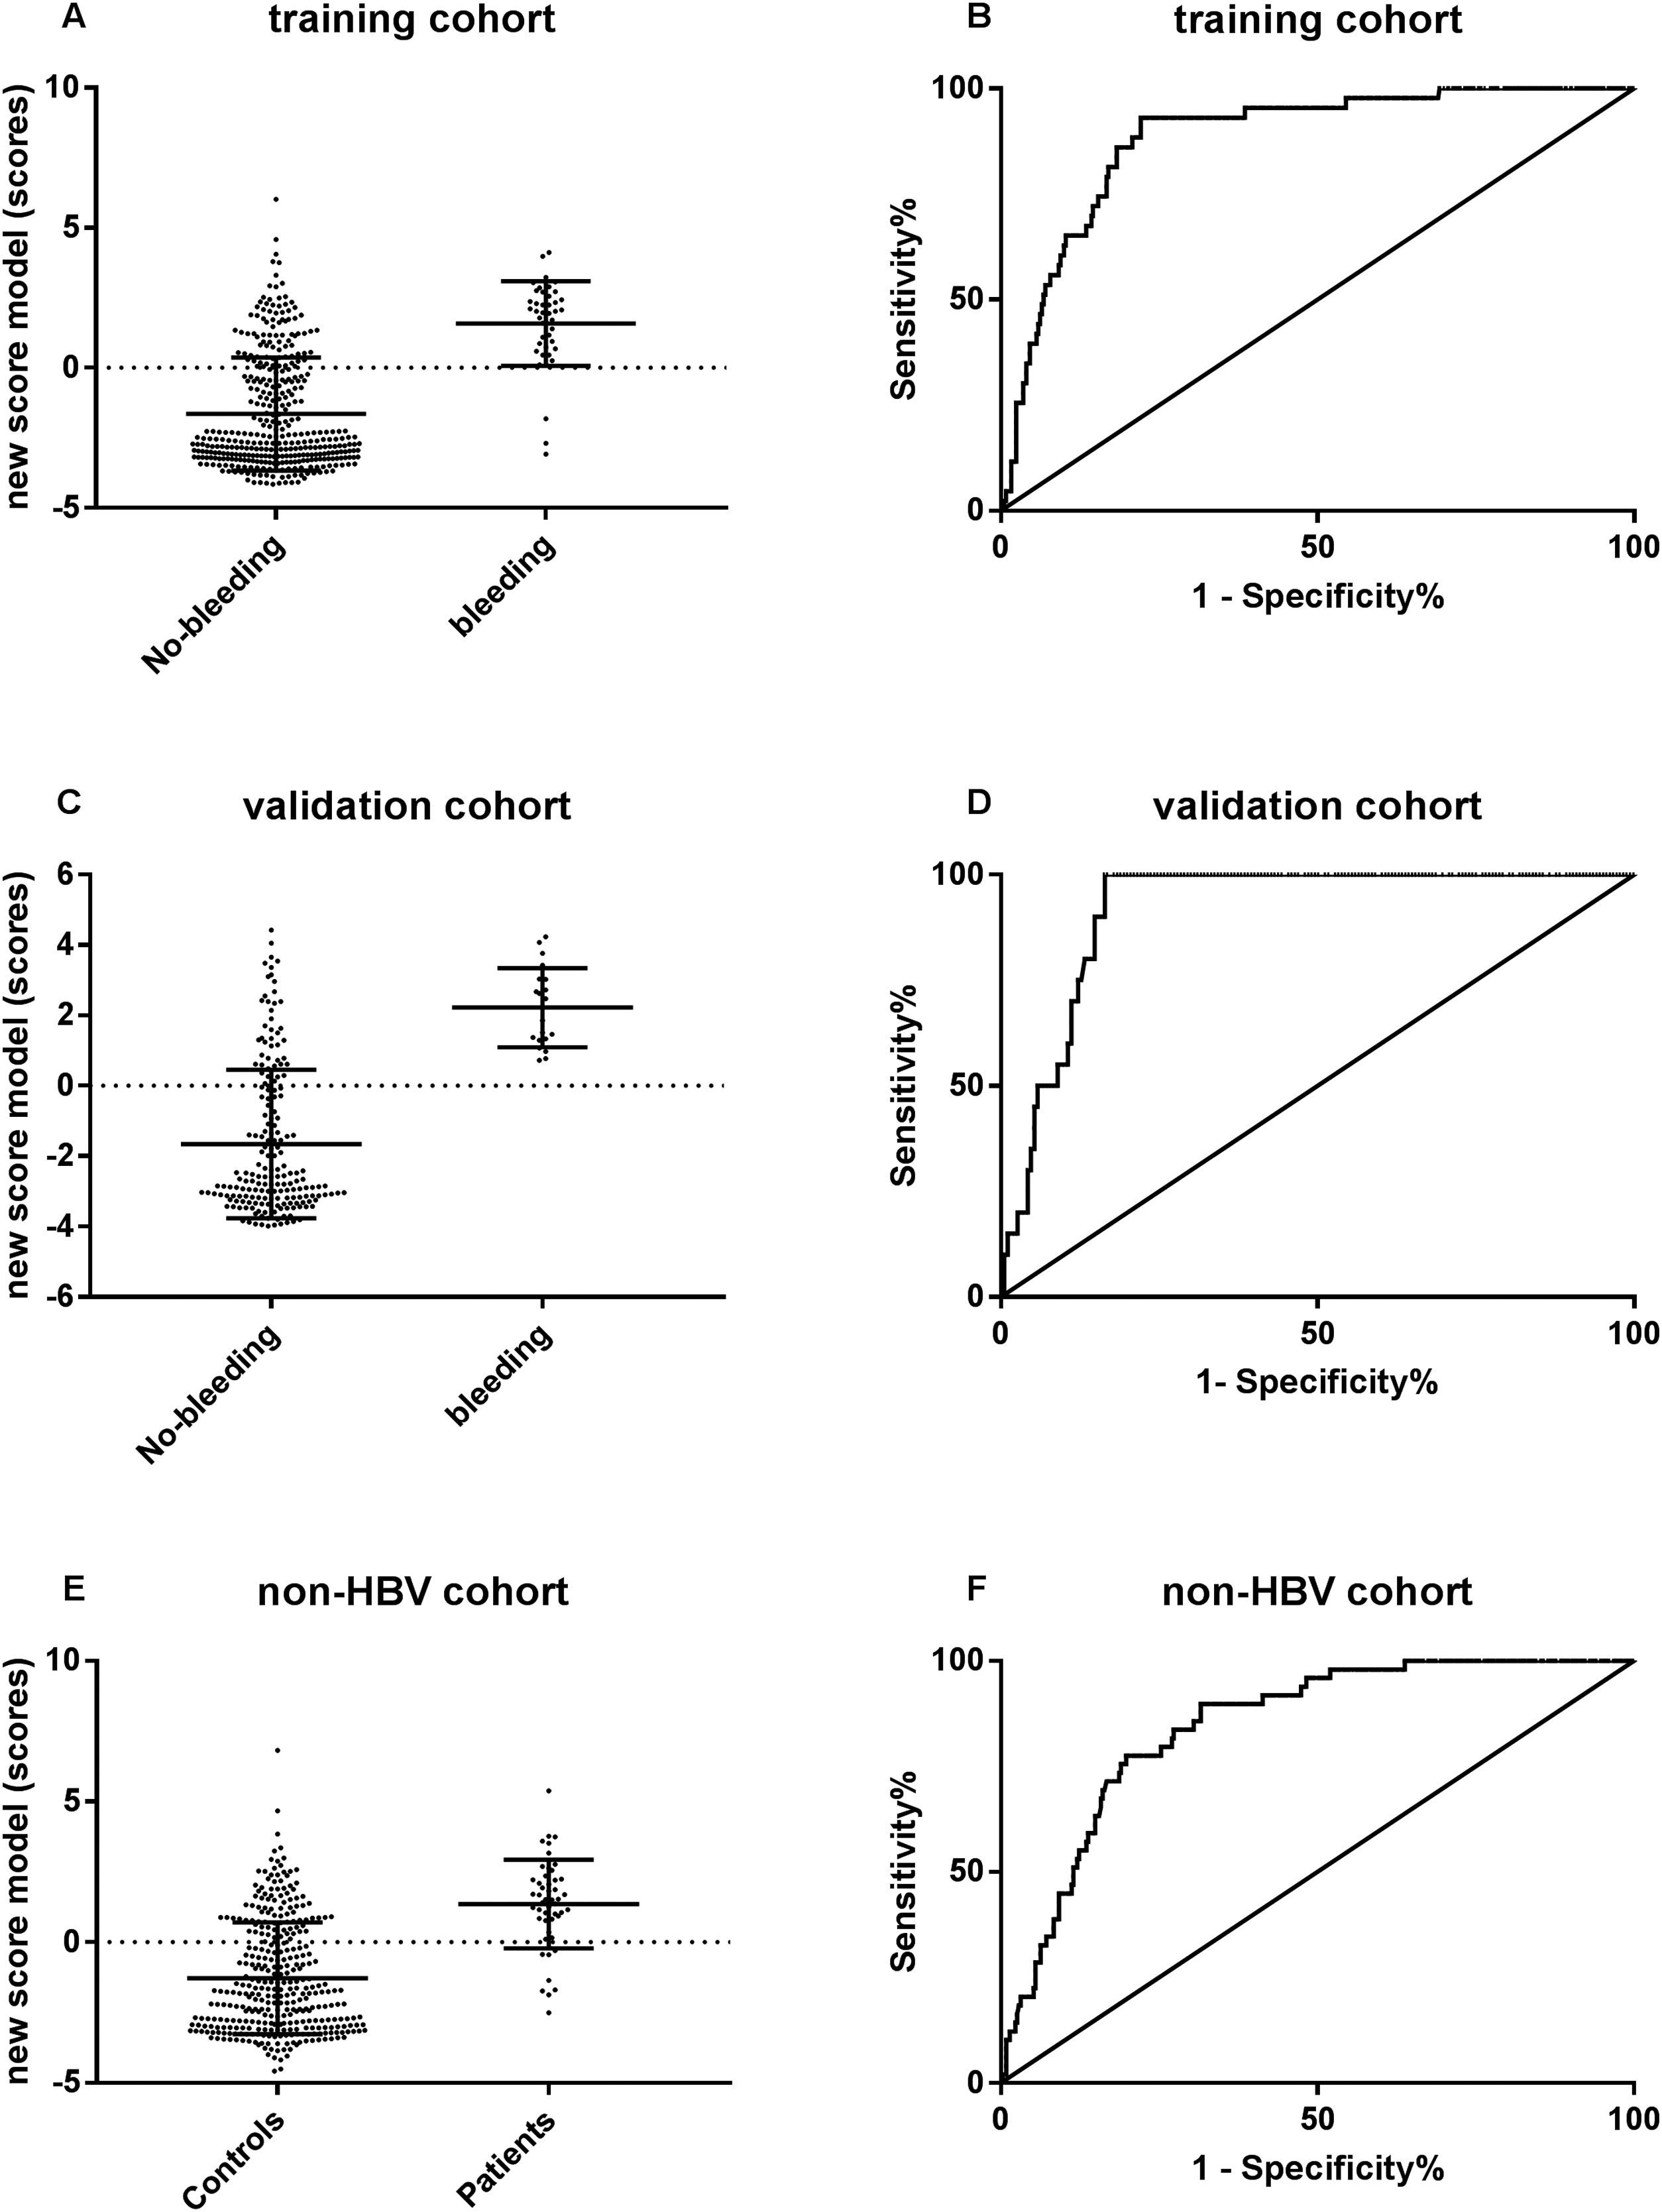
The predictive performance of new algorithm to variceal hemorrhage was evaluated by ROC curve. The results revealed that the algorithm showed a surprisingly high area under the ROC curve of 0.89 (95% CI: 0.84–0.93, p<0.001) in the CHB training set, 0.92 (95% CI: 0.880–0.957, p<0.001) in the CHB validation set and 0.84 (95% CI: 0.796–0.892, p<0.001) in the non-CHB validation set. The cut-off point of 0.093 was chosen, the sensibility to predict variceal hemorrhage was 93.0%, and the specificity was 77.9%, respectively (Fig. 4).
 The new model score was significantly different between hemorrhage group and non-hemorrhage group in CHB training cohort. (B) ROC curve of the model score for diagnosing variceal hemorrhage in CHB training cohort. (C) The new model score was significantly different between hemorrhage group and non-hemorrhage group in CHB validation cohort. (D) ROC curve of the model score for diagnosing variceal hemorrhage in CHB validation cohort. (E) The new model score was significantly different between hemorrhage group and non-hemorrhage group in non-CHB validation cohort. (F) ROC curve of the model score for diagnosing variceal hemorrhage in non-CHB validation cohort.")
The predictive performance of the new algorithm for variceal hemorrhage. (A) The new model score was significantly different between hemorrhage group and non-hemorrhage group in CHB training cohort. (B) ROC curve of the model score for diagnosing variceal hemorrhage in CHB training cohort. (C) The new model score was significantly different between hemorrhage group and non-hemorrhage group in CHB validation cohort. (D) ROC curve of the model score for diagnosing variceal hemorrhage in CHB validation cohort. (E) The new model score was significantly different between hemorrhage group and non-hemorrhage group in non-CHB validation cohort. (F) ROC curve of the model score for diagnosing variceal hemorrhage in non-CHB validation cohort.
Patients in the compensated stage of cirrhosis are completely asymptomatic, but require endoscopic screening of GOV. Since patients with compensated liver cirrhosis have a low probability of having large esophageal varices, noninvasive predictors are considered more critical. The new algorithm was applied on 204 patients with compensated cirrhosis. The results showed GOV in 104/204 patients, and were small (G1) in 66 and medium/large (G2, G3) in 38 patients. The algorithm showed the area under the ROC curve as 0.76 (95% CI: 0.69–0.83, p<0.001).
3.6The predictive value of other surrogate markers in patients with compensated cirrhosisIn Baveno VI consensus, TS≥20–25kPa can be used to diagnose CSPH in virus-related CLD, and the diagnostic value of TE in other etiologies should be confirmed [2]. In our study, 110 non-virus related CLDs with TS≥20kPa were observed, in which 70/110 (63.64%) had GOV (small to large), and 40/110 (36.36%) had no varices at all. In cases with misdiagnosis, 18 patients were considered to have cryptogenic hepatitis, 12 patients were with alcoholic liver disease, 8 patients were with autoimmune liver disease, 1 had non-alcoholic fatty liver disease and the remaining 1 patient had drug-induced liver disease. Four established algorithms, including the evaluation of AAR, FIB-4, APRI and platelet count/spleen diameter ratio in patients with severe varices in compensated liver cirrhosis [20,21], were performed in the compensated liver cirrhosis group. The algorithms showed that the area under the ROC curve as 0.60 (95% CI: 0.52–0.88, p<0.001), 0.54 (95% CI: 0.49–0.70, p=0.082), 0.53 (95% CI: 0.44–0.63, p=0.538) and 0.72 (95% CI: 0.63–0.82, p=0.000), respectively.
4DiscussionGOV occurs as a serious consequence of portal hypertension in patients with CLDs. Portal hypertension mostly occurs as a late manifestation of liver disease. However, some patients with early liver disease have non-cirrhotic hypertension [22]. However, single biomarkers are usually insufficient due to missing high-risk esophageal varices rate, and this exceeds the acceptable limit of 5% as indicated according to the Baveno VI consensus. In our study, we attempted to develop a single algorithm for routinely available results to predict GOV in CHB and non-CHB patients. We found that the rough surface of the liver, splenic thickness and liver stiffness (LS) as independent predictors of GOV. We hypothesized that the new algorithm that consisted of the above 3 variables was better in comparison to other predictors.
According to the previous report, the liver stiffness-spleen size-to-platelet ratio score (LSPS), which is a combination of 3 simple examination methods (LS, spleen size, and platelet count), predicted esophageal varices (EV) and high risk EV in patients with compensated cirrhosis. The area under ROC value of LSPS was 0.918, and more than 80% of the patients were accurately classified [23]. The diagnostic and prognostic abilities of LSPS were assessed in another study, and the results revealed that LSPS showed significant correlation with EV grade (p<0.001). It was independently associated with the presence of EV (p<0.001) and elevated EV risk (p=0.013) by multivariate logistic regression analysis [24]. Our new algorithm has similar high predictive value with an excellent area under the ROC curve of 0.94 (95% CI: 0.899–0.975, p<0.001). When applying the best cut-off point of the curve, the sensibility to predict GOV was 89.1%, and the specificity was 82.5%. This was used in CHB validation, non-CHB validation and compensated liver cirrhosis patients, and the algorithm still predicted GOV with a high area under ROC. Other previous studies used noninvasive markers such as serum albumin [7], platelets count [21,25], PVD [21], spleen size [21,26], platelet/spleen diameter ratio [27], and bilirubin [28] for investigation. However, the results showed that a low area under ROC value of 0.65–0.82 when compared with our study of 0.94. Meanwhile, there are few research studies that focused on chronic HBV infected patients only.
Baveno VI consensus recommended that combination of LS (<20kPa) and platelet count (>150×109/L) accurately identified patients who were at very low risk of having clinically significant varices and avoiding screening endoscopy [2]. The LS was considered to be a good single noninvasive variable for identifying patients with CSPH. For predicting the presence of GOV, the new algorithm demonstrated a better diagnostic performance, and the combination of parameters showed superior performance of LS alone for predicting GOV. Our study included a sufficient number of patients and 2 validation sets. The variables selected in the algorithm are easily collected and applicable, and accurately predicted GOV in CHB and non-CHB patients, making it a novel way for patients who need endoscopy. Meanwhile, our new algorithm had a fine diagnostic performance for predicting varices in compensated liver cirrhosis patients, and was better than AAR, FIB-4, APRI and platelet count/spleen diameter ratio that are used to evaluate severe varices in patients with compensated liver cirrhosis.
One study used non-invasive markers to assess the predictive value of esophageal varices and variceal bleeding in Albanian patients diagnosed with liver cirrhosis. A total of 139 newly diagnosed cirrhotic patients without variceal bleeding were included, and the major end point was the first esophageal variceal bleeding event. The results revealed that FIB-4 was the strong and significant predictor of esophageal varices (OR=1.57; 95% CI: 1.15–2.14), but was a poor predictor of EVB (area under the ROC only 0.51) [29]. In contrast, none of the non-invasive markers, such as AST/ALT, APRI, PC/SD, FI, MELD and King's score were considered as useful predictors of EVB in this study. Surprisingly, we found that the new algorithm had a satisfactory value to predict variceal hemorrhage, in which the area under the ROC was 0.92 in CHB patients and 0.84 in other CLDs. Xavier et al. have assessed the prognostic performance of Albumin–Bilirubin, Child–Pugh, and model for end-stage liver disease in patients with liver cirrhosis complicated with acute upper gastrointestinal bleeding. They found that Albumin–Bilirubin score has accurately predicted both in-stay and 30-day mortality, with an area under the curve of 0.80, suggesting that the Albumin–Bilirubin score was particularly useful in assessing short-term outcomes inpatients with liver cirrhosis complicated with acute upper gastrointestinal bleeding [30]. The new algorithm and the Albumin–Bilirubin score demonstrated similar area under the ROC. However, further evaluation on validation set should be performed to confirm the value.
LS is considered as a useful marker for evaluating whether a patient has progressed into GOV based on the Baveno VI guidelines. However, LS is only applicable to CLD patients with HBV or HCV infection. For CLD patients with other etiologies, the clinical performance of LS still requires elucidation. Consequently, patients with CHB were chosen for the training set, and other CLD patients for the validation set. Our present data indicated that the diagnostic algorithm of varices for CHB is also applicable to other CLD patients.
However, this study has some potential limitations. Firstly, CHB patients were chosen for the training set due to their high prevalence in China. More importantly, there was more evidence regarding the predictive value of TE in CHB patients according to the Baveno Consensus. Secondly, the severity of GOV was not classified, and only one cut-off point was chosen to distinguish GOV positive or not, lacking the accurate prediction of whether a patient belongs to high-risk group. Thirdly, the use of TE has several limitations, including high BMI and/or central obesity, necro-inflammatory activity, and extrahepatic cholestasis, and so a low threshold of ALT<60U/L was set, impacting the results toward the more compensated population, and the algorithm might not be suitable in all the patients [31,32].
5ConclusionThe new algorithm based on LS is a reliable model to prognosticate GOV and variceal hemorrhage, and used to stratify not only the high-risk CHB patients, but also to patients with other CLDs for developing GOV and variceal bleeding.AbbreviationsLS liver stiffness chronic hepatitis B hepatitis B virus gastroesophageal varices portal vein diameter splenic thickness platelet count percent of neutrophil granulocyte clinically significant portal hypertension computed tomography transient elastography receiver operating characteristic curve alanine transaminase spleen size-to-platelet ratio score esophageal varices portal hypertension esophageal varices bleeding aspartate transaminase chronic liver disease
Ethics approval and consent to participate: Our retrospective study was approved by the Clinical Ethics Committees of Beijing Ditan Hospital, Capital Medical University (JDLKZ2018-021-01). All patients provided written informed consents in accordance with the Declaration of Helsinki. Availability of data and material: The datasets generated and/or analyzed during the current study are available in the Springer Nature (https://figshare.com/articles/raw_data_xls/6168803).
FundingGrants to conduct this study were provided by the Science Foundation of Capital Medicine Development (2014-2-2171); Capital Foundation for Clinical Characteristic Applied Research Projects (Z141107002514132) and Capital Foundation for Clinical Characteristic Applied Research Projects (Z181100001718084); Beijing Natural Science Foundation (7202071); The Digestive Medical Coordinated Development Center of Beijing Municipal Administration of Hospitals (XXZ0404) to Prof. Hongshan Wei.
Authors’ contributionsWH designed the present study; HL, YJ, YX and YJ collected the clinical data; MJ, LP, HJ, ZY and LX performed statistical analysis; MJ was a major contributor in writing the manuscript. All authors read and approved the final manuscript.
Competing interestsThe authors declare that they have no competing interests.
We acknowledge Dr. Zhenglin Ai for helping statistics data, and other colleagues for clinical data collection.


