


Edited by: Sonia Roman
More infoAppropriate nutritional support may improve energy metabolism in alcoholic liver cirrhosis (ALC) patients. We explored the effect of a late evening snack (LES) and oral amino acid (OAA) capsules on energy metabolism and the Fischer ratio in ALC.
Patients and MethodsNinety-one ALC patients were enrolled and randomly divided into three groups: 31 patients in the LES and OAA group, 32 in the LES group, and 28 controls. Respiratory quotient (RQ), carbohydrate oxidation rate (CHO%), fat oxidation rate (FAT%), serum isoleucine and the Fischer ratio were measured at baseline and at months 1, 3, and 6 of follow-up.
ResultsThe RQ in the LES and OAA group was 0.79 ± 0.06, 0.80 ± 0.04, 0.82 ± 0.04, and 0.82 ± 0.04 at baseline and at months 1, 3, and 6 of follow-up, respectively. These values were significantly higher than those in the LES group (P < 0.05). The RQ in the LES group was significantly higher than that in the control group at month 1 and month 6 (P < 0.05). CHO% in the LES and OAA group was significantly increased and FAT% was significantly decreased at month 3 of follow-up (P < 0.05). In the LES and OAA group, serum isoleucine and the Fischer ratio were markedly increased compared with the LES group and control group (P < 0.05).
ConclusionsLES can significantly increase the RQ in ALC. LES and OAA were more effective than LES alone in improving serum isoleucine and the Fischer ratio.
Recent years have witnessed an increase in the incidence of alcohol-related liver disease, and the burden of alcohol-attributable liver disease has become a major contributor in global liver-related mortality [1–3]. Therefore, clinical management and intervention of alcoholic liver disease should be strengthened [4], [5]. Nutritional intervention is an important medical management strategy for alcoholic liver disease [6]. Further, it is recommended that measurement of the resting energy expenditure (REE) and respiratory quotient (RQ) in cirrhosis is helpful to guide clinical management of alcoholic liver cirrhosis (ALC) [7–9] and improve long-term prognosis [10–12]. Of note, the severity of liver disease and clinical complications of patients can affect energy metabolism [13–15]. Specifically, our previous study showed that concomitant type 2 diabetes significantly increased the REE and decreased the RQ in ALC, and these abnormalities were associated with poor glucose control [16].
Malnutrition is quite common in patients with alcoholic liver disease [4–6]. For these patients, effective nutritional support in addition to absolute alcohol abstinence is pivotal to improve the prognosis. Eating a late evening snack (LES) is recommended as a nutritional intervention for patients with liver cirrhosis or liver failure [6], [17], [18]. Oral branched-chain amino acid (BCAA) preparations have been indicated for the treatment of hepatic encephalopathy and are effective in increasing serum albumin levels. Convergent findings suggest that LES can improve the nutritional status of patients with cirrhosis, and BCAA-rich LES is conducive to the improvement of RQ, serum albumin, and quality of life. However, most previous studies have been conducted among patients with hepatitis B or hepatitis C-related cirrhosis and have included a limited number of participants. Moreover, these investigations have included a short follow-up time, which can lead to questionable results [19–21]. To date, few published studies have been conducted specifically among patients with ALC. Oral amino acid (OAA) capsules contain BCAA compositions and can improve albumin. In addition, OAA capsules are convenient to take orally to reach a high degree of patient compliance during long-term administration. However, whether LES and OAA can improve patients’ energy metabolism indexes and serum amino acid spectrum in patients with ALC is largely unknown.
In this study, patients with ALC were enrolled to explore the effects of different nutritional interventions on energy metabolism indexes and serum amino acid levels.
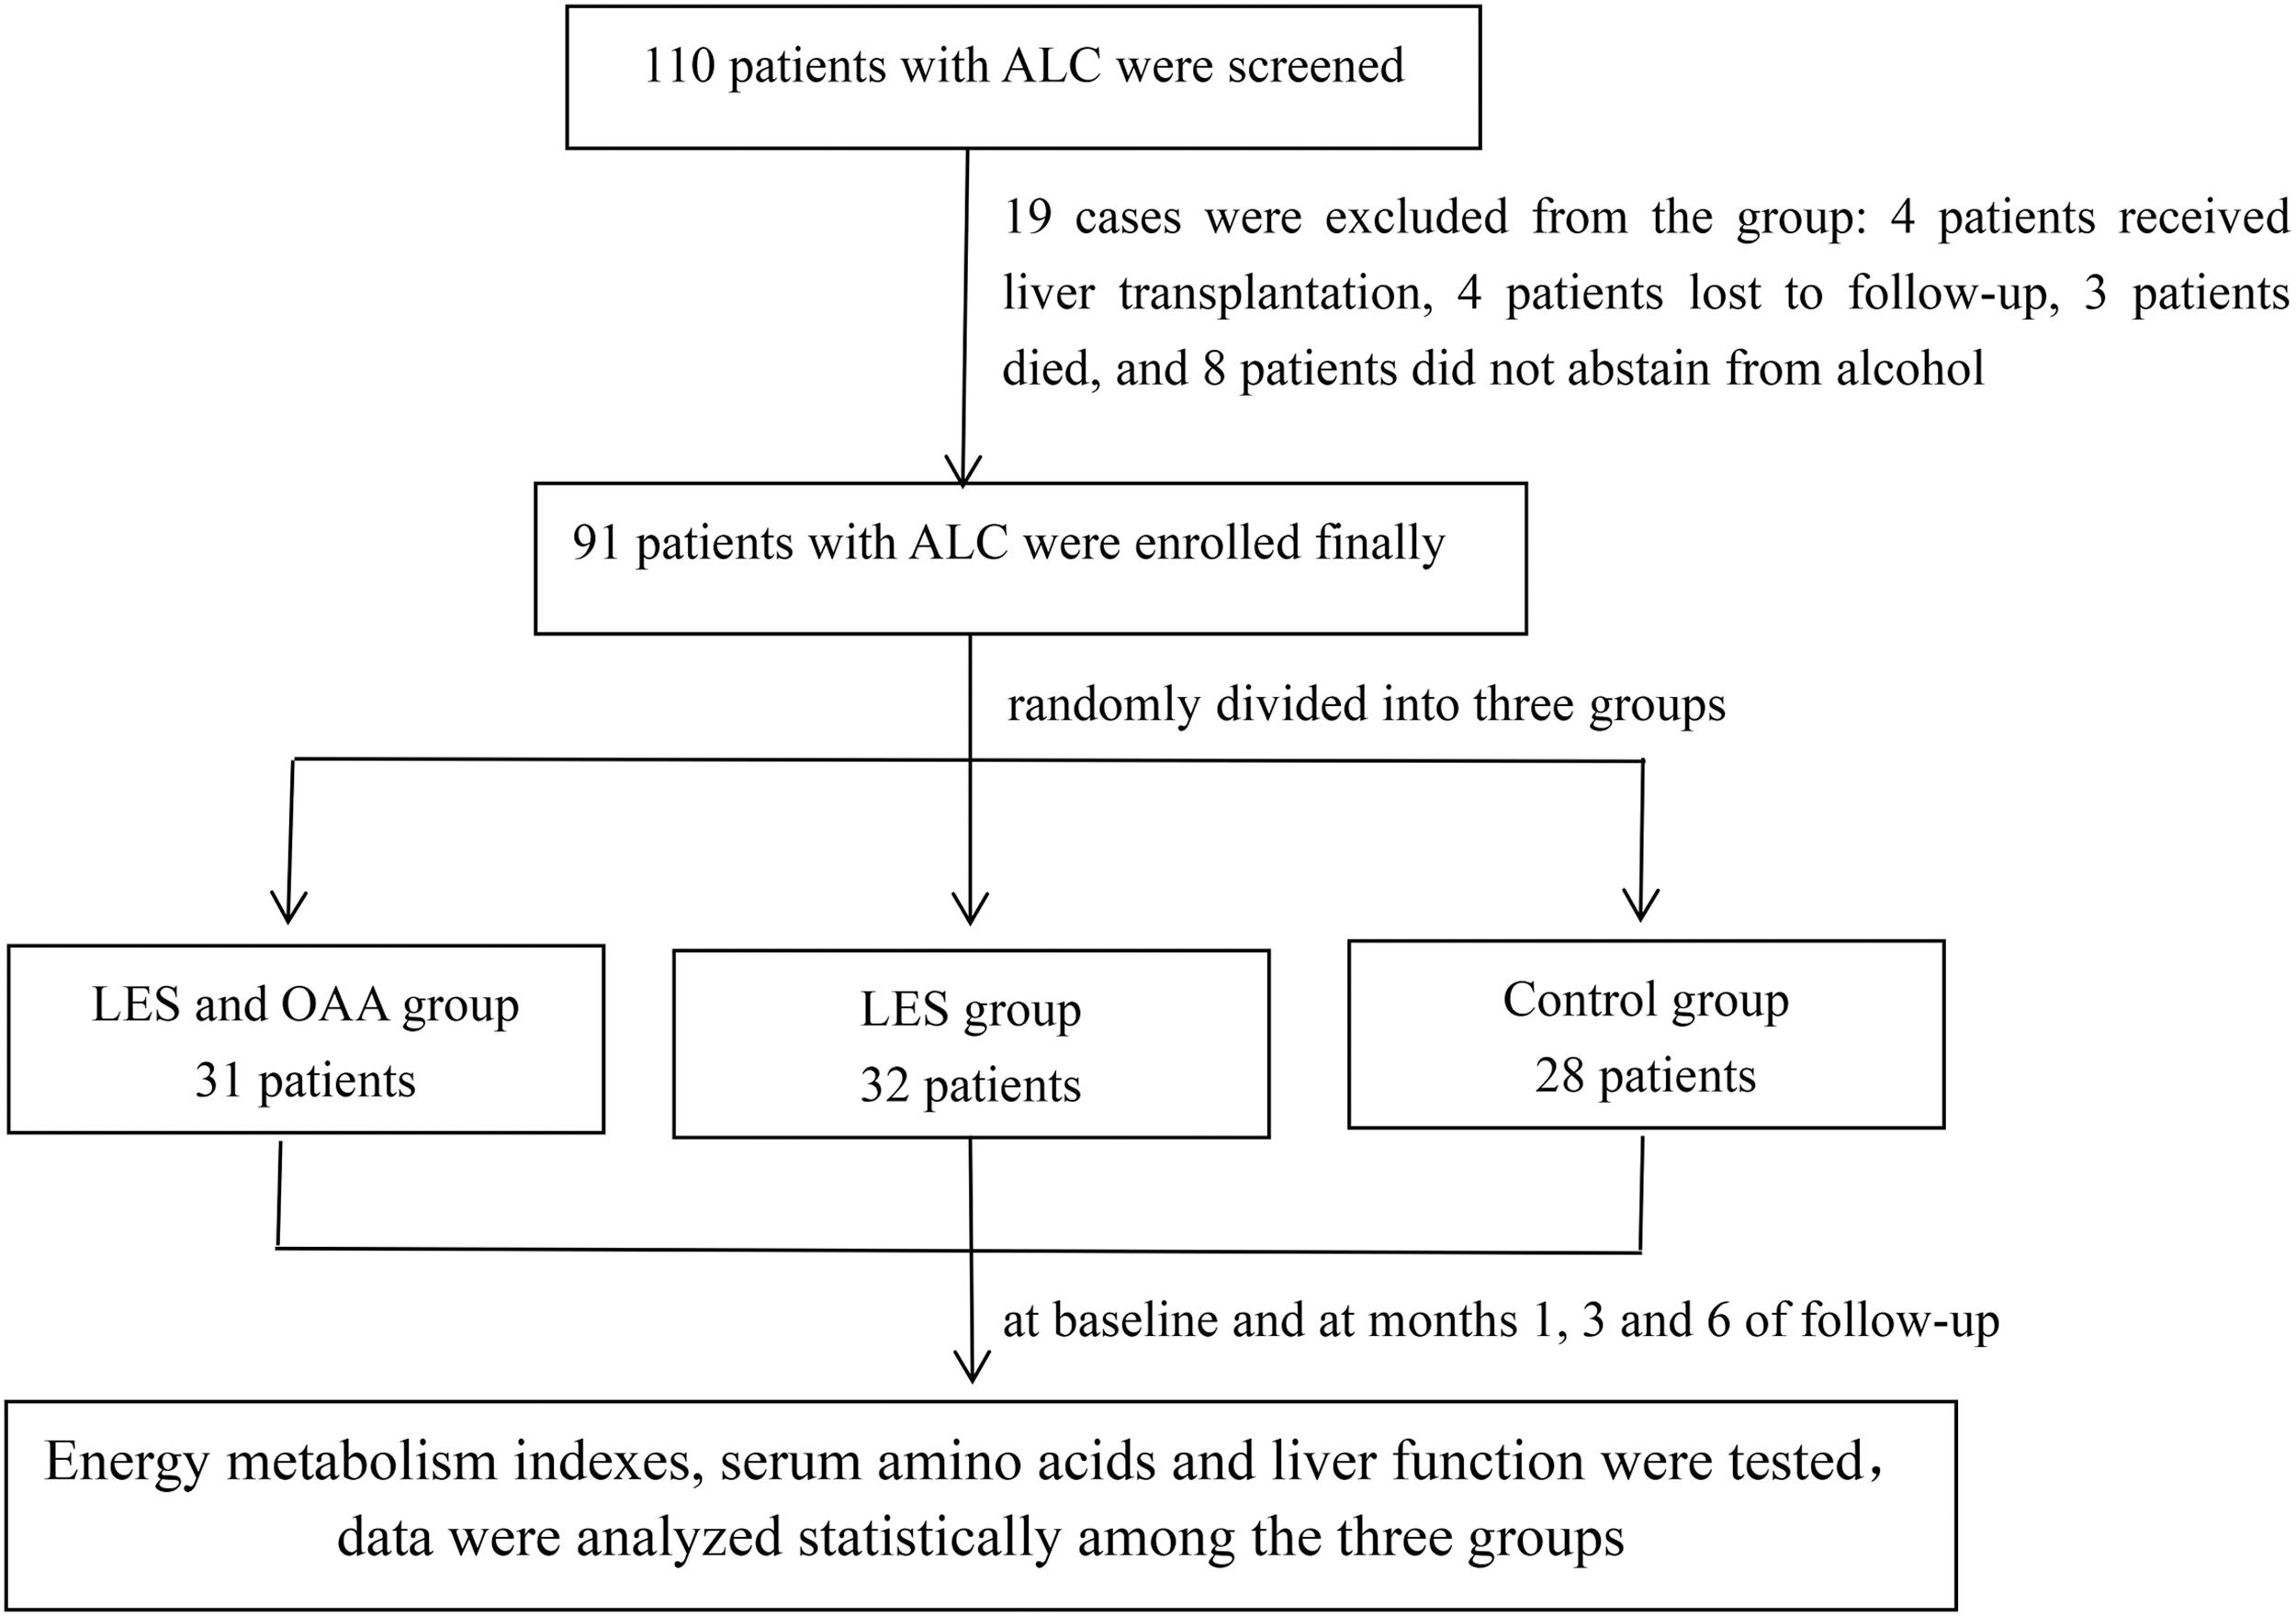
2Methods2.1Study participantsA total of 110 ALC patients were screened, and 91 patients were enrolled in this study between August 2017 and November 2019. All patients eventually enrolled were male. The diagnosis of ALC was based on a combination of features, including a history of significant alcohol intake (≧ 40 g/day, more than 5 years in men), supporting laboratory abnormalities and evidence of liver cirrhosis suggested by ultrasound, computed tomography scan, or magnetic resonance imaging . No patients had any other chronic liver diseases, such as viral hepatitis, autoimmune hepatitis, and drug-induced liver injury. Exclusion criteria were: (1) fever (armpit body temperature > 37.5 °C); (2) hepatocellular carcinoma; (3) acute or chronic renal failure, cardiac failure, respiratory failure; (4) acute variceal bleeding; and (5) patients who were unable to cooperate with indirect calorimetry. All patients stopped drinking alcohol at least 2 weeks before enrollment. A flowchart illustrating the study design is shown in Fig. 1. The total patients were randomly divided into three groups by block randomization, as follows: (1) LES and OAA group (n = 31): apart from abstinence, patients in this group were provided an extra bedtime meal 1 h before going to bed (about 20:00–21:00). Carbohydrate-based foods with approximately 200 kcal, such as sliced bread or lotus root flour, were selected. Besides a high-carbohydrate LES, patients in this group took two OAA capsules three times a day. Each capsule mainly contained 18.3 mg leucine, 5.9 mg isoleucine, 25 mg lysine hydrochloride, 5 mg phenylalanine, 4.2 mg threonine, 6.7 mg valine, 5 mg tryptophan, 18.4 mg methionine, and 0.2 mg folic acid. The capsules were produced by Shenzhen Wanhe Pharmaceutical Co. Ltd. d (Shenzhen, China). (2) LES group (n = 32): apart from abstinence, patients in this group were provided an extra bedtime meal, as in the LES and OAA group but without OAA capsules. (3) Control group (n = 28): patients were abstinent only, without any other nutritional interventions.

The total daily energy intake of the included patients was calculated according to 1.3 times the measured REE 6, with a specific ratio of protein intake of 1.2 – 1.5 g/kg 6. A detailed clinical dietary intake plan was formulated for patients. If a patient had LES, the LES calories were included in the total calories. We conducted detailed pre-enrollment education for patients and their families, and dietary intake was guided by clinical dietitians. In the LES and OAA group, we verified the amino acids purchased by enrolled patients and instructed them to take these. The investigator followed up with the patients over telephone every 2 weeks to ensure that the patients in the OAA group were actually taking the amino acid capsules as required. Energy metabolism indexes, serum levels of amino acids, and liver function were tested at baseline and at months 1, 3, and 6 of follow-up in all three groups.
2.2Study procedureThis study was conducted in accordance with the Declaration of Helsinki and Good Clinical Practice Guidelines and was approved by the Ethics Committee of the Beijing Youan Hospital, Capital Medical University (approval number: BJYAH-EC-2017–16). The clinical study registration number is ChiCTR-IOR-17,012,461 (www.chictr.org.cn). All patients provided written informed consent to participate.
2.3REE, RQ, and nutrient substrate oxidation rateThe REE, RQ, carbohydrate oxidation rate (CHO%), fat oxidation rate (FAT%), and protein oxidation rate (PRO%) were measured using indirect calorimetry (Medgraphics Company, Saint Paul, MN, USA) at baseline and at months 1, 3, and 6 of follow-up in all three groups. The predicted REE (pREE) was calculated with the Harris–Benedict equation, in which REE (kcal/d) = 66 + 5 height (cm) + 13.7 wt (kg) − 6.8 age (years) in male participants.
2.4Analyses of serum amino acids and the Fischer ratioSerum amino acids including isoleucine, leucine, valine, phenylalanine, and tyrosine were evaluated by ultra-fast liquid chromatography tandem quadrupole mass spectrometry. The Fischer ratio was calculated using the formula (isoleucine + leucine + valine)/(phenylalanine + tyrosine).
2.5Laboratory examinationAlanine aminotransferase (ALT), aspartate transaminase (AST), total bilirubin, albumin, fasting blood glucose, triglycerides, cholesterol, and ammonia were measured using a biochemical analyzer (ADVIA2400, USA). A Sysmex XN2000 (Japan) was used to measure peripheral-blood white blood cells, hemoglobin, and platelets. The IL ACL TOP700 (USA) was used to measure the international normalized ratio.
2.6Statistical analysisAll data were analyzed with IBM SPSS 23.0 (IBM Corp., Armonk, NY, USA). Continuous variables are expressed as mean ± standard deviation or median (interquartile range). One-way analysis of variance (ANOVA) was used for comparing differences in continuous variables meeting the criteria for normality. The Kruskal–Wallis H-test was used for comparing continuous variables not meeting the normality criteria. Repeated measures ANOVA was used for comparing continuous variables meeting the normality criteria among the three groups at different follow-up time points. χ2 tests were used for comparing discrete variables, as appropriate. A two-tailed P value < 0.05 was considered to be statistically significant.
3Results3.1Demographic data and laboratory examinations of the three groups at baselineAs shown in Table 1, there was no significant difference in age, height, weight, body mass index, ALT, AST, total bilirubin, albumin, fasting blood glucose, triglycerides, cholesterol, ammonia, international normalized ratio, peripheral-blood white blood cells, hemoglobin, platelets, cases of ascites, spontaneous peritonitis, and Child–Pugh class among the three groups at baseline (P > 0.05). Among all patients, 30 (33%) had type 2 diabetes mellitus; there was no statistically significant difference in the proportion of patients with diabetes among the three groups. The ratio of decompensated cirrhosis (Child–Pugh class B and C) in the LES and OAA group, LES group, and control group was 80.65%, 68.75%, and 85.71%, respectively. No patients had hepatic encephalopathy of grade II or above. Two patients in the LES and OAA group, and one patient in the control group, had hepatic encephalopathy of grade I.
Patient characteristics and the results of laboratory examinations in the three groups at baseline.
ALT, AST, and total bilirubin values are expressed as median (interquartile range); other values are expressed as mean ± standard deviation. LES, late evening snack; OAA, oral amino acid capsules; ALT, alanine aminotransferase; AST, aspartate transaminase.
REE in the LES and OAA group was 1462 ± 246 kcal/d, 1418 ± 214 kcal/d, 1415 ± 205 kcal/d, and 1441 ± 235 kcal/d at baseline and at months 1, 3, and 6 of follow-up, respectively. At these time points, REE in the LES group was 1398 ± 257 kcal/d, 1405 ± 251 kcal/d, 1458 ± 266 kcal/d, and 1503 ± 279 kcal/d, respectively. In the control group, REE was 1432 ± 295 kcal/d, 1449 ± 332 kcal/d, 1470 ± 301 kcal/d, and 1507 ± 291 kcal/d, respectively. The pREE in the LES and OAA group was 1408 ± 148 kcal/d, 1390 ± 141 kcal/d, 1428 ± 167 kcal/d, and 1458 ± 170 kcal/d at baseline and at months 1, 3, and 6 of follow-up, respectively. The pREE at these times points in the LES group was 1468 ± 208 kcal/d, 1465 ± 212 kcal/d, 1532 ± 230 kcal/d, and 1534 ± 238 kcal/d, respectively. In the control group, the pREE was 1444 ± 193 kcal/d, 1439 ± 196 kcal/d, 1468 ± 213 kcal/d, and 1485 ± 247 kcal/d, respectively. At baseline, there were 27 patients (29.7%) with low metabolism of REE/pREE (%) < 90%, 39 (42.9%) with normal metabolism of 90% < REE/pREE (%) < 110%, and 25 (27.5%) with high metabolism of REE/pREE (%) > 110%. No significant differences were observed in the measured value of REE and pREE at different follow-up time points among the three groups (P > 0.05).
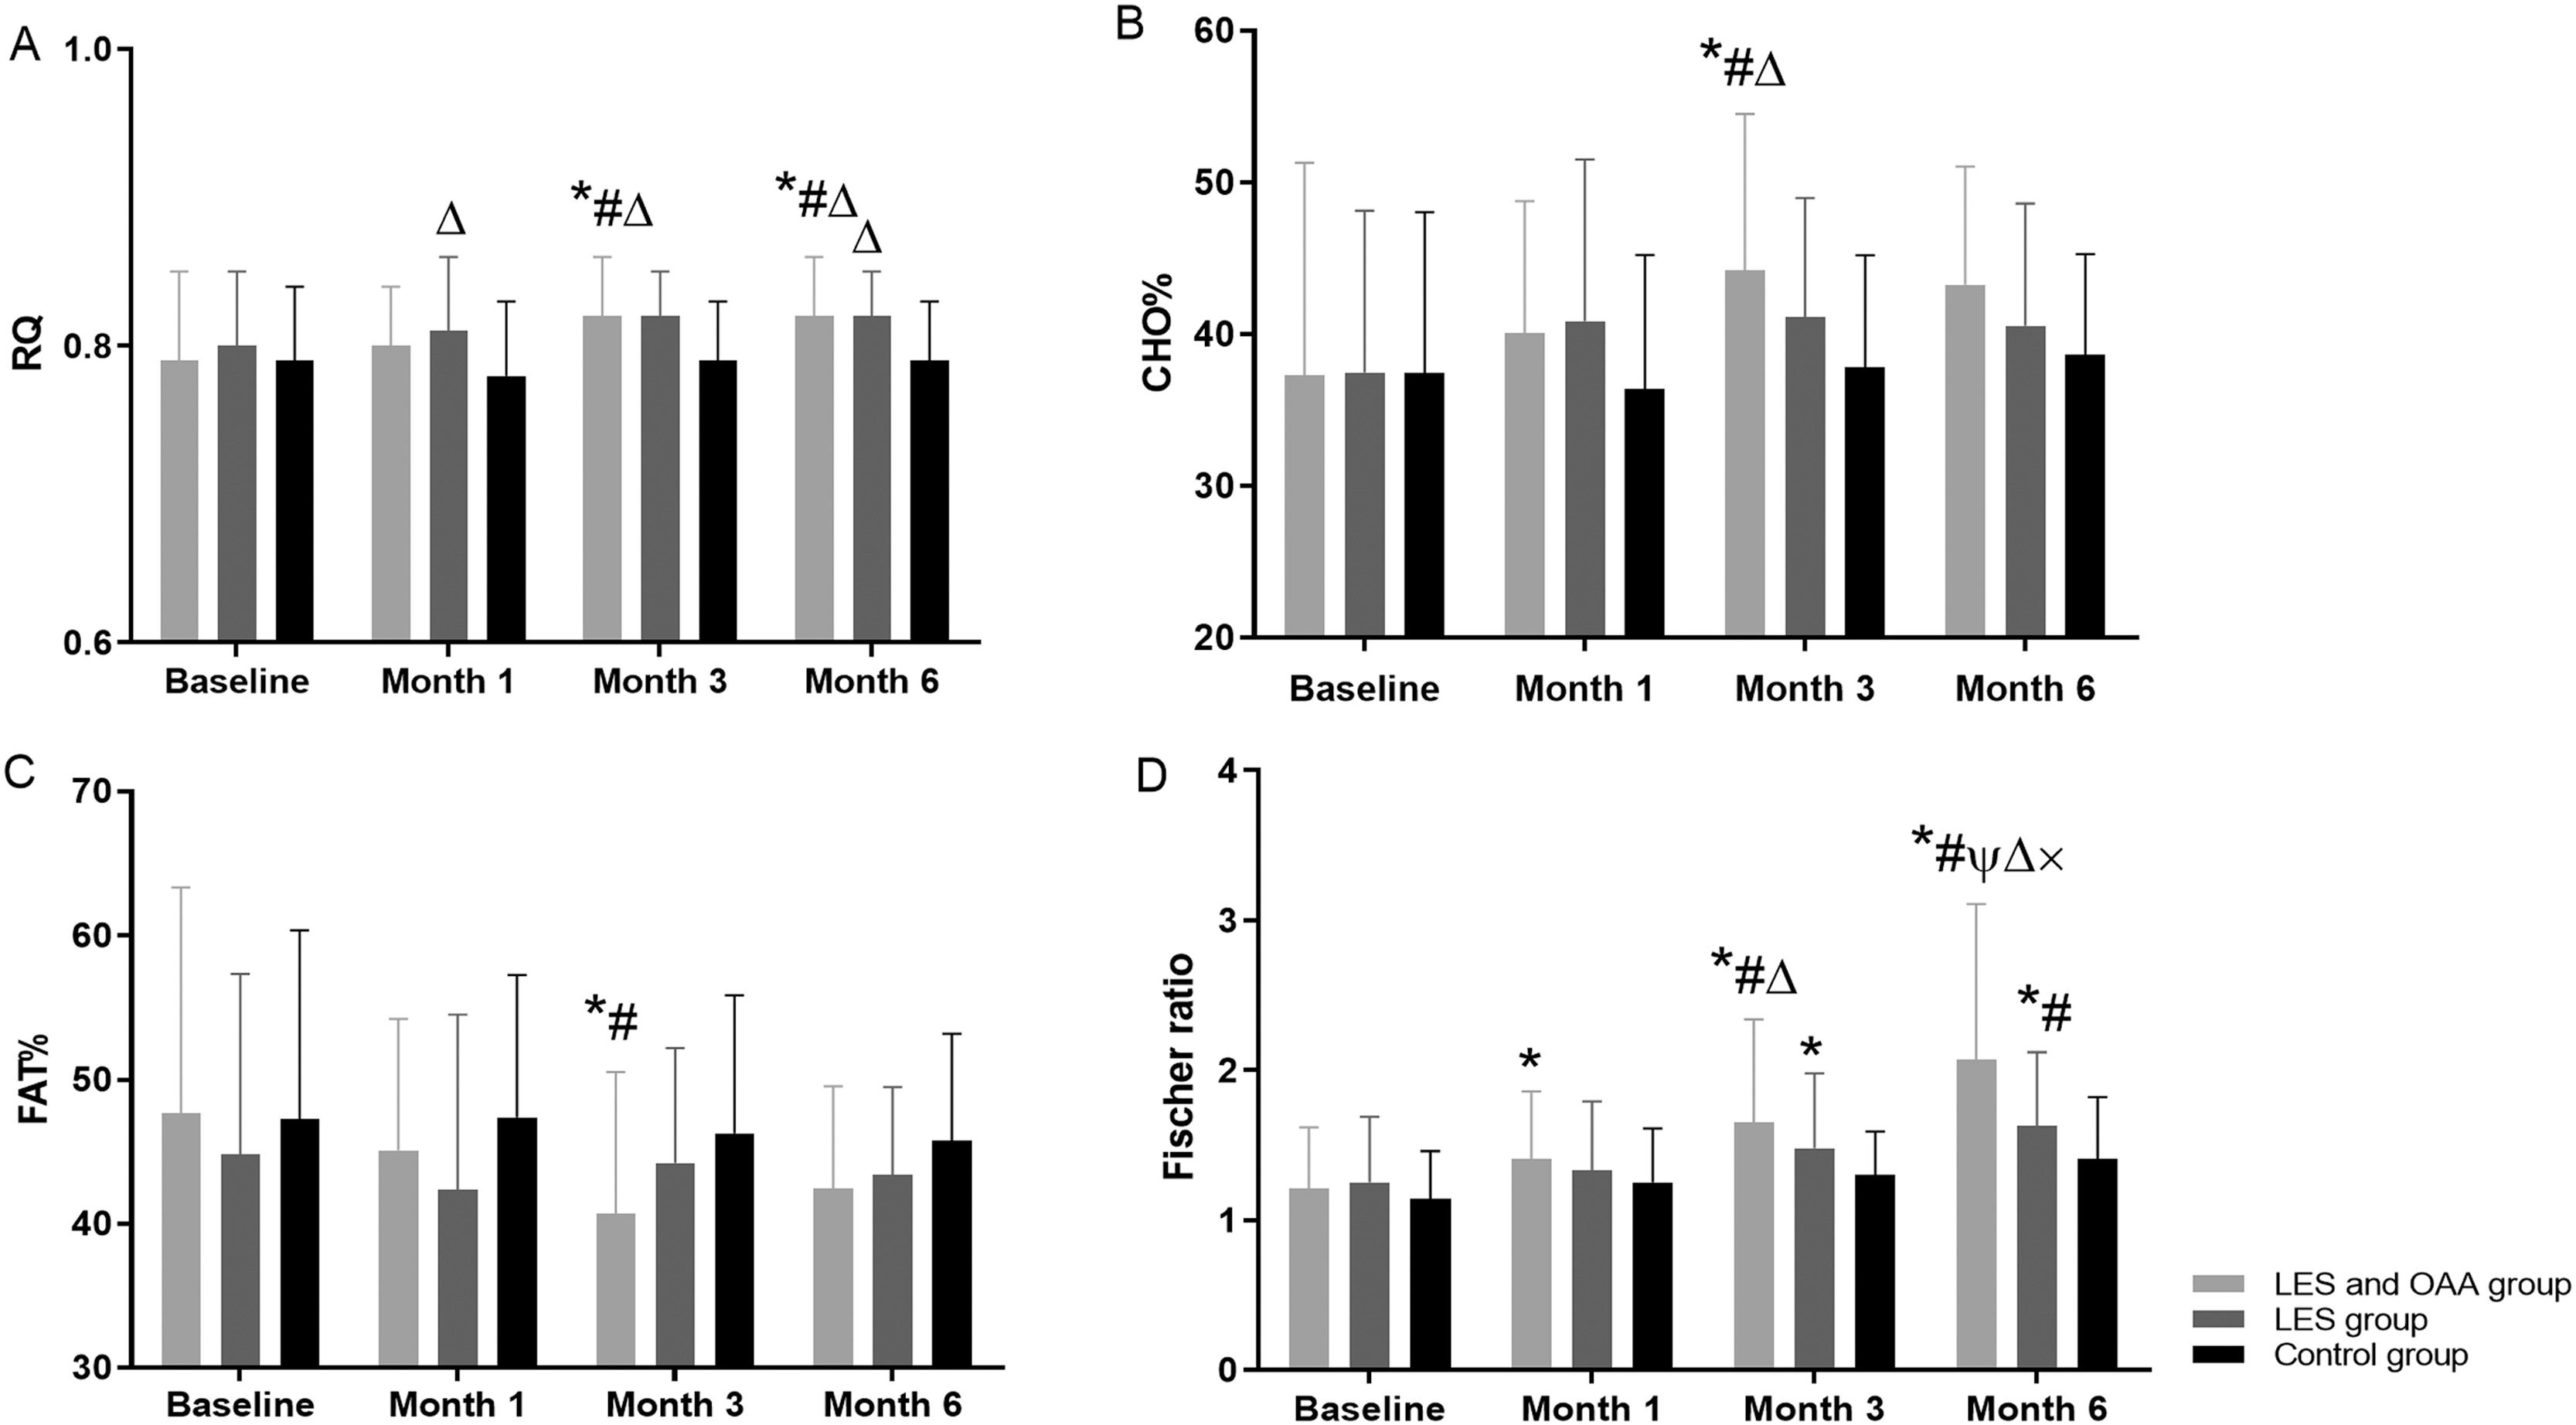
3.3RQ at different follow-up time points among the three groupsFig. 2A shows that RQ improved gradually in both the LES and OAA and the LES groups but did not change significantly in the control group. There were statistically significant differences in the RQ values among the three groups (F = 3.256, P = 0.043) at different follow-up time points (F = 5.098, P = 0.003).

RQ, CHO%, FAT%, and Fischer ratio at different follow-up time points among the three groups. * P < 0.05 compared with baseline; # P < 0.05 compared with month 1; ψ P < 0.05 compared with month 3; △ P < 0.05 compared with the control group; × indicates P < 0.05 compared with the LES group. LES, late evening snack; OAA, oral amino acid capsules; RQ, respiratory quotient; CHO%, carbohydrate oxidation rate; FAT%, fat oxidation rate.
CHO% increased gradually in the LES and OAA group but did not change significantly in the other two groups (Fig. 2B). FAT% decreased gradually in the LES and OAA group but did not change significantly in the LES group and the control group (Fig. 2C). PRO% in the LES and OAA group was 15.06 ± 5.60%, 14.76 ± 4.22%, 15.04 ± 3.56%, and 13.56 ± 4.22% at baseline and at months 1, 3, and 6 of follow-up, respectively. At these time points, PRO% in the LES group was 17.75 ± 9.50%, 16.83 ± 6.80%, 14.30 ± 5.01%, and 16.61 ± 6.15%, respectively. In the control group, PRO% was 15.32 ± 5.68%, 16.21 ± 5.13%, 16.26 ± 5.81%, and 15.87 ± 4.00%, respectively. There was no significant difference in PRO% at different follow-up time points among the three groups (P > 0.05).
3.5Serum amino acids and Fischer ratio at different follow-up time points among the three groupsIn the LES and OAA group, the concentrations of serum isoleucine and valine gradually increased, and the concentration of serum phenylalanine gradually decreased (P < 0.05) (Table 2), but there was no significant difference in the concentrations of leucine and tyrosine (P > 0.05). The Fischer ratio was 2.07 ± 1.04 at month 6 of follow-up in the LES and OAA group, which was significantly improved compared with the LES group and the control group (P < 0.05) (Fig. 2D).
Comparison of serum amino acids at different follow-up time points among the three groups.
The results are expressed as mean ± standard deviation. Repeated measures ANOVA was used for comparison of continuous variables meeting normality criteria in the three groups at different time points. * P < 0.05 compared with baseline; # P < 0.05 compared with month 1; △ P < 0.05 compared with the control group; × P < 0.05 compared with the LES group. LES, late evening snack; OAA, oral amino acid capsules.
As shown in Table 3, the ALT, total bilirubin, and the international normalized ratio were improved to a certain extent, but the differences among the three groups were not statistically significant (P = 0.706, 0.533, and 0.178, respectively). Serum albumin was significantly improved at month 6 of follow-up in the LES and OAA group compared with that at baseline and at month 3 of follow-up (P < 0.05); this did not change significantly in the LES group and control group (P > 0.05). Patients gradually gained weight in all three groups, but the difference in the gained weight was not statistically significant (P > 0.05).
Comparison of laboratory examinations and weight at different follow-up time points among the three groups.
The results are expressed as mean ± standard deviation. * P < 0.05 compared with baseline; # means P < 0.05 compared with month 1; ψ P < 0.05 compared with month 3. LES, late evening snack; OAA, oral amino acid capsules; ALT, alanine aminotransferase; ALB, albumin.
At month 6 of follow-up, there were 9/19/3 patients with Child–Pugh class A/B/C, respectively in the LES and OAA group; 11/19/2, respectively, in the LES group; and 5/15/8, respectively, in the control group. The differences among the three groups were not statistically significant (P = 0.108). In the LES and OAA group, seven patients changed from class C to class B and four patients changed from class B to class A. In the LES group, six patients changed from class C to class B and two patients changed from class B to class A. In the control group, five patients changed from class C to class B and three patients changed from class B to class A, with no statistically significant difference among the three groups (P > 0.05). A total of four patients (one in the LES and OAA group, one in the LES group, and two in the control group) progressed from Child–Pugh class A to class B among 91 patients, and three of these four patients had diabetes. Two patients (one with diabetes) in the control group and no patient in the other two groups progressed from Child–Pugh class B to class C.
At month 6 of follow-up, 22 patients in the LES and OAA group, 21 in the LES group, and 23 in the control group were complicated with ascites; the differences in patients with ascites were not significant (P > 0.05). Two patients in the LES and OAA group, one patient in the LES group, and one patient in the control group had hepatic encephalopathy of grade I; no patient had hepatic encephalopathy of grade II or above at the end of follow-up.
3.7Adverse reactionsIn the LES and OAA group, one patient (3.2%) had mild nausea without other discomfort 3 days after taking OAA during the study, which he resolved on his own. No adverse reactions occurred in the LES group and control group.
4DiscussionIn this study, we investigated the effects of different nutritional interventions on energy metabolism indicators and serum amino acids in male Chinese patients with ALC. Most patients in this study were underweight with body mass index at baseline lower than that in studies on ALC conducted in Europe and North America (22–23 kg/m2 vs. 25.9–28 kg/m2) [22], [23]; however, our patients were similar to those in other regions of Asia (23.7–23.86 kg/m2) [24], [25].
Our main finding was that 27.5% of patients with ALC had elevated REE and showed hypermetabolism at baseline, which is consistent with previous studies among patients with cirrhosis (13.7%–33.8%) [13],[26], [27]. Diabetes was found in 33% of patients, which may be a contributor to hypermetabolism and may adversely affect the prognosis of ALC in the current study [16], [28]. There were no significant changes in measured REE and pREE among the three groups during the follow-up period. REE and RQ reflect two aspects of energy metabolism measurement. REE is usually used to guide the total energy intake [6], [8], whereas RQ is mainly used to evaluate the effect of nutritional intervention. RQ can indirectly reflect the oxidation rate of the three nutrient substrates: carbohydrate, fat, and protein. RQ is approximately 0.85 in a healthy adult with mixed food in a balanced state. The lower the RQ, the more serious the imbalance of nutrient metabolism. At baseline, we found metabolic disorders in our patients with ALC, represented by decreased RQ, decreased CHO%, and increased FAT%. Dietary intake, especially carbohydrate intake, was significantly reduced in patients with ALC. Most enrolled patients had decompensated cirrhosis (mean 78%); decreased liver function also affects the oxidative metabolism of nutrients [7], [14]. Compared with liver cirrhosis caused by hepatitis B, energy metabolism disorder is more obvious in ALC patients [7], [17]. Therefore, greater attention should be paid to nutritional management and intervention in patients with ALC.
Another main finding of this study is that RQ improved significantly after 3–6 months of intervention in both the LES and OAA and the LES groups, as compared with the control group, indicating an improvement of metabolic state in these patients. This concurred with the results of Greco et al. [29]. that the RQ value of cirrhotic patients was lower and the lipid oxidation rate was higher than that of healthy controls. Similarly, our previous study showed that in the cases of chronic hunger or malnutrition, a low RQ value indicates an increase in fat and protein oxidation and a decrease in carbohydrate oxidation, which contribute to the poor prognosis of patients with cirrhosis [13]. In addition, Belarmino et al. [11] suggested that RQ can be used as an indicator of improvement in energy metabolism among patients with ALC after nutritional intervention. In the current study, although it was still abnormal, the RQ was approximately 0.82 (approaching 0.85) in both the LES and OAA and the LES groups after 6 months of intervention, suggesting the efficiency of the two means of nutritional support investigated in our study. Research has shown that with more severe liver disease, the RQ value is lower [13], [14], [17]. Improvement in the RQ value is limited by the grade of cirrhosis and complications. In our study, most patients had decompensated cirrhosis, which may partly explain why the imbalance of nutritional metabolism was not easy to improve. Furthermore, we found that the addition of OAA to LES can improve the oxidation rate of nutrient substrates by increasing the CHO% and decreasing the FAT% at month 3 of follow-up, suggesting that OAA may help improve the oxidation rate of nutrients but requires a long period of patient compliance. During the nutritional intervention, REE was used for caloric guidance, and the RQ value was used to assess prognosis [10–12]. When the improvement in RQ value is small, the improvement in the oxidation ratio of the three nutrients is an alternative indicator that can be used to evaluate the effect of nutritional intervention.
Finally, compared with LES, LES and OAA significantly increased the concentrations of isoleucine and improved the Fischer ratio in our study. This is consistent with studies using LES in combination with BCAA for cirrhosis mostly caused by viral hepatitis [21], [30–32]. Saeki et al. [33] found that low serum BCAA was associated with sarcopenia in patients with liver cirrhosis. Abstinence from alcohol is beneficial for liver function [34], and an increase in albumin indicates the improvement of nutritional status. LES is an effective intervention to reverse anabolic resistance and muscle loss in cirrhosis [35], and OAA provides materials for protein synthesis. We also found a significant improvement in serum albumin after 6 months of intervention in the LES and OAA group, indicating an improvement in nutritional status. Of note, the increase in serum albumin was 3 months later than the improvement in RQ, also suggesting that nutritional support requires long-term adherence in patients with ALC. Overall, we found that LES and OAA were more effective in improving nutritional metabolism and protein synthesis in patients with ALC. In terms of Child–Pugh class, although there was no statistically significant difference among the three groups (P = 0.108), we did observe changes in the Child–Pugh class with more cases of class A in both the LES and the LES and OAA groups compared with control group after 6 months of intervention. This promisingly indicated that nutritional therapy was considerable pivotal to patients with ALC to improve even reverse their disease severity, and also helped clinicians pay much attention to early nutritional intervention in their clinical practice.
In summary, our results showed that there was a significant imbalance of nutrient substrate oxidation in patients with ALC. We also revealed the beneficial effects of different nutritional interventions on energy metabolism and serum amino acids, as well as the differences among them, which can be helpful to formulate nutritional intervention programs.
Because men comprise the main group with alcoholic liver diseases [36], [37], the inclusion of male patients in this study makes our research results more representative. However, some potential limitations should be acknowledged. This study included a limited number of patients. In addition, the study had a short follow-up period (6 months), which may not be sufficient to observe long-term outcomes. Consequently, larger studies involving more participants and a longer follow-up period are needed to confirm the beneficial effect of LES and OAA in patients with ALC.
5ConclusionsIn conclusion, the present study demonstrated that LES can significantly increase the RQ in patients with ALC. Additionally, LES and OAA were more effective than LES alone in increasing the concentrations of isoleucine and improving the Fischer ratio in these patients. We recommend the use of LES and OAA as a preferred long-term nutritional intervention for patients with ALC.
Author contributionsQHM designed the study and revised the article. JZ reviewed the literature, conducted statistical analysis, and wrote the article. JZ, JW and QHM revised the article. JL conducted clinical treatment of the patients. ZYW measured the indirect energy metabolism. All authors read and approved the final manuscript.
This study is supported by the Scientific Research Project of Youan Hospital, CCMU, 2018, China Primary Health Care Foundation - Youan Foundation of Liver Disease and AIDS (No. YNKTQN20180208).


