


Acute on chronic liver failure (ACLF), leads to high mortality. These patients are at risk of being delisted for liver transplantation (LT). Emerging data shows 1y post-transplant survival of 80–92%. The Share 35 (S35) policy was implemented to prioritize patients with MELD ≥35 on the LT waitlist. Our aim was to compare the LT outcomes of ACLF patients as a result of S35.
Materials and methodsData from the UNOS scientific registry were used to classify ACLF patients using the NACSELD criteria. For the analyses, data were divided into two eras; 2 years before S35 (Era 1) and 2 years after S35 (Era 2). Waitlist status was classified into categories: Transplanted, Death or Too Sick to Transplant and Still Waiting/Other. LT cumulative incidence between the populations in the eras was calculated using Fine and Gray's method. A proportional hazards model was used to investigate the era effect on cumulative incidence of LT.
Results46,861 patients were reviewed, of which 817 had ACLF. 366 patients (mean MELD: 37.1) were identified in Era 1 and 451 patients (mean MELD: 37.3) in Era 2. We found that ACLF patients were more likely to receive a liver transplant in Era 2 (p=0.0074). In both eras, transplanted patients had a significantly higher survival than those who were not transplanted (p<0.0001).
ConclusionsOur study shows that S35 improved LT rate for ACLF suggesting that there should be broader recognition of ACLF and early transplantation should be pursued.
Acute on chronic liver failure (ACLF) is characterized by acute hepatic decompensation, of two or more extra-hepatic organ failures and an associated 28-day mortality of 15% [1–5]. ACLF occurs in nearly 30% of hospitalized patients with cirrhosis and the care of these patients carries risk and large financial implications [1,6]. The North American Consortium for the Study of End-Stage Liver Disease's definition of acute-on-chronic liver failure (NACSELD-ACLF) as two or more extrahepatic organ failures was independently validated in a separate large multinational prospective cohort as a simple, reliable bedside tool to predict 30-day survival in both infected and uninfected patients hospitalized with a diagnosis of cirrhosis to allow for faster recognition of ACLF and guide prioritization for liver transplantation (LT) [5]. However, management of LT prioritization, particularly those with the highest acuity remains controversial. LT is only available to <10% of all candidates each year and patients with ACLF are often at risk of being delisted or not considered LT candidates for a number of reasons, resulting in mortality rates approaching 80% at 28 days and greater than 90% at 1 year without LT [1,4,7,8]. However, emerging data has shown that 1-year post transplant survival in patients with ACLF is between 80 and 92% compared to a 1 year waitlist survival without LT of 23.5%, supporting LT as a viable therapeutic option [9].
LT priority for patients with ACLF is currently guided by the Model for End Stage Liver Disease (MELD) scoring system which is well validated for patients with chronic hepatic decompensation but not for ACLF. Since MELD does not capture several extrahepatic organ failures, it is very possible that certain patients with advanced grade ACLF will have a high short-term mortality regardless of their MELD score, and as has been demonstrated recently [10].
Currently liver grafts are distributed geographically based on MELD score in Organ Procurement and Transplant Network (OPTN) sharing areas consisting of local, regional and national tiers. To facilitate liver graft allocation to those patients with high wait list mortality, regional sharing for patients with a MELD 35 was implemented in June of 2013 with the goal of increasing lifesaving liver transplant for the sickest patients and decreasing death on the waiting list (“Share 35”). The aim of our study was to compare the waitlist and liver transplantation outcomes of patients diagnosed with ACLF, within the current allocation system pre-and post-implementation of Share 35 (S35).
2Methods2.1Patients and methodsThe study protocol was approved by the Institutional Review Board at our institution.
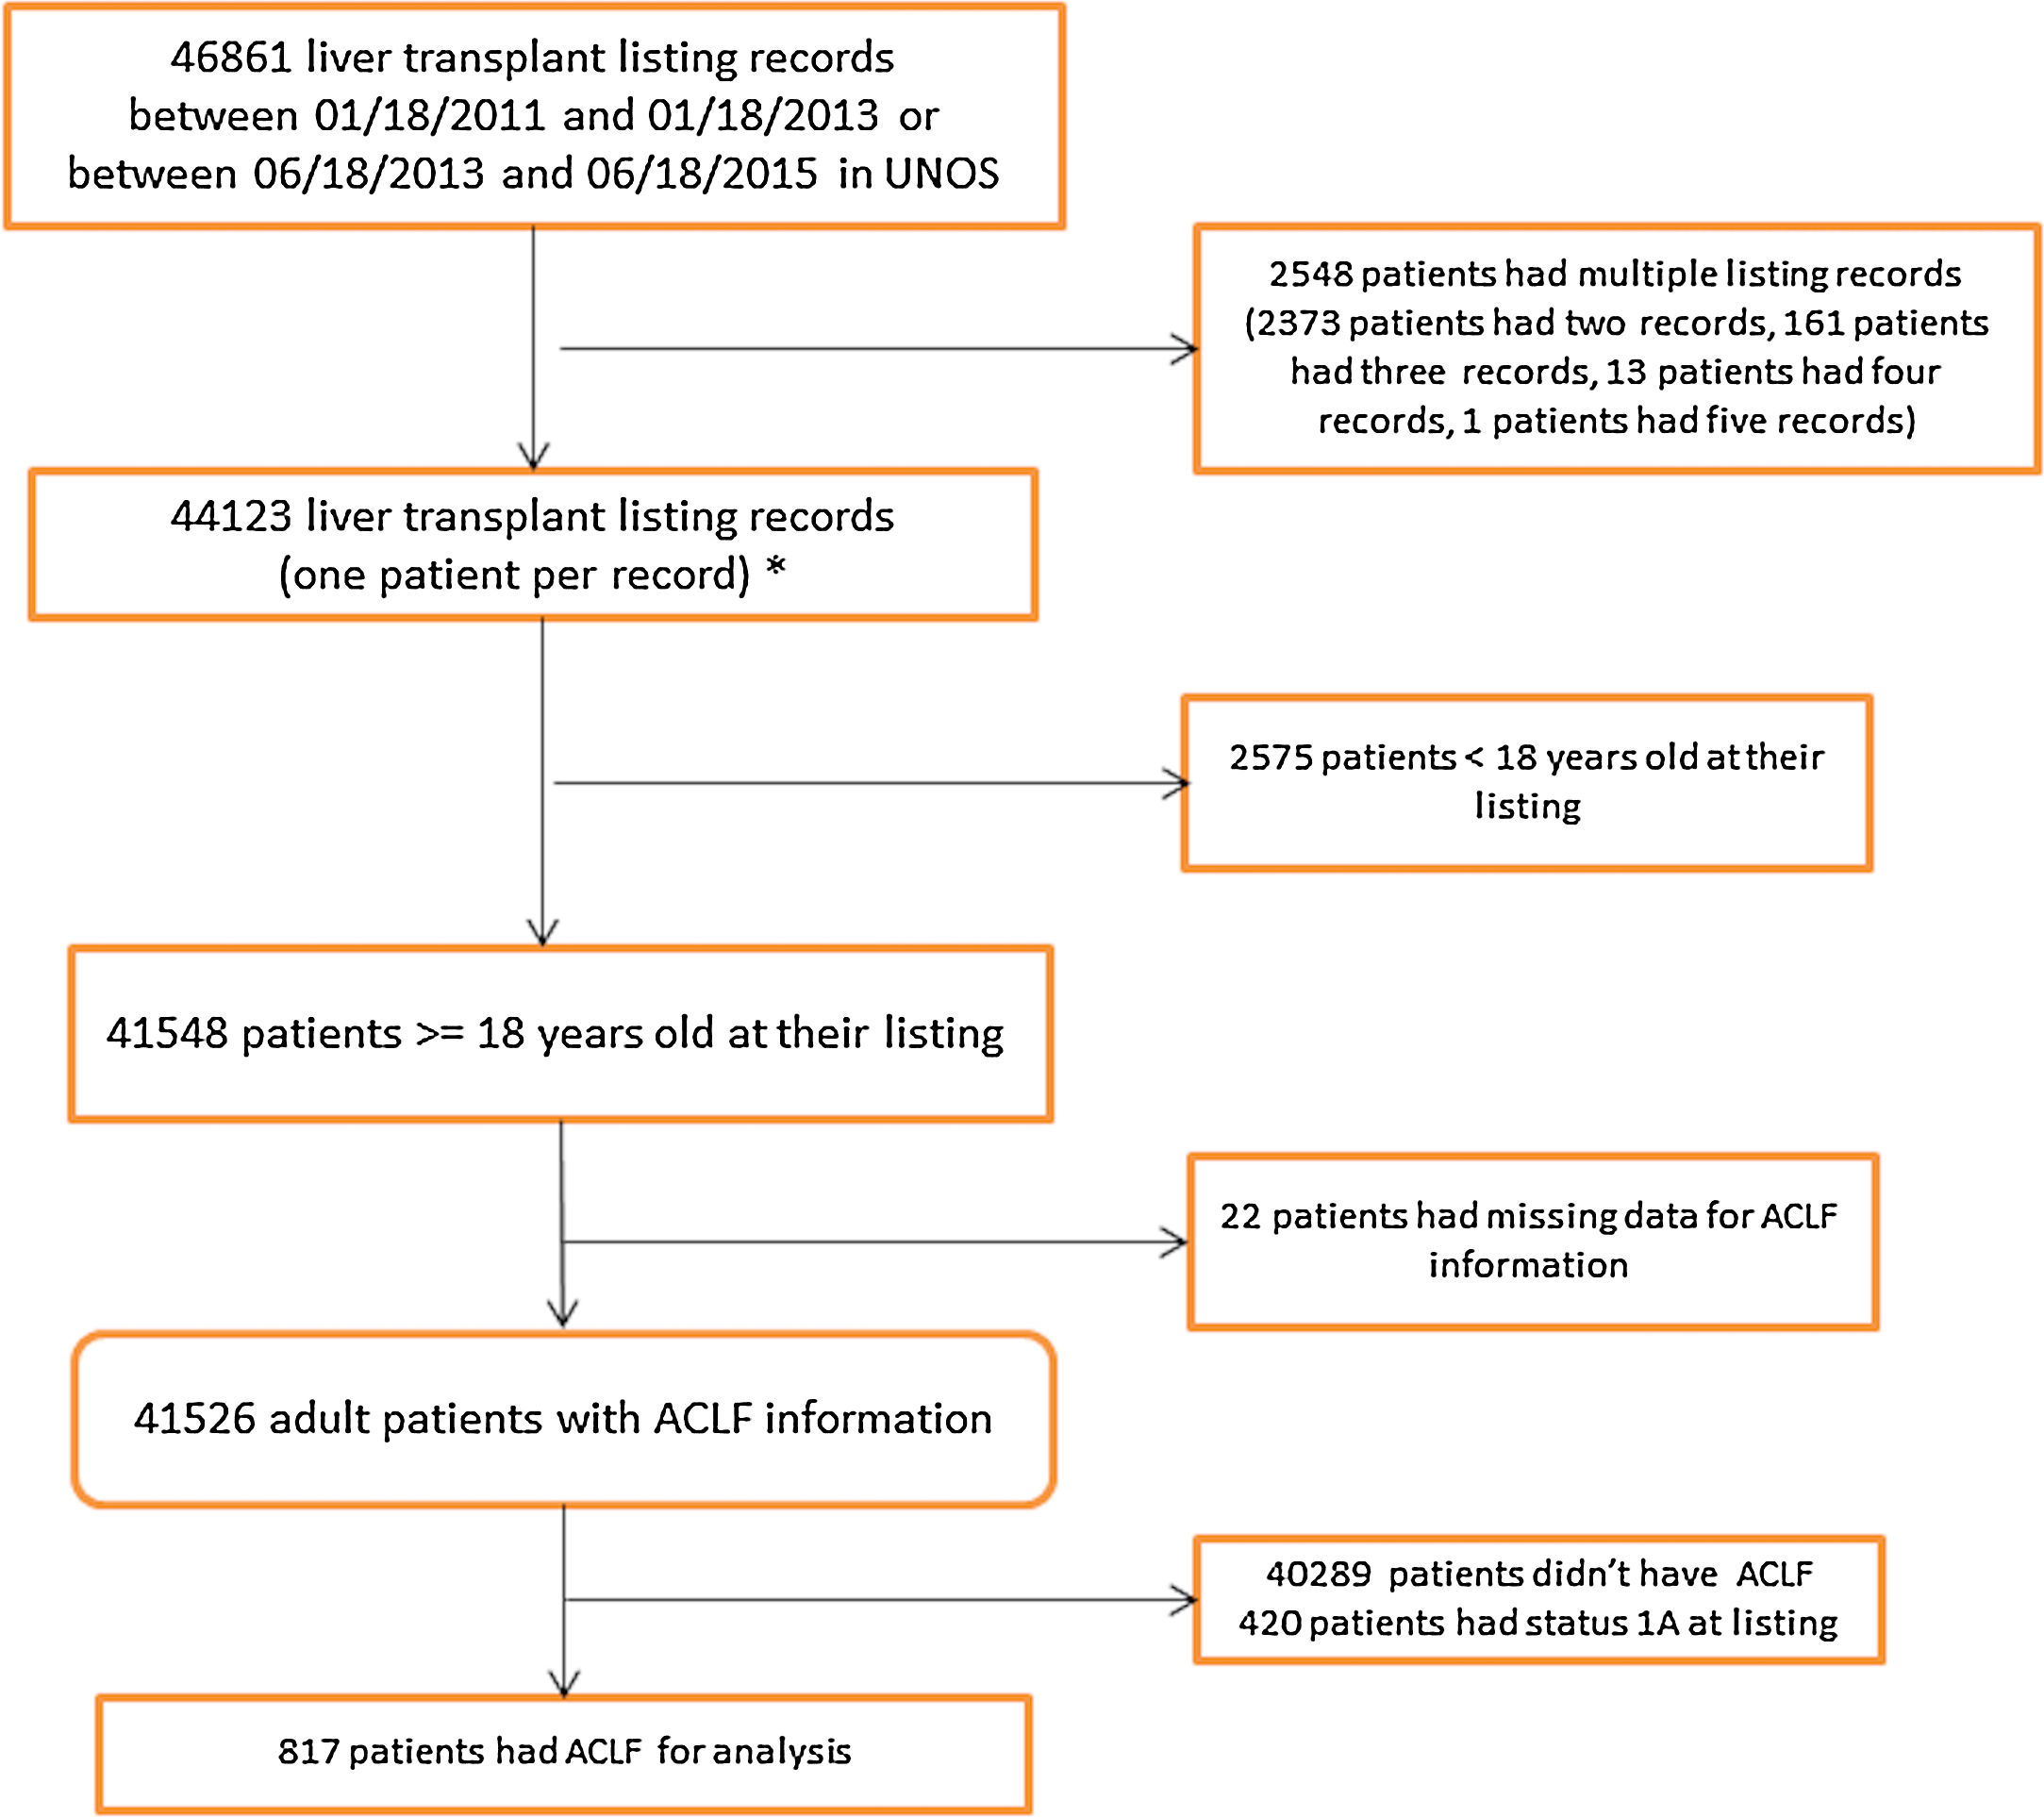
2.2United Network for Organ Sharing Database AnalysisData were obtained and extracted from the United Network for Organ Sharing (UNOS) standard analysis and research file. The study population included patients on the waitlist for LT in the United States from January 18, 2011 to June 18, 2015. Since S35 was implemented in June 2013, the dates were chosen so that we had two equal time periods, pre-and post-implementation, with a minimum of one year of follow-up. Data were divided in to two eras; the two years pre-implementation of S35 (Era 1) (01/18/2011 to 01/18/2013) and the two years post-implementation (Era 2) (6/18/2013 to 6/18/2015). The Era 1 cohort listing dates were moved back six months to avoid overlap with the Era 2 cohort by 180 days (Fig. 1).
2.3Identification of ACLF
The study population was categorized as having ACLF at the time of waitlist registration using the NACSELD-ACLF criteria of having any two or more of the following: circulatory failure, shock requiring vasopressors; brain failure (grade 3 or 4 hepatic encephalopathy); renal failure (renal replacement therapy) and/or respiratory failure (mechanical ventilation). Given the lack of necessary data to assess for organ failure at time of waitlist removal or death, we were unable to evaluate for presence of ACLF at these time points. We used non-invasive and invasive mechanical ventilation as a surrogate marker for respiratory failure and use of inotropes as surrogate marker for circulatory failure.
2.4OutcomesThe primary outcome was time to LT and cumulative incidence of LT from waitlist registration. Patients’ wait list status was classified into 3 categories: 1. Transplanted, 2. Death or Too Sick to Transplant, and 3. Still Waiting/Other (censored on their last follow up date). LT was treated as the outcome of interest while death or too sick to transplant was treated as competing risk events (event that will prevent LT from happening).
Secondary outcomes included wait-list registration outcomes and one-year post transplant survival.
2.5Statistical analysisDemographics and clinical characteristics between Era 1 and Era 2 population were compared using two sample t-test, Wilcoxon rank sum test, Chi-square test or Fisher's exact test when appropriate.
Median time to LT and cumulative LT incidence was estimated using Fine and Gray's method while treating death or too sick to liver transplant as competing risk events. Gray's k-sample test was used to test if there is equality of cumulative incidence function between the populations in the two eras. To study the effect of S35 on the cumulative incidence function of LT, Fine and Gray's multiplicative sub distribution hazard model was used to estimate the hazard ratio for post-share era vs. pre-share era in a multivariable model in which age, gender and MELD score at listing potential confounders were adjusted. The hazard ratio from this model here is interpreted as comparison between the probability of getting LT in the post-share era compared to the probability of getting LT in the pre-share era at any point time. Therefore, a hazard ratio significantly greater than 1 indicates that post-share era is more likely to get LT compared to pre-share era.
Log-rank test was used to compare the Kaplan–Meier survival curves for the two eras. Cox regression was further used to investigate if there is any difference in overall survival between the two eras after adjusting for age, gender and MELD score at listing. Due to recent follow up data not available for patients in Era 2, all the patients were censored at three years from time of listing to make the comparison fair between the two eras. SAS 9.3 was used to analyze the data.
3Results3.1Study population characteristicsA total of 46,861 records were reviewed of which 817 had ACLF per NACSELD criteria for analysis (Fig. 1). 366 patients with a mean MELD of 37.1 at listing were identified in Era 1 and 451 patients with a mean MELD of 37.3 in Era 2 (Table 1). There were no differences in gender distribution, BMI or presence of ascites. The distribution of cases of ACLF was also similar, although some numerical differences began to become apparent in Era 2 but were not statistically significant. In Era 1, 185 (50.5%) ACLF patients were transplanted compared to 264 (58.5%) in Era 2. No relevant differences were found in the donor characteristics or donor risk index between the two eras except in share type where there was a statistically significant increase in regional sharing from 21.4% in Era 1 to 57.9% to Era 2 (p<0.001) (Table 2).
Demographics and clinical characteristics comparison between two era population.
| Era | Total (N=817) | p-Value | ||
|---|---|---|---|---|
| Era 1 (01/18/2011 to 01/18/2013) (N=366) | Era 2 (06/18/2013 to 06/18/2015) (N=451) | |||
| Calculated age at listing | 0.6442a | |||
| N (Missing) | 366 (0) | 451 (0) | 817 (0) | |
| Mean (SD) | 53.7 (11.2) | 53.3 (11.3) | 53.5 (11.3) | |
| Median (IQR) | 56 (48, 62) | 55 (47, 62) | 55 (47, 62) | |
| Range | 20.0, 77.0 | 21.0, 75.0 | 20.0, 77.0 | |
| Recipient gender, n (%) | 0.1288b | |||
| F | 151 (41.3%) | 210 (46.6%) | 361 (44.2%) | |
| M | 215 (58.7%) | 241 (53.4%) | 456 (55.8%) | |
| MELD lab score | 0.7111a | |||
| N (Missing) | 366 (0) | 451 (0) | 817 (0) | |
| Mean (SD) | 37.1 (7.8) | 37.3 (7.2) | 37.2 (7.5) | |
| Median (IQR) | 38 (33, 42) | 38 (33, 42) | 38 (33, 42) | |
| Range | 10.0, 58.0 | 11.0, 57.0 | 10.0, 58.0 | |
| BMI | 0.5301a | |||
| N (Missing) | 362 (4) | 450 (1) | 812 (5) | |
| Mean (SD) | 29.7 (7.3) | 30.0 (6.8) | 29.9 (7.0) | |
| Median (IQR) | 29 (25, 35) | 29 (25, 34) | 29 (25, 34) | |
| Range | 11.8, 56.9 | 16.3, 57.8 | 11.8, 57.8 | |
| INR | 0.3105c | |||
| N (Missing) | 366 (0) | 451 (0) | 817 (0) | |
| Mean (SD) | 2.5 (1.2) | 2.6 (1.2) | 2.5 (1.2) | |
| Median (IQR) | 2 (2, 3) | 2 (2, 3) | 2 (2, 3) | |
| Range | 0.9, 10.8 | 1.0, 10.2 | 0.9, 10.8 | |
| Serum creatinine | 0.4554c | |||
| N (Missing) | 366 (0) | 451 (0) | 817 (0) | |
| Mean (SD) | 2.5 (1.8) | 2.5 (1.8) | 2.5 (1.8) | |
| Median (IQR) | 2 (1, 4) | 2 (1, 3) | 2 (1, 4) | |
| Range | 0.1, 8.9 | 0.1, 10.5 | 0.1, 10.5 | |
| Serum sodium | 0.4385c | |||
| N (Missing) | 366 (0) | 451 (0) | 817 (0) | |
| Mean (SD) | 138.1 (5.1) | 138.4 (5.6) | 138.3 (5.4) | |
| Median (IQR) | 138 (135, 141) | 138 (135, 142) | 138 (135, 141) | |
| Range | 117.0, 153.0 | 118.0, 156.0 | 117.0, 156.0 | |
| Albumin | 0.2634c | |||
| N (Missing) | 366 (0) | 451 (0) | 817 (0) | |
| Mean (SD) | 3.2 (0.9) | 3.2 (0.9) | 3.2 (0.9) | |
| Median (IQR) | 3 (3, 4) | 3 (3, 4) | 3 (3, 4) | |
| Range | 1.5, 7.3 | 1.0, 7.3 | 1.0, 7.3 | |
| Bilirubin | 0.0445c | |||
| N (Missing) | 366 (0) | 451 (0) | 817 (0) | |
| Mean (SD) | 20.3 (15.1) | 17.7 (13.1) | 18.9 (14.1) | |
| Median (IQR) | 17 (8, 32) | 15 (6, 26) | 16 (7, 29) | |
| Range | 0.6, 85.7 | 0.5, 57.9 | 0.5, 85.7 | |
| Ascites, n (%) | 0.5549b | |||
| Absent | 23 (6.3%) | 26 (5.8%) | 49 (6.0%) | |
| Slight | 102 (27.9%) | 112 (24.8%) | 214 (26.2%) | |
| Moderate | 241 (65.8%) | 313 (69.4%) | 554 (67.8%) | |
| ACLF Grade, n (%) | 0.8725d | |||
| 2 | 271 (74.0%) | 341 (75.6%) | 612 (74.9%) | |
| 3 | 93 (25.4%) | 107 (23.7%) | 200 (24.5%) | |
| 4 | 2 (0.5%) | 3 (0.7%) | 5 (0.6%) | |
ACLF: Acute-on-chronic liver failure; BMI: body mass index; INR: international normalized ratio; IQR: interquartile range; MELD: Model for End-Stage Liver Disease; SD: standard deviation.
Donor characteristics comparison between pre- and post-35 era groups.
| Era | p-Value | ||
|---|---|---|---|
| Era 1 (01/18/2011 to 01/18/2013) (N=187) | Era 2 (06/18/2013 to 06/18/2015) (N=266) | ||
| Dialysis twice in prior week at removal, n (%) | 0.065a | ||
| N | 55 (29.4%) | 58 (21.8%) | |
| Y | 132 (70.6%) | 208 (78.2%) | |
| Donor age (years), n (%) | 0.019a | ||
| <40 | 91 (48.7%) | 160 (60.2%) | |
| 40–49 | 37 (19.8%) | 38 (14.3%) | |
| 50–59 | 46 (24.6%) | 45 (16.9%) | |
| 60–69 | 11 (5.9%) | 23 (8.6%) | |
| 70+ | 2 (1.1%) | 0 (0.0%) | |
| Donor type, n (%) | 0.501a | ||
| Deceased donor – DBD | 180 (96.3%) | 259 (97.4%) | |
| Deceased donor – DCD | 7 (3.7%) | 7 (2.6%) | |
| Split or partial LT, n (%) | 0.401a | ||
| No | 187 (100.0%) | 265 (99.6%) | |
| Yes | 0 (0.0%) | 1 (0.4%) | |
| Donor ethnicity, n (%) | 0.461a | ||
| White | 113 (60.4%) | 157 (59.0%) | |
| Black | 31 (16.6%) | 45 (16.9%) | |
| Hispanic | 31 (16.6%) | 55 (20.7%) | |
| Asian | 8 (4.3%) | 5 (1.9%) | |
| Native Hawaiian/other Pacific Islander | 0 (0.0%) | 1 (0.4%) | |
| Multiracial | 4 (2.1%) | 3 (1.1%) | |
| Donor cause of death, n (%) | 0.011a | ||
| Anoxia | 45 (24.1%) | 78 (29.3%) | |
| CVA/Stroke | 75 (40.1%) | 70 (26.3%) | |
| Head trauma | 62 (33.2%) | 114 (42.9%) | |
| Other | 5 (2.7%) | 4 (1.5%) | |
| Total cold ischemia time (h) | 0.368b | ||
| N (Missing) | 185 (2) | 265 (1) | |
| Mean (SD) | 6.6 (2.9) | 6.8 (3.6) | |
| Median (IQR) | 6.2 (5.1, 7.5) | 6.3 (5.0, 8.0) | |
| Range | 1.6, 35.0 | 1.3, 48.0 | |
| Calculated donor height | 0.346b | ||
| N (Missing) | 187 (0) | 266 (0) | |
| Mean (SD) | 171.1 (9.9) | 171.8 (10.7) | |
| Median (IQR) | 172.7 (165.0, 177.8) | 172.7 (165.0, 180.0) | |
| Range | 127.0, 195.6 | 117.0, 198.0 | |
| Share type, n (%) | <.001a | ||
| Local | 143 (76.5%) | 107 (40.2%) | |
| Regional | 40 (21.4%) | 154 (57.9%) | |
| National | 4 (2.1%) | 5 (1.9%) | |
| Creatinine | 0.748b | ||
| N (Missing) | 187 (0) | 266 (0) | |
| Mean (SD) | 1.4 (1.3) | 1.4 (1.4) | |
| Median (IQR) | 1.0 (0.8, 1.5) | 1.0 (0.8, 1.5) | |
| Range | 0.3, 9.3 | 0.1, 14.5 | |
| Bilirubin | 0.429b | ||
| N (Missing) | 187 (0) | 266 (0) | |
| Mean (SD) | 0.8 (0.6) | 0.9 (0.7) | |
| Median (IQR) | 0.7 (0.5, 1.1) | 0.7 (0.5, 1.0) | |
| Range | 0.1, 4.8 | 0.1, 5.8 | |
| AST | 0.178b | ||
| N (Missing) | 187 (0) | 266 (0) | |
| Mean (SD) | 54.4 (49.6) | 76.2 (124.4) | |
| Median (IQR) | 37.0 (24.0, 65.0) | 43.0 (25.0, 72.0) | |
| Range | 9.0, 292.0 | 8.0, 1258.0 | |
| ALT | 0.400b | ||
| N (Missing) | 187 (0) | 266 (0) | |
| Mean (SD) | 55.2 (74.2) | 61.6 (85.3) | |
| Median (IQR) | 32.0 (20.0, 60.0) | 35.0 (20.0, 67.0) | |
| Range | 9.0, 695.0 | 5.0, 661.0 | |
| Donor risk index | 0.819b | ||
| N (Missing) | 185 (2) | 265 (1) | |
| Mean (SD) | 1.7 (0.3) | 1.7 (0.3) | |
| Median (IQR) | 1.6 (1.5, 1.9) | 1.6 (1.5, 1.9) | |
| Range | 1.1, 2.6 | 1.2, 3.0 | |
| Donor risk index without regional share | 0.066b | ||
| N (Missing) | 185 (2) | 265 (1) | |
| Mean (SD) | 1.6 (0.3) | 1.6 (0.3) | |
| Median (IQR) | 1.6 (1.4, 1.9) | 1.5 (1.4, 1.8) | |
| Range | 1.1, 2.6 | 1.1, 3.0 | |
ALT: alanine transaminase; AST: aspartate aminotransferase; DBD: donation after brainstem death; DCD: donation after cardiac death; IQR: interquartile range; LT: liver transplant; SD: standard deviation.
In terms of waitlist outcomes, fewer patients died while on the waitlist, 76 (20.8%) patients in Era 1 and 84 (18.6%) in Era 2 (supplementary Table 1). Also noted, was a decrease in the percentage of candidates whose condition deteriorated (too sick to transplant) while on the waitlist (Era 1 22.7% vs Era 2 19.7%).
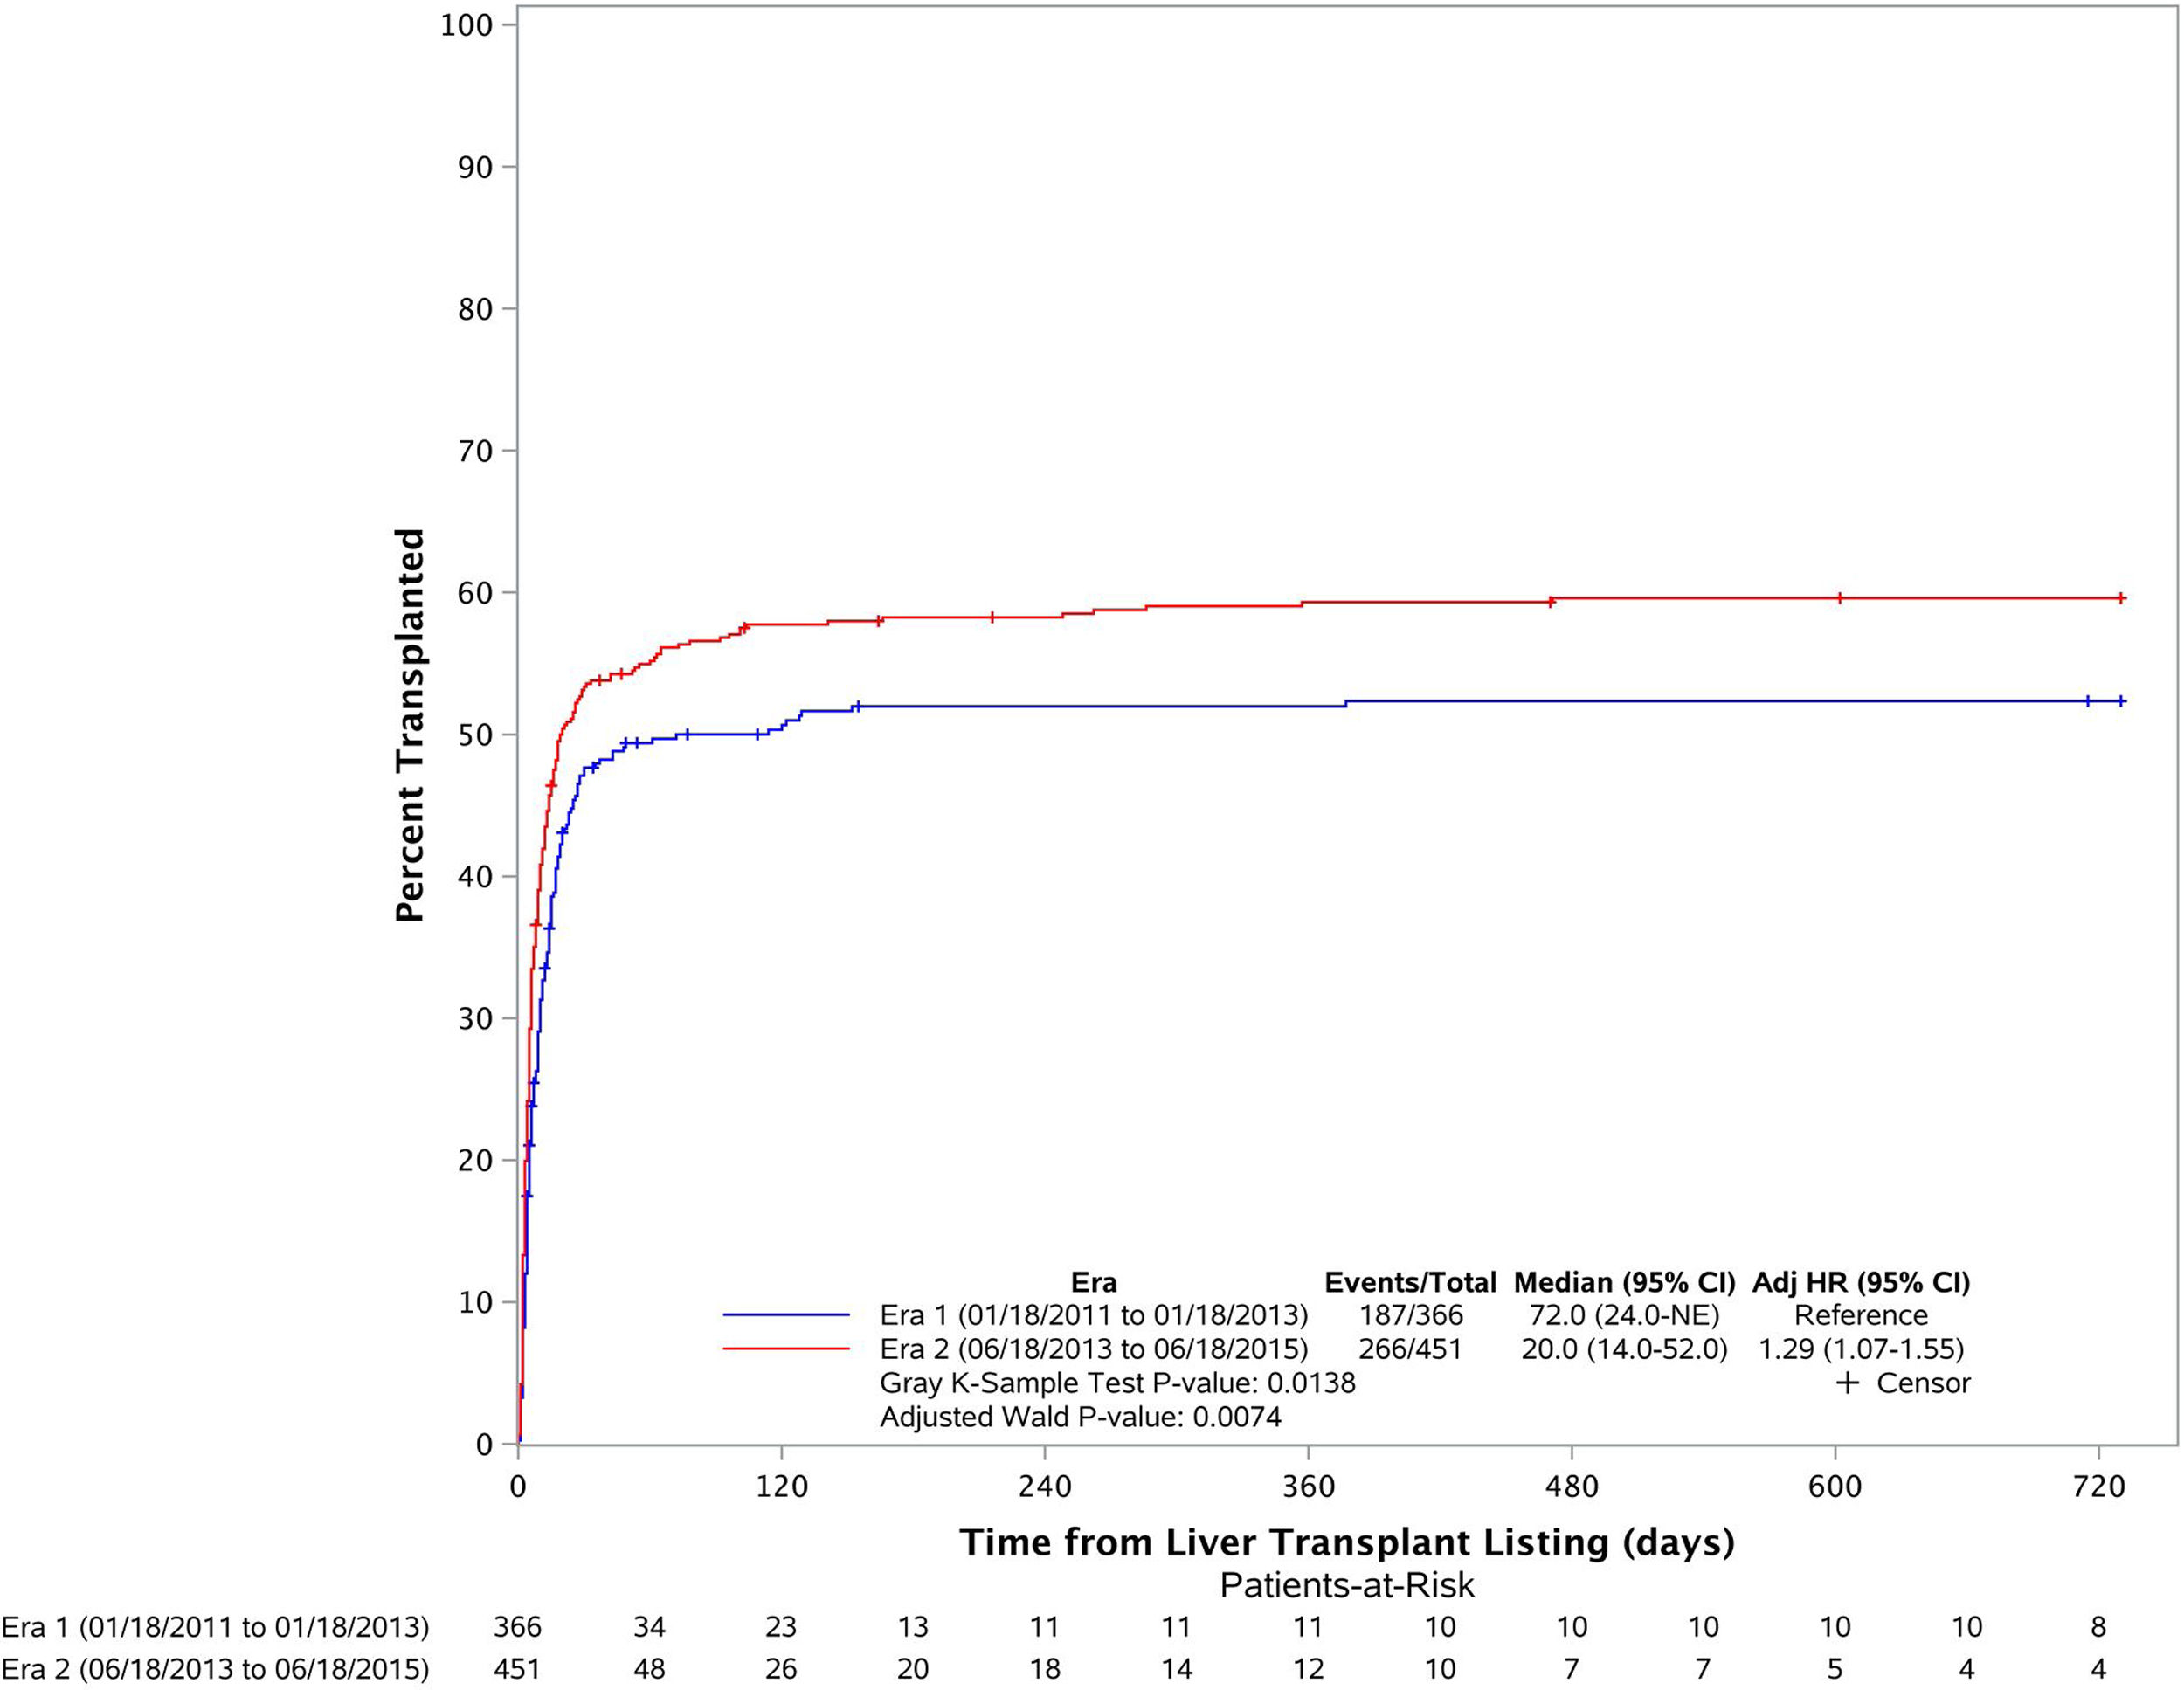
3.2Liver transplant cumulative incidence in both erasFig. 2 depicts the cumulative incidence of LT in the two eras. Cumulative incidence of LT after listing was significantly higher in Era 2 (1 month LT CI is 47.7% in Era 1 and 53.4% in Era 2). Median time to LT in Era 1 was estimated as 72 days while it was estimated as 20 days in Era 2 (p=0.014). The multivariate model showed that patients were more likely to get liver transplantation in Era 2 (adjusted HR: 1.29 (1.07–1.55), p=0.0074) compared to that in Era 1.
3.3Liver transplant cumulative incidence in both eras based on disease severity (number of organ failures)![Liver transplant cumulative incidence in both eras. Era 1 in blue and Era 2 in red (1 month LT CI is 47.7% in Era 1 and 53.4% in Era 2) [adjusted HR: 1.29 (1.07–1.55), p=0.0014)].](https://static.elsevier.es/multimedia/16652681/000000230000000C/v3_202212060650/S1665268120302131/v3_202212060650/en/main.assets/gr2.jpeg?xkr=ue/ImdikoIMrsJoerZ+w997EogCnBdOOD93cPFbanNeKOJqKH5+Za6P+RA5Vq9DljZ4NLWV9DdKZKKWmK9JJhXMtuwUeRqAVfHokaEbXsBQ9s0a+yXET/O+sy6I3bi3Ir9gGWTyZOLaUvE5+FpNT5ErjA66RF8odhj+msp+f4errFA8c27pgU7olOpiREiYx0M6wGIZnKOUc2WZHDTseToClhtHiUaW6aO3Yq0UZ6rR1qQ4EoIgOoJHR9sv65h4a5qDnTsPnl7wH2B59g9XyWa5fziV7XjcyFAlnPxn51nE= "Liver transplant cumulative incidence in both eras. Era 1 in blue and Era 2 in red (1 month LT CI is 47.7% in Era 1 and 53.4% in Era 2) [adjusted HR: 1.29 (1.07–1.55), p=0.0014)].")
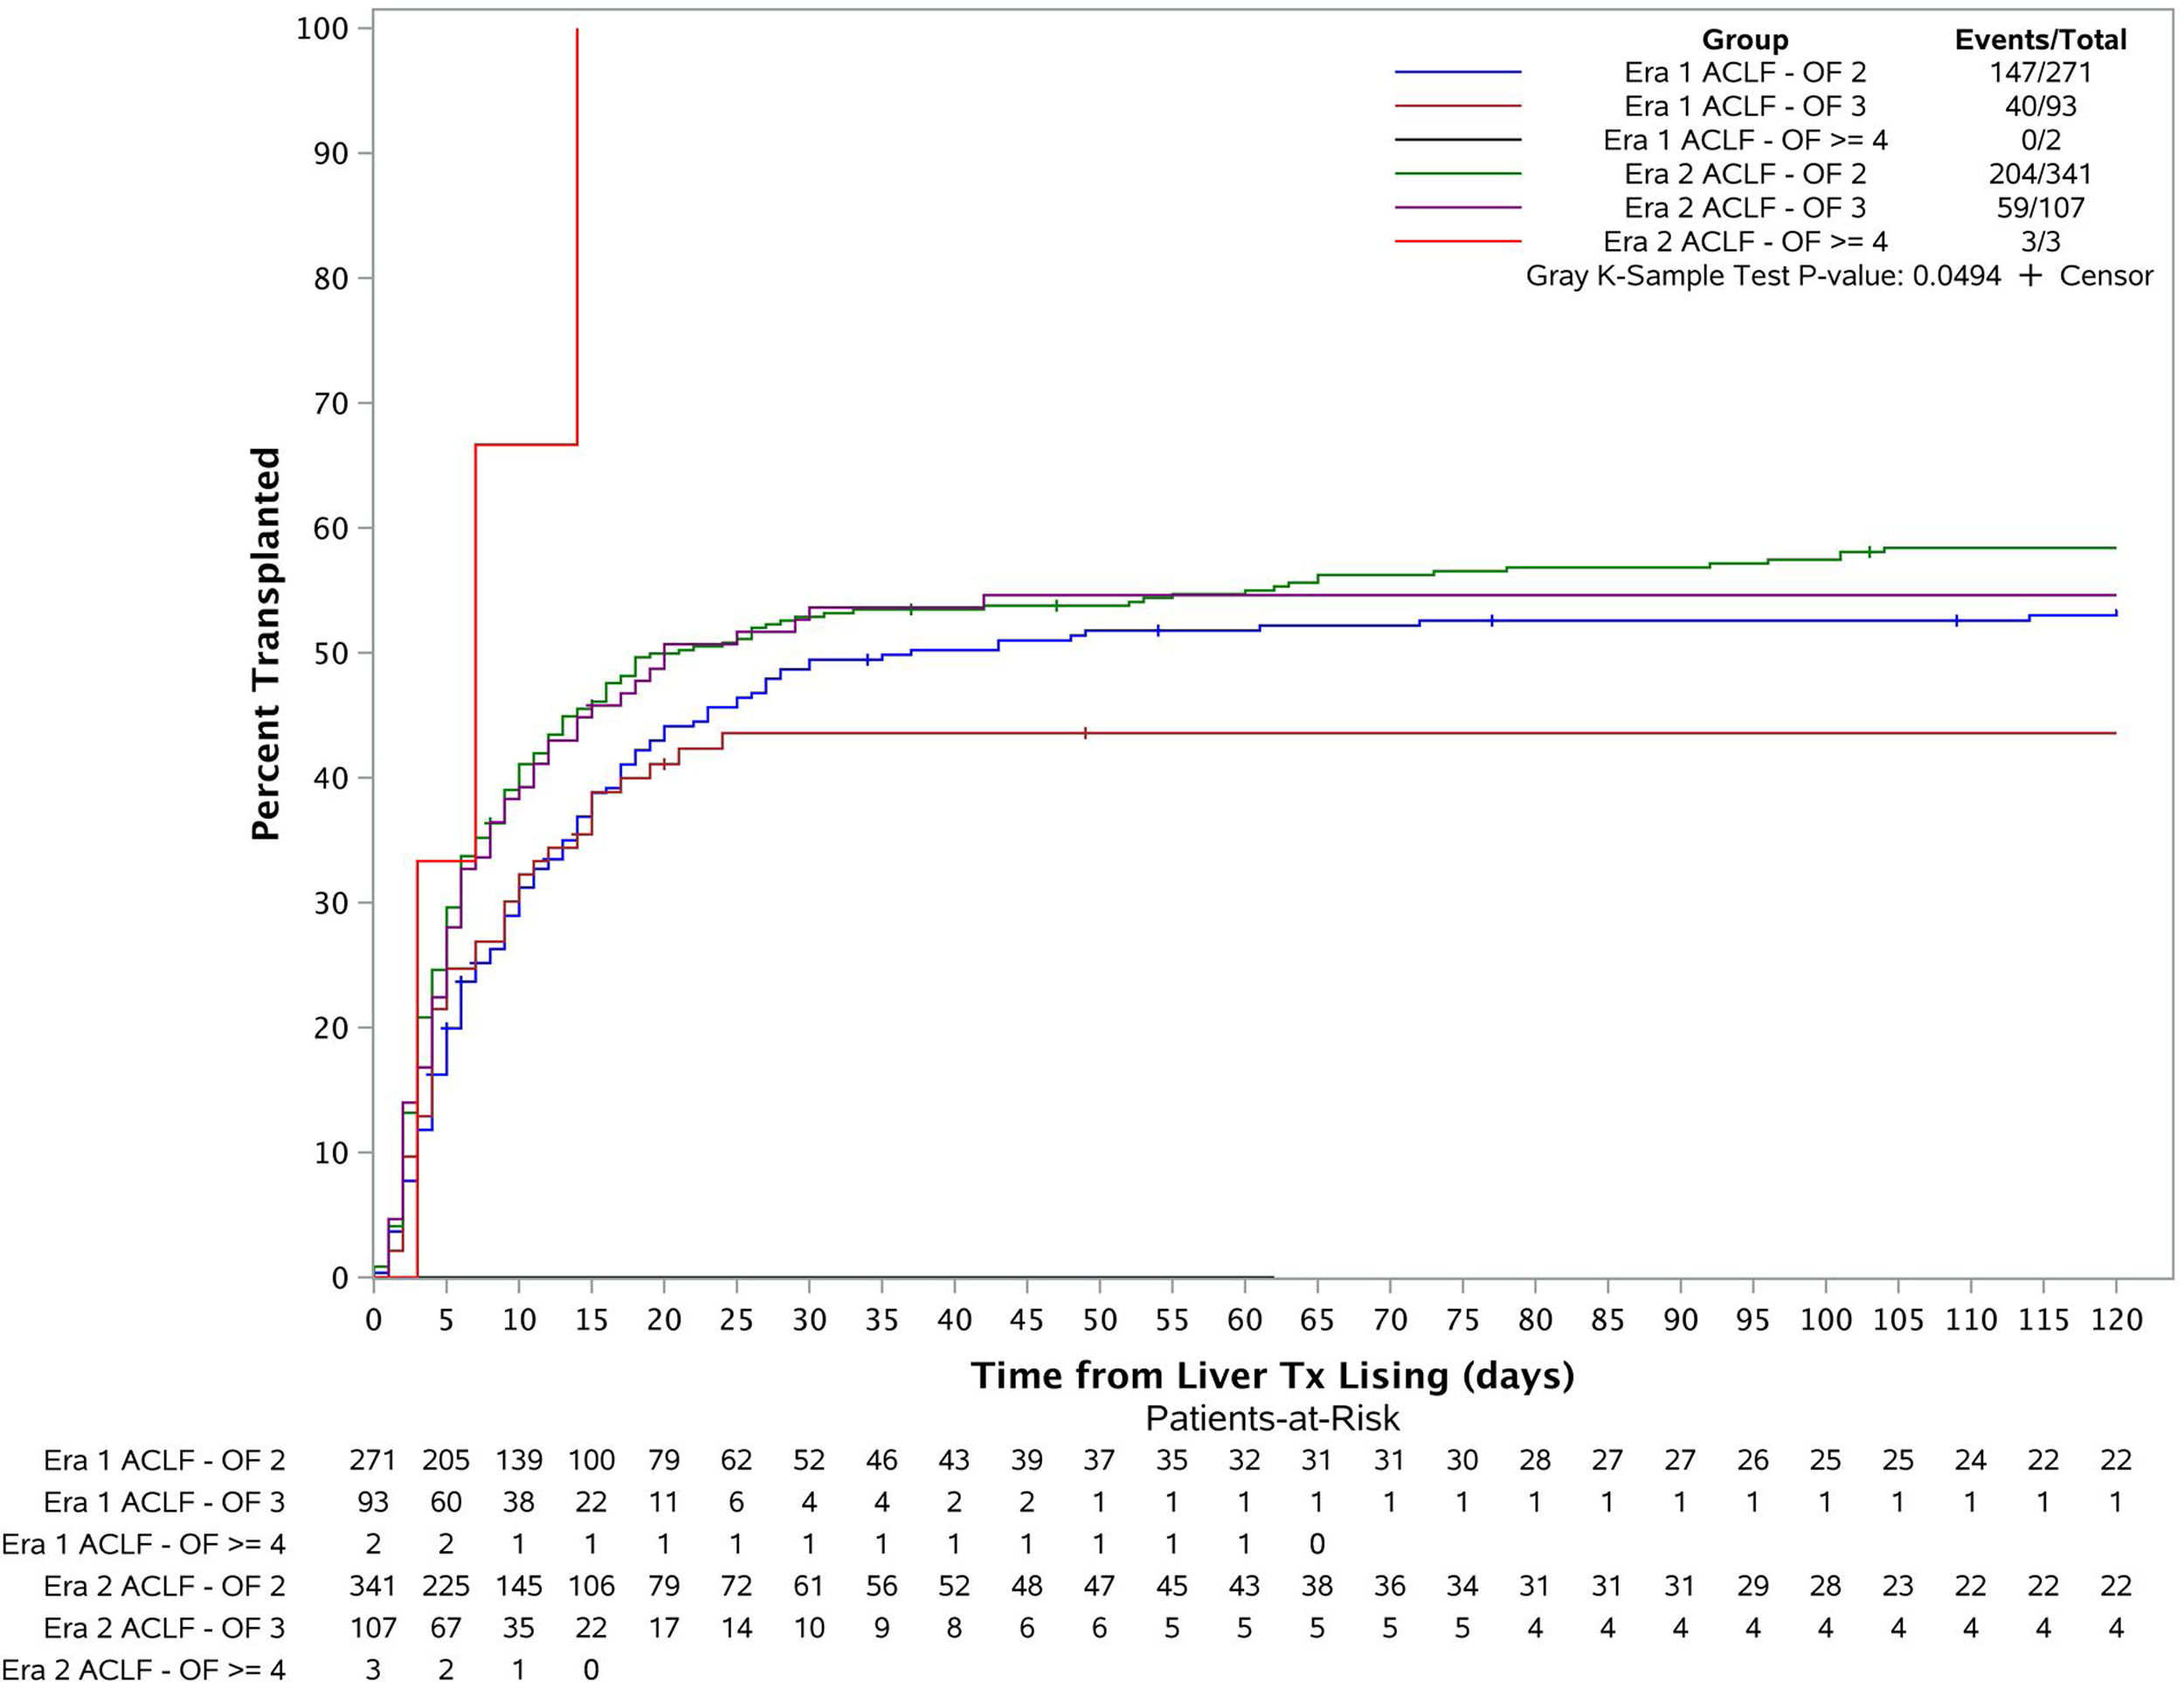
The patients were categorized into 6 groups based on their transplant era and ACLF severity (Fig. 3). Cumulative incidence of LT at 1 month, 2 months, 3 months and 6 months for each group were estimated using Fine and Gray's method. The overall cumulative incidences were also compared across the 6 groups using Gray's k-sample test. The p-value is 0.05 which demonstrates there is a significant difference for the liver transplant cumulative incidences among the groups. Further considering the cumulative incidence plot, we see that the cumulative incidence curves for Era 1 ACLF-OF 2, Era 2 ACLF-OF 2 and Era 2 ACLF-OF 3 were all similar. However, when comparing the ACLF-OF ≥4 groups we note that in Era 1, there were 2 patients in this group and none of them were transplanted. In fact, both of them died. In contrast, in Era 2, all 3 patients listed were transplanted.
3.4Outcomes after wait-list registration and one-year post-transplant survival, p=0.05.")
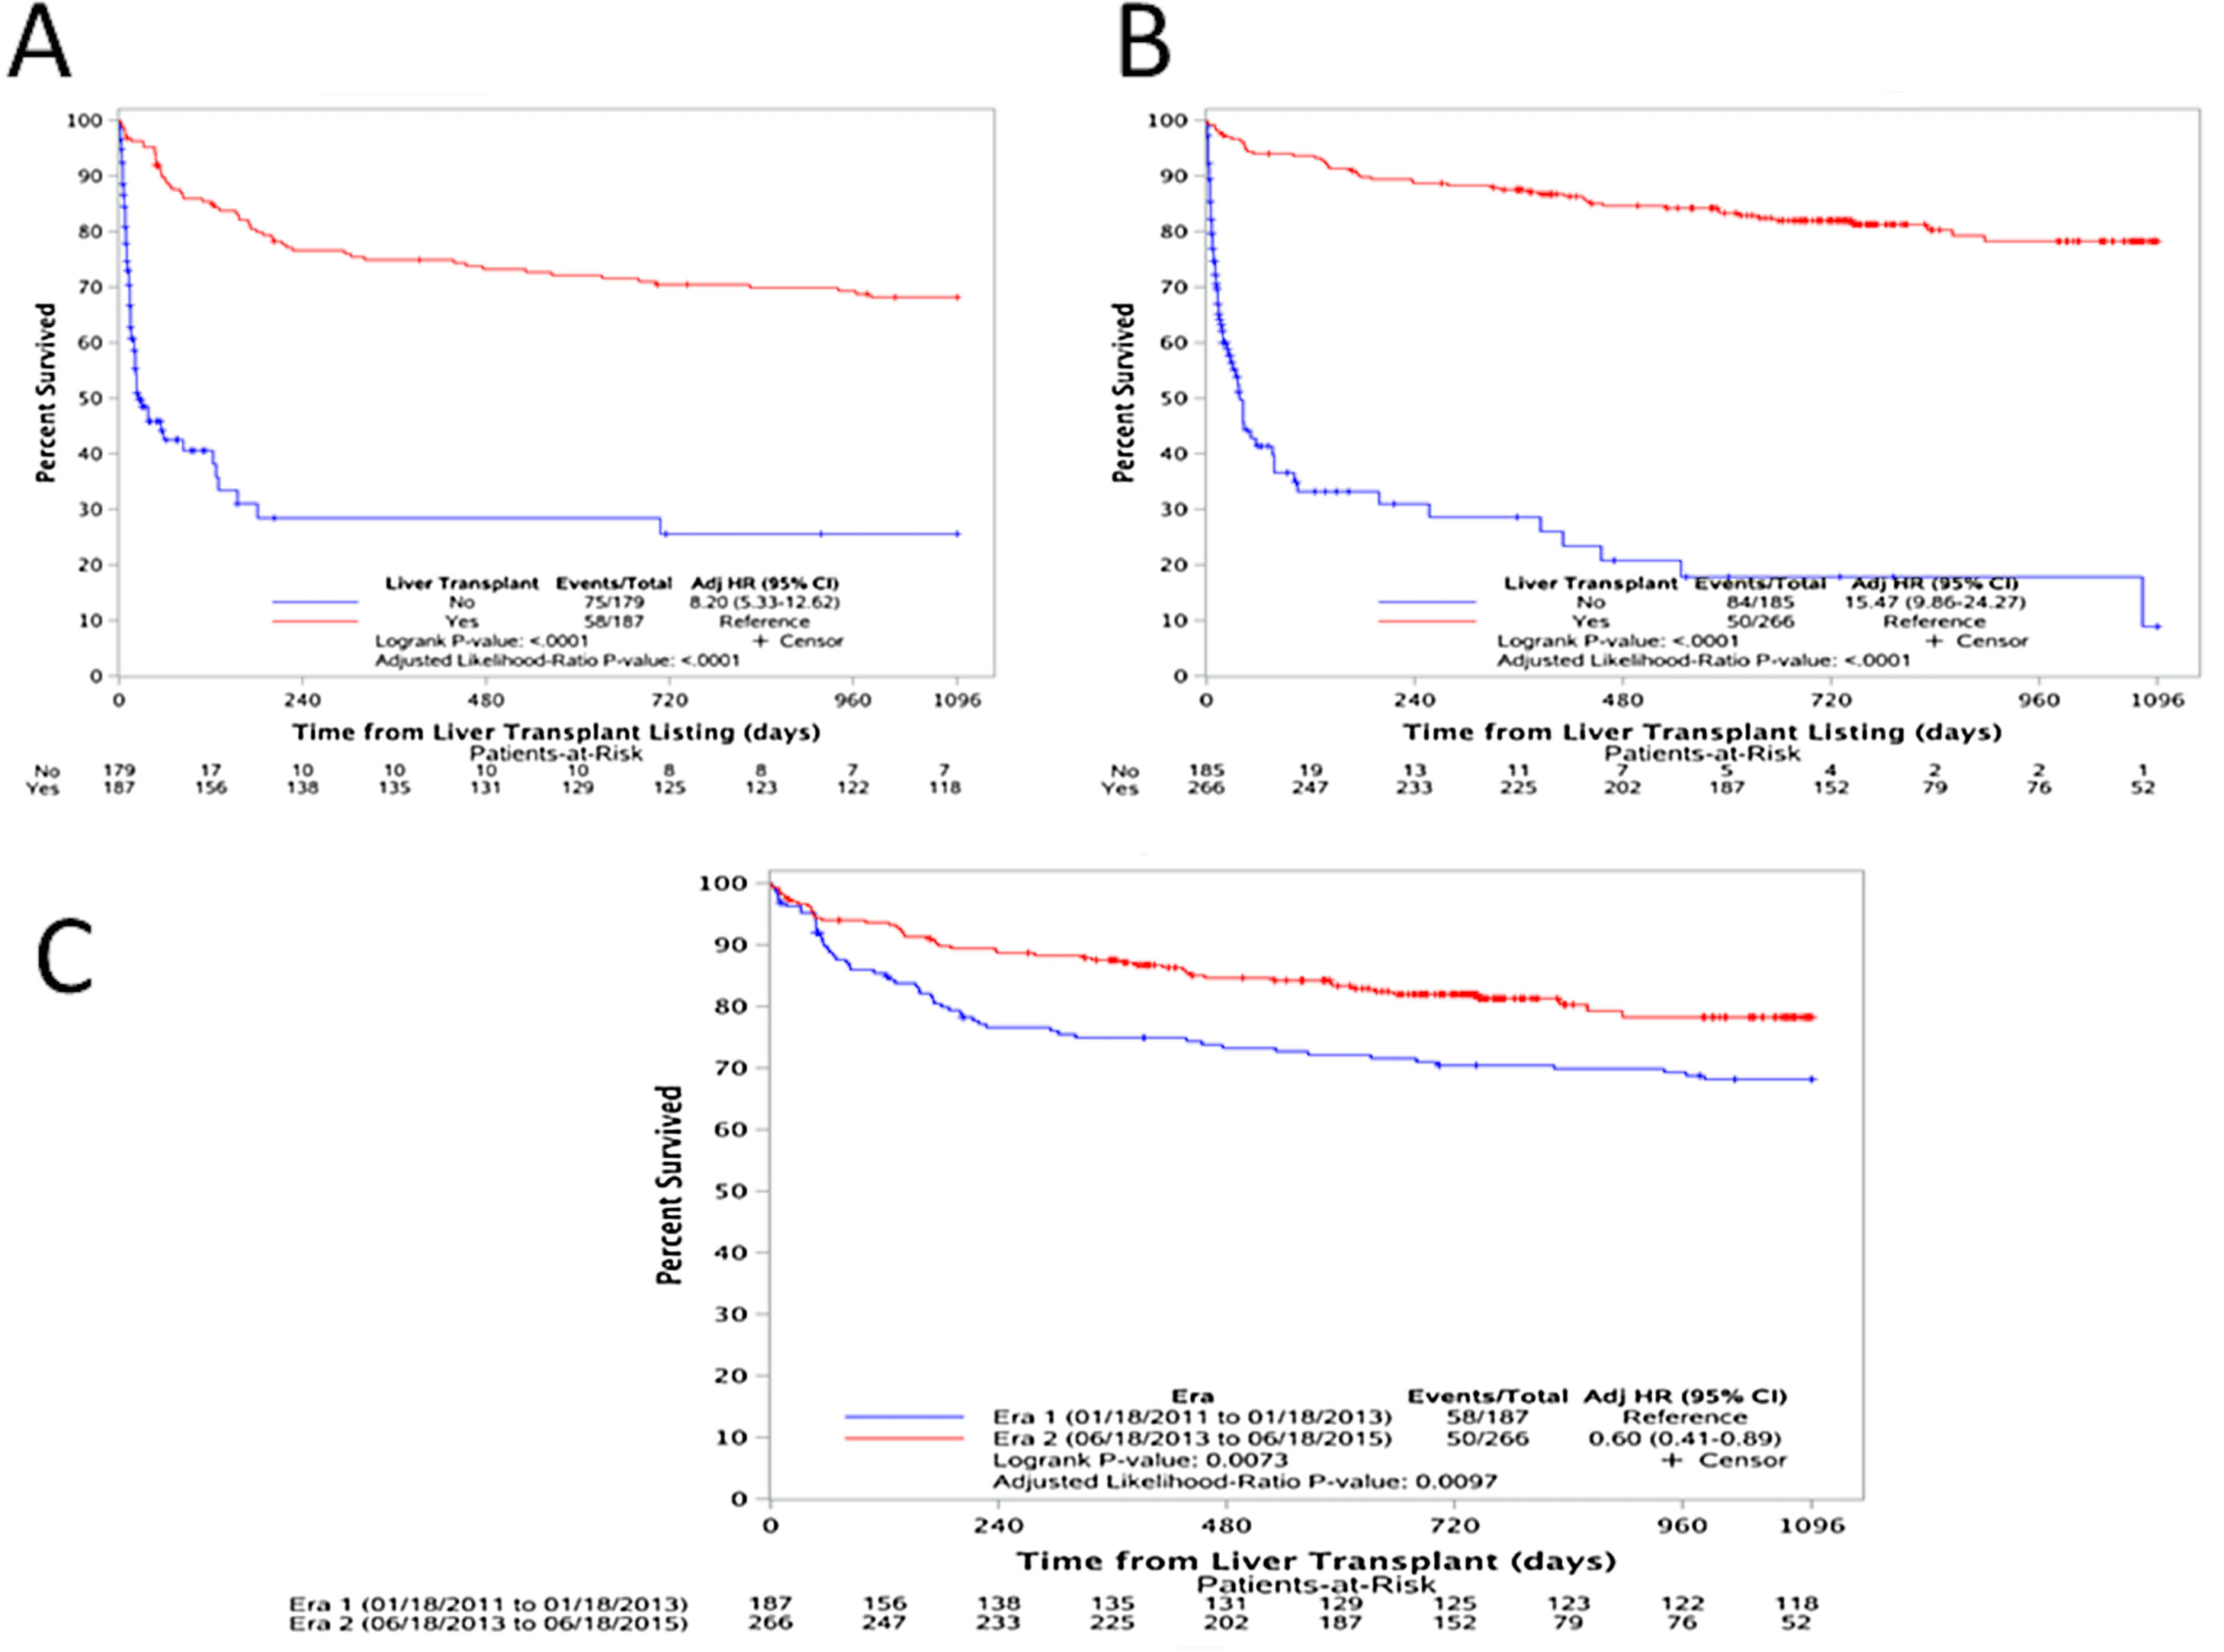
In both eras, transplanted patients had a significantly higher survival than those who were not transplanted [(Era 1: adjusted HR: 8.20, p<0.0001), (Era 2: adjusted HR: 15.47, p<0.0001)] as shown in Fig. 4A and B. And, upon comparing the one-year post transplant survival of those transplanted with ACLF during both Eras, there is a clear improvement in survival [adjusted HR: 0.60 (0.41–0.89), p=0.0073)] (Fig. 4C).
![(A) Survival analysis for patients in Era 1; comparing those transplanted (red) versus those not-transplanted (blue) [adjusted HR: 8.20, p<0.0001), (B) survival analysis for patients in Era 2; comparing those transplanted (red) versus those not-transplanted (blue) [adjusted HR: 15.47, p<0.0001)], and (C) one-year post transplant survival comparing the two Eras. Era 1 in blue and Era 2 in red [adjusted HR: 0.60 (0.41–0.89), p=0.0073)].](https://static.elsevier.es/multimedia/16652681/000000230000000C/v3_202212060650/S1665268120302131/v3_202212060650/en/main.assets/gr4.jpeg?xkr=ue/ImdikoIMrsJoerZ+w997EogCnBdOOD93cPFbanNeKOJqKH5+Za6P+RA5Vq9DljZ4NLWV9DdKZKKWmK9JJhXMtuwUeRqAVfHokaEbXsBQ9s0a+yXET/O+sy6I3bi3Ir9gGWTyZOLaUvE5+FpNT5ErjA66RF8odhj+msp+f4errFA8c27pgU7olOpiREiYx0M6wGIZnKOUc2WZHDTseToClhtHiUaW6aO3Yq0UZ6rR1qQ4EoIgOoJHR9sv65h4a5qDnTsPnl7wH2B59g9XyWa5fziV7XjcyFAlnPxn51nE= "(A) Survival analysis for patients in Era 1; comparing those transplanted (red) versus those not-transplanted (blue) [adjusted HR: 8.20, p<0.0001), (B) survival analysis for patients in Era 2; comparing those transplanted (red) versus those not-transplanted (blue) [adjusted HR: 15.47, p<0.0001)], and (C) one-year post transplant survival comparing the two Eras. Era 1 in blue and Era 2 in red [adjusted HR: 0.60 (0.41–0.89), p=0.0073)].")
(A) Survival analysis for patients in Era 1; comparing those transplanted (red) versus those not-transplanted (blue) [adjusted HR: 8.20, p<0.0001), (B) survival analysis for patients in Era 2; comparing those transplanted (red) versus those not-transplanted (blue) [adjusted HR: 15.47, p<0.0001)], and (C) one-year post transplant survival comparing the two Eras. Era 1 in blue and Era 2 in red [adjusted HR: 0.60 (0.41–0.89), p=0.0073)].
Broader regional sharing via the S35 policy change was implemented to prioritize the sickest patients (i.e. MELD ≥35) on the transplant waitlist. This was done considering that cirrhotic patients with MELD ≥35 were shown to have comparable wait-list mortality and post-transplant survival to status 1A patients; and that there was increasing disparity in waitlist mortality rates in patients with increased MELD scores when compared with candidates who received MELD adjustments due to hepatocellular carcinoma (HCC) [11–14].
Fortunately, studies done to look at the policy's effect, such as ours, show that S35 achieved what it was intended to do. Edwards et al. demonstrated that S35 not only increased the overall number of deceased donor LT but, in fact the percentage of MELD ≥35 recipients also increased from 18.5% to 26.5% [15]. Wait-list mortality and post- transplant one-year survival (HR: 0.69, 95% CI 0.60-0.80) was also shown to improve in this group [16]. As for candidates with HCC MELD adjustments, the proportion of LTs performed did not change, nor did the wait-time. Given the relatively stable number of available liver grafts, this finding highlights that higher transplant rates for one group of patients inevitably results in less organ availability for another. Despite these findings, a higher rate of death/delisting for “too sick” for patients on the wait list for HCC in the post “S35” era (5.3% vs. 7.2% at 15 months) was observed and while this could reflect the variability in HCC biology with respect to rate of progression, the observation warrants attention [17].
Our study shows that implementation of S35 allowed listed patients with ACLF, a group that was not specifically addressed by the MELD allocation scheme, to get transplanted at a higher rate. However, there remains a call for fresh attention to LT prioritization criteria for these patients for two main reasons. First, their high short-term mortality, as high as 80% at 28 days without LT for ACLF-3 patients and second, dependence on MELD score for listing. In a recent study, Sundaram et al. have shown that ACLF-3 patients (as defined by the EASL-CLIF consortium) at the time of listing in fact have greater 14-day mortality than those listed as status 1A, independent of their MELD score [10]. These findings illustrate that the MELD score does not predict short term mortality equally between patients with decompensated cirrhosis and ACLF and highlights the importance of early transplant evaluation and consideration of transplant priority for this cohort. This is partly also because ACLF is hallmarked by infectious or sterile inflammation-factors not measured by the MELD score or by the data collected by UNOS for listing that may prevent effective activation of these patients in the waitlist. And so, despite the evidence that after implementation of S35 we see a greater rate of transplantation for ACLF patients, this group still faces significant limitations to receiving a LT.
Several factors still limit our ability to serve this important group of patients well. The lack of a unifying diagnostic definition for ACLF is of pivotal importance. There remain two large camps divided starkly on the defining parameters for ACLF; the western group where numbers of organs failing determines the grade of ACLF or the number of organ failures considered, and the eastern group where the need for jaundice and coagulopathy followed by ascites and hepatic encephalopathy is paramount. The etiologies seen in both camps differ with a preponderance of alcohol-related disease in the western definition and hepatitis B viral (HBV) disease in the eastern approach. We have chosen to use the NACSELD definition of ACLF because it lends itself very nicely to this retrospective review. Furthermore, it can easily be applied by clinicians to identify ACLF in patients with severe complications of liver disease [3,18–20]. Recognition of ACLF and urgency to consider LT as an option will lead to prompt assessment. Early action on these patients is of the essence as they progress rapidly and tend to have catastrophic outcomes despite intensive unit care.
The second important consideration around this definition is that not all ACLF patients are disadvantaged by MELD. In fact, renal and coagulation dysfunction may drive up MELD scores while some with significant organ dysfunction may remain static. This concern is highlighted by the findings of Sundaram et al., who have shown that patients with ACLF-3 continue to be at high risk of death from intra and extra hepatic organ failures even after initial stabilization of their condition and consequential improvement in their MELD score. The mortality of these very sick patients continues to rise, in contrast to what occurs with another very sick cohort- patients with acute liver failure meeting criteria for status 1A listing [10].
Lastly, survival probability after liver transplantation in patients with multi-organ failure is still not very well-established, which often leads to these patients dying or being delisted despite their MELD score and demonstrated benefit of LT. Recent studies, including ours, have attempted to address this [4,7,9]. Our study showed that one year post-transplant survival was higher post S35, although not significant. It bears to highlight that despite higher transplantation rates, mortality did not increase. Thuluvath et al., using the UNOS dataset, showed that in ACLF-3 patients (three or more organ failures) post LT one year post-transplant survival was as high as 84% with three organ failures to 81% with five–six organ failures. This is contrasted with a one year waitlist survival without LT of 23.5%, supporting LT as a viable therapeutic option [9].
Our study has several limitations inherent to a retrospective analysis of a large database. First, there is the potential of misclassification of organ failures and thus ACLF at listing and transplantation. This is particularly likely in patients with renal failure, who were missed or misclassified as chronic kidney disease because no documented decompensating event of ascites or hepatic encephalopathy is captured currently in the UNOS database. Because of the subjective nature of the grading of hepatic encephalopathy and our choice to use mechanical ventilation as a surrogate for respiratory failure, some cases of ACLF may have been inadvertently misclassified. However, given the relative objectivity in grade 3 and 4 of hepatic encephalopathy by the West-Haven criteria (Reuter et al. Liver Transplantation 2017 and of mechanical ventilation, dialysis and vasopressor use, there is low likelihood of misclassification) [21]. Second, our analysis lacks information regarding infection rates. Therefore, certain patients with ACLF precipitated by bacterial infection may not have been identified. In addition, infection is a cause of both waitlist and post-transplant mortality, which we were unable to account for. However, in pre-transplant studies, NACSELD-ACLF was able to predict survival regardless of infections. Third, we excluded patients with exception points even though ACLF is a heterogeneous condition and these patients could have been given exception points for concomitant HCC or other indications.
Organ allocation for LT has evolved and rules have been implemented to distribute organs based partially on distance from donor hospital – this may lead to more patients being transplanted, as in effect the MELD compensation may not exceed 29 points. It is imperative to recognize this small but very important subset of potential liver transplant recipients, who have a high mortality, high cost and for whom the futility rules are not yet clearly defined. Despite a MELD driven system (which does not directly measure ACLF), S35 increased the frequency of LT for ACLF patients without incurring a penalty for transplanting patients with multiple organ failures. This supports the broader push for standardizing measures for ACLF into the transplant priority for cirrhosis. Our data demonstrated better outcome trends and access with rapid listing and transplantation. Future data collection on this type of patient will help to establish solid, easy to use parameters for classification, prioritization and potentially futility rules to prevent misuse of valuable grafts.AbbreviationsACLF acute on chronic liver failure European Association for the Study of the Liver-Chronic Liver Failure Consortium hepatocellular carcinoma liver transplantation Model of End Stage Liver Disease North American Consortium for the Study of End-Stage Liver Disease's definition of acute-on-chronic liver failure organ failures Share 35 United Network for Organ Sharing
None declared.
Conflicts of interestThe authors have no conflicts of interest to declare.
The following are the supplementary data to this article:


