


Introduction and Objectives. Analysis of cancer biomarkers is an important tool in developing targeted-therapy and in modulating chemoresistance. Here, we analyze the relevance of CD90, a marker of cancer stem cells (CSC) in hepatocellular carcinoma (HCC) and its correlation with autophagy. Materials and Methods. For in vivo study, 86 specimens were collected from 43 patients undergoing liver resections. In each patient, HCC nodule (HCC) and surrounding non-tumor (SNT) were collected. For in vitro study, HCC cells JHH6 subpopulations expressing CD90+ and CD90- were isolated using magnetic-sorter and confirmed by flow-cytometry. Upon doxorubicin treatment, autophagy turn-over was analyzed by RTqPCR for mRNA expression, Western blot for protein expression, and autophagosome staining for autophagy-flux. Cytotoxicity test was performed by MTT assay. Gene and protein analysis were performed in clinical samples together with immunohistostaining. Results. CD90 mRNA expression was higher in HCC than in SNT for 8-fold (p < 0.001). LC3-II protein was up-regulated in the HCC in comparison with the SNT (p < 0.05). In vitro model showed that CD90+ and CD90- cells had diverse expressions of autophagy-related genes. Upon doxorubicin treatment, autophagy was activated in both cells by increasing LC3-II protein expression, autophagic vacuoles, and dysregulation of autophagy-related mRNAs. A differential autophagic capacity was noticed between two subpopulations and it was correlated with cellular toxicity assay. Conclusions. We demonstrated the relevance of differential autophagy capacity of CD90+ cells in HCC. Autophagy was involved in cancer-defense mechanism against doxorubicin. Cancer promoting function of autophagy in CD90+ cells was also related to cancer environment.
Recent epidemiology data Globocan 2018 predicted that liver cancer, mainly dominated by hepatocellular carcinoma (HCC), to be the sixth most commonly diagnosed cancer and the fourth leading cause of cancer-related mortality worldwide. In the male population, its incidence and mortality are 2 to 3 times higher compared to female, thus it ranks fifth in terms of global cases and second in terms of deaths [1]. Poor clinical outcome of HCC patients is attributed to the late diagnosis, the resistance of HCC cells to currently available therapies, and tumor recurrence after curative therapies [2].
Hepatic cancer stem cells (CSC) are widely accepted as a major origin of HCC [3,4]. These cells populations are known for their resistance to radio- and chemotherapies, leading to therapy failure and metastasis [5,6]. Various protein markers had been proposed for the detection and the classification of hepatic CSC [7]. The CD90 (Thy-1) is one of the most common hepatic CSC used in multiple in vitro and in vivo studies [8–10]. It is a 25-37 kDa glycophosphatidylinositol (GPI)-anchored protein expressed in various cells. Besides T cell activation, CD90 has numerous non-immunologic biological processes, as an important regulator of the cell to cell and cell to matrix interaction, apoptosis, adhesion, migration, cancer, and fibrosis [11,12]. Based on a gene ontology analysis, the over-expressed genes in CD90+ cells from HCC were associated with inflammation, drug resistance, and lipid metabolism compared to CD90+ from nontumoral liver [13].
Autophagy, a self-digestion mechanism for the elimination of cytoplasmic materials, cellular components (lipid, proteins), and organelles, is one of the key factors for cell homeostasis in normal physiology. It involves the formation of double-membrane vesicles (autophagosomes) engulfing the cargos to the lysosomes. The outer membrane of the autophagosome then fuses with the lysosomal membrane, and the inner vesicle, together with its cargo, is degraded [14].
In cancer, autophagy is acknowledged as a double-edged sword as it functions both as cancer-suppressor and cancer promoter [15]. Cancer suppressive function of autophagy is widely characterized to be involved in prevention of cells inflammation [16], while the cancer-promoting factors are related to hypoxia [17–20] and extensive reactive oxygen species [21–25]. However, in HCC, this dual role of autophagy is even more complicated, being attributed by the complexity of cellular heterogeneity, various etiologies, and multiple factors (lifestyle, treatment choice, gender, etc.) during long-term disease development.
As recently reviewed, dysregulation of autophagy is known in CSC populations of several cancers [15]. As for HCC, however, information on autophagy preference to hepatic CSC is still unclear and is mainly limited to the CD133+ phenotype. Autophagy was involved in the maintenance of CD133 + CSC under the oxygen- and nutrient-deprived conditions that are typical of the HCC microenvironment [26,27]. Autophagy was also activated in CD133+ cells upon an insufficient radiofrequency ablation [28] and immunotherapy using interferon-gamma [29]. Recently, an interesting lineage-tracing study in transgenic rat liver cirrhosis showed that hepatic CSC Axin2/EGFP + CD90+ cells were generated exclusively in cirrhotic livers with aberrant autophagy and promoted hepatocarcinogenesis [30].
However, until now, there is limited information on the relevance of autophagy in CD90 HCC cellular subpopulations. Here, we provide new evidence of autophagy preference in CD90+ cells, both in in vitro and clinical HCC tissues, including its activation after chemotherapy. This finding reveals new prospects on the development of future strategies to manage HCC.
2Materials and Methods2.1Samples2.1.1Human tissue samplesEighty-six specimens were collected from 43 selected HCC patients undergoing liver resections in the University Medical Center Ho Chi Minh City, Vietnam between 2014 and 2017. From each patient, HCC nodule (HCC) and the most distant tissue of the resected HCC (surrounding non-tumoral; SNT) were collected. Fresh tissues were kept in RNAlater Stabilization Solution (Invitrogen, Thermo Fisher Scientific, Waltham, MA, USA) and stored in −80 °C before further processing. The diagnosis of patients was established on international criteria together with its Edmondson Steiner (ES) HCC grading, tumor parameters, laboratory results, and other clinical findings. Informed consent to participate in the study was obtained from each patient or by a legal representative and the protocol was approved by the ethical committee of the UMP Ho Chi Minh City no. 240/DHYD-HDDD.
2.1.2Cell lineHuman HCC cell line JHH6 was used as in vitro model. JHH6 subpopulations expressing CSC marker CD90+ and its negative counterpart CD90- were isolated by using MACS magnetic cell sorting (Miltenyi Biotec GmbH, Bergisch Gladbach, Germany) according to manufacturer’s instruction. The purity and the percentage of CD90+ cells were validated by flow cytometry (FACSCalibur, BD Biosciences, NJ, USA). Details on cell separation and subpopulations’ characteristics were reported previously [31]. Cells were grown in Williams’ E medium supplemented with 10% (v/v) FBS, 1% L-glutamine and 1% antibiotics. They were maintained at 37 °C in a humidified 5% CO2 incubator and were routinely expanded by 0.05% trypsin detachment.
2.2Histological analysisImmediately after surgery, liver tissues were fixed in formalin and included in a paraffin block. The fixed slices were subjected to hematoxylin & eosin and immunostaining. Two independent pathologists (UMC HCM City and ASUGI) performed histological analysis and final diagnosis.
2.3ImmunostainingImmunohistochemistry (IHC) analysis was performed on the paraffinated tissues section used for histological analysis. Paired HCC and SNT tissues were subjected to immunostaining for LC3 protein. Briefly, hepatic slices were de-paraffinized with xylene and rehydrated with a gradual concentration of ethanol. Tissues were incubated with antibody against LC3 (PA1-16930, Thermo Scientific, Rockford, IL, USA) followed by incubation with primary universal antibody enhancer and HRP polymer (Thermo Fisher Scientific, Cheshire, UK). The complex was visualized with the DBA peroxidase substrate kit (Vector Laboratories, UK) and the nucleus was stained with hematoxylin. IHC images were generated by microscopical systems Leica DM2000 (Leica, Wetzlar, Germany).
2.4Treatment in vitroE64D (SC 201280, Santa Cruz Biotechnology, Dallas, Texas, USA), an inhibitor of lysosomal proteases, was dissolved in DMSO. JHH6 CD90+ and CD90- cells were plated with concentration of 30,000 cells/cm2 for 24 hours. Cells then were exposed for 24 hours to 5 μM doxorubicin (Pfizer) with and without the presence of 50 μM E64D. DMSO concentration was calculated to be 0.3% in each treatment. Cell viability was determined by 3(4,5-dimethyl thiazolyl-2)-2,5 diphenyltetrazolium (MTT, Sigma Aldrich, St Louis, MO, USA) assay. Total protein and RNA extracts were collected for protein and gene analysis, respectively. In parallel, MTT assay was also performed for autophagy inducer rapamycin and autophagy inhibitor chloroquine (Enzo Life Sciences, Farmingdale, NY, USA)
2.5Assessment of autophagy fluxAutophagy flux were analyzed by the quantification of LC3 protein turnover by Western blot and the fluorescence reading of accumulated autophagic vacuoles in lysosomally-inhibited live cells by fluorescence microplate assay. Cyto-ID Green autophagy detection kit (Enzo Life Sciences, Farmingdale, NY, USA) was used to detect acid autophagic vacuoles. Briefly, JHH6 CD90+ and CD90- cells were seeded in a 96-well dark fluorescence plate for 24 h. Cells then were exposed for 24 h to 5 μM doxorubicin with and without the presence of 50 μM E64D. 100 μM chloroquine, an autophagy flux inhibitor, was used as a positive control for the detection of autophagic vacuoles, based on the manufacturer’s suggestion. DMSO concentration was calculated to be 0.3% in each treatment. After treatment, cells were stained with Cyto-ID Green and Hoechst 33342 nuclear stain dyes for 30 minutes at 37 °C, followed by washing. The fluorescent signal was measured by a fluorescent microplate reader (Perkin Elmer, EnSpire Multimode Plate Reader, Hamburg, Germany). Simultaneous detection was performed for the Cyto-ID Green and Hoechst 33342 on a FITC filter (Excitation ∼480 nm, Emission ∼530 nm) and blue DAPI filter (Excitation ∼340 nm, Emission ∼480 nm). The green autophagy signal was then normalized with the blue signal and the results expressed as relative to control cells.
2.6Protein isolation and quantification24 hours after treatment, total proteins from cells were collected using cell lysis buffer (Cell Signaling Technology, Danvers, MA, USA) and homogenized by scrapping and vortexing. The extract was centrifugated for 10 minutes at 14,000 xg in a refrigerated microfuge. At the end, supernatants were recovered and protein concentration was determined by the bicinchonic acid protein assay.
2.7Western Blot analysisLC3 protein analysis was performed by using Western blot (WB) on total protein extract obtained from human liver tissues and JHH6 CD90+ and CD90- fractions. Proteins (20 µg) were size-separated by SDS–PAGE on 12% polyacrylamide gel. Electro-transferred gel on PVDF membrane was immunoblotted with the LC3 antibody while actin (A2066, Sigma) was used as housekeeping protein. The peroxidase reaction was obtained by exposure of membrane in the ECL-Plus WB detection system solutions (ECL Plus Western Blotting Detection Reagents, GE Healthcare, Italy). Protein quantification was performed after the densitometric analysis of bands vs. actin in each sample (Image Studio™, LI-COR, Lincoln, Nebraska, USA).
2.8Reverse Transcription – quantitative Real-Time PCR (RT – qPCR)Reverse Transcription (RT) was performed to obtain cDNA from 1 µg of purified RNA with the High Capacity cDNA Reverse Transcription Kits (Applied Biosystem, USA) according to the manufacture’s protocol. Real-time PCR was performed according to the SYBR Green Supermix protocol (Bio-Rad Laboratories, Hercules, CA, USA). PCR amplification was carried out in 15 µL reaction volume containing 25 ng cDNA, 1x SYBR Green Supermix – composed by 100 nM KCl, 40 nM Tris-HCl, pH 8.4, 0.4 mM each dNTP, 40 U/mL iTaq DNA polymerase, 6 mM MgCl2, SYBR Green I, 20 mM fluorescein, and stabilizers (Bio-Rad), and 250 nM of gene-specific forward and reverse primers. The reaction was run in CFX 9600 real-time PCR system (Bio-Rad). The primer sequences are listed in Supplementary Data Table S1.
2.9Statistical analysisStudent’s t-test was performed for statistical comparison between groups using software GraphPad Prism version 8.0 (GraphPad Software, Inc., La Jolla, CA, USA). For human tissue samples, continuous variables of mRNA distribution by RT-qPCR were calculated using t-test following normality test and values were represented as mean (95% CI). Data in vitro were obtained from at least three independent experiments and are expressed as mean ± SD. Statistical significance was set to p-value < 0.05 and reported as indicated here: * p < 0.05, ** p < 0.01, and *** p < 0.001.
3Results3.1Baseline characteristics of HCC clinical samplesThe demographic features of the HCC patients are shown in Table 1. The participants were predominantly male (35 male vs 8 female) with a mean age of 58 ± 10 year old. The aetiology of chronic liver disease was 63% Hepatitis B virus (HBV), 14% Hepatitis C Virus (HCV), and 21% other causes (metabolic/alcohol).
Clinical and pathological characteristics of the HCC patients.
| Parameter | n | Parameter | n |
|---|---|---|---|
| n | 43 | ||
| Age (mean, 95%CI) | 58 (55-61) | Serum markers | |
| Sex (M / F) | 35 / 8 | ALT (U/ml) [mean (95%CI)] | 58 (32-84) |
| Etiology | AST (U/ml) [mean (95%CI)] | 74 (46-102) | |
| HBV | 28 | GGT (U/ml) [mean (95%CI)] | 95 (53-137) |
| HCV | 6 | Alpha fetoprotein | |
| Metabolic/Alcohol | 9 | <20 ng/mL | 14 |
| Disease scores | 20 - 400 ng/mL | 14 | |
| CTP A / B / C | 36 / 2 / nd | >400 ng/mL | 9 |
| Tumor parameters | |||
| Number (single / multiple) | 27 / 8 | ||
| Biggest lesion size | |||
| Diameter < 2 cm | 5 | ||
| Diameter > 2 and < 5 cm | 16 | ||
| Large | 17 | ||
| Vascular invasion (yes/no) | 6 / 37 | ||
| ES grade (ES1 / ES2 / ES3-4) | 15 /11 / 11 |
Regarding the HCC score, 36 (83%) was categorized into Child-Turcotte-Pugh (CTP) A, while only 5 (6%) patients were in CTP B, none of the patients received previous hepatectomy. For tumor mass and number of lesions, 63% of patients showed a single nodule tumor. Histological analysis showed that 40% were well-differentiated HCC ES grade 1, 29% were moderate-differentiated HCC ES grade 2, and the other 29% was poor-differentiated HCC ES grade 3-4. For serum biochemical analysis, the median (95% CI) of the alanine transaminase (ALT) and aspartate transaminase (AST) levels were 59 (32-84) and 74 (46-102) IU/mL, respectively. As for the alpha fetoprotein (AFP) level, 39% patients had AFP level lower than 20 ng/mL, 39% between 20 ng/mL and 400 ng/mL, and 24% with AFP level above 400 ng/mL.
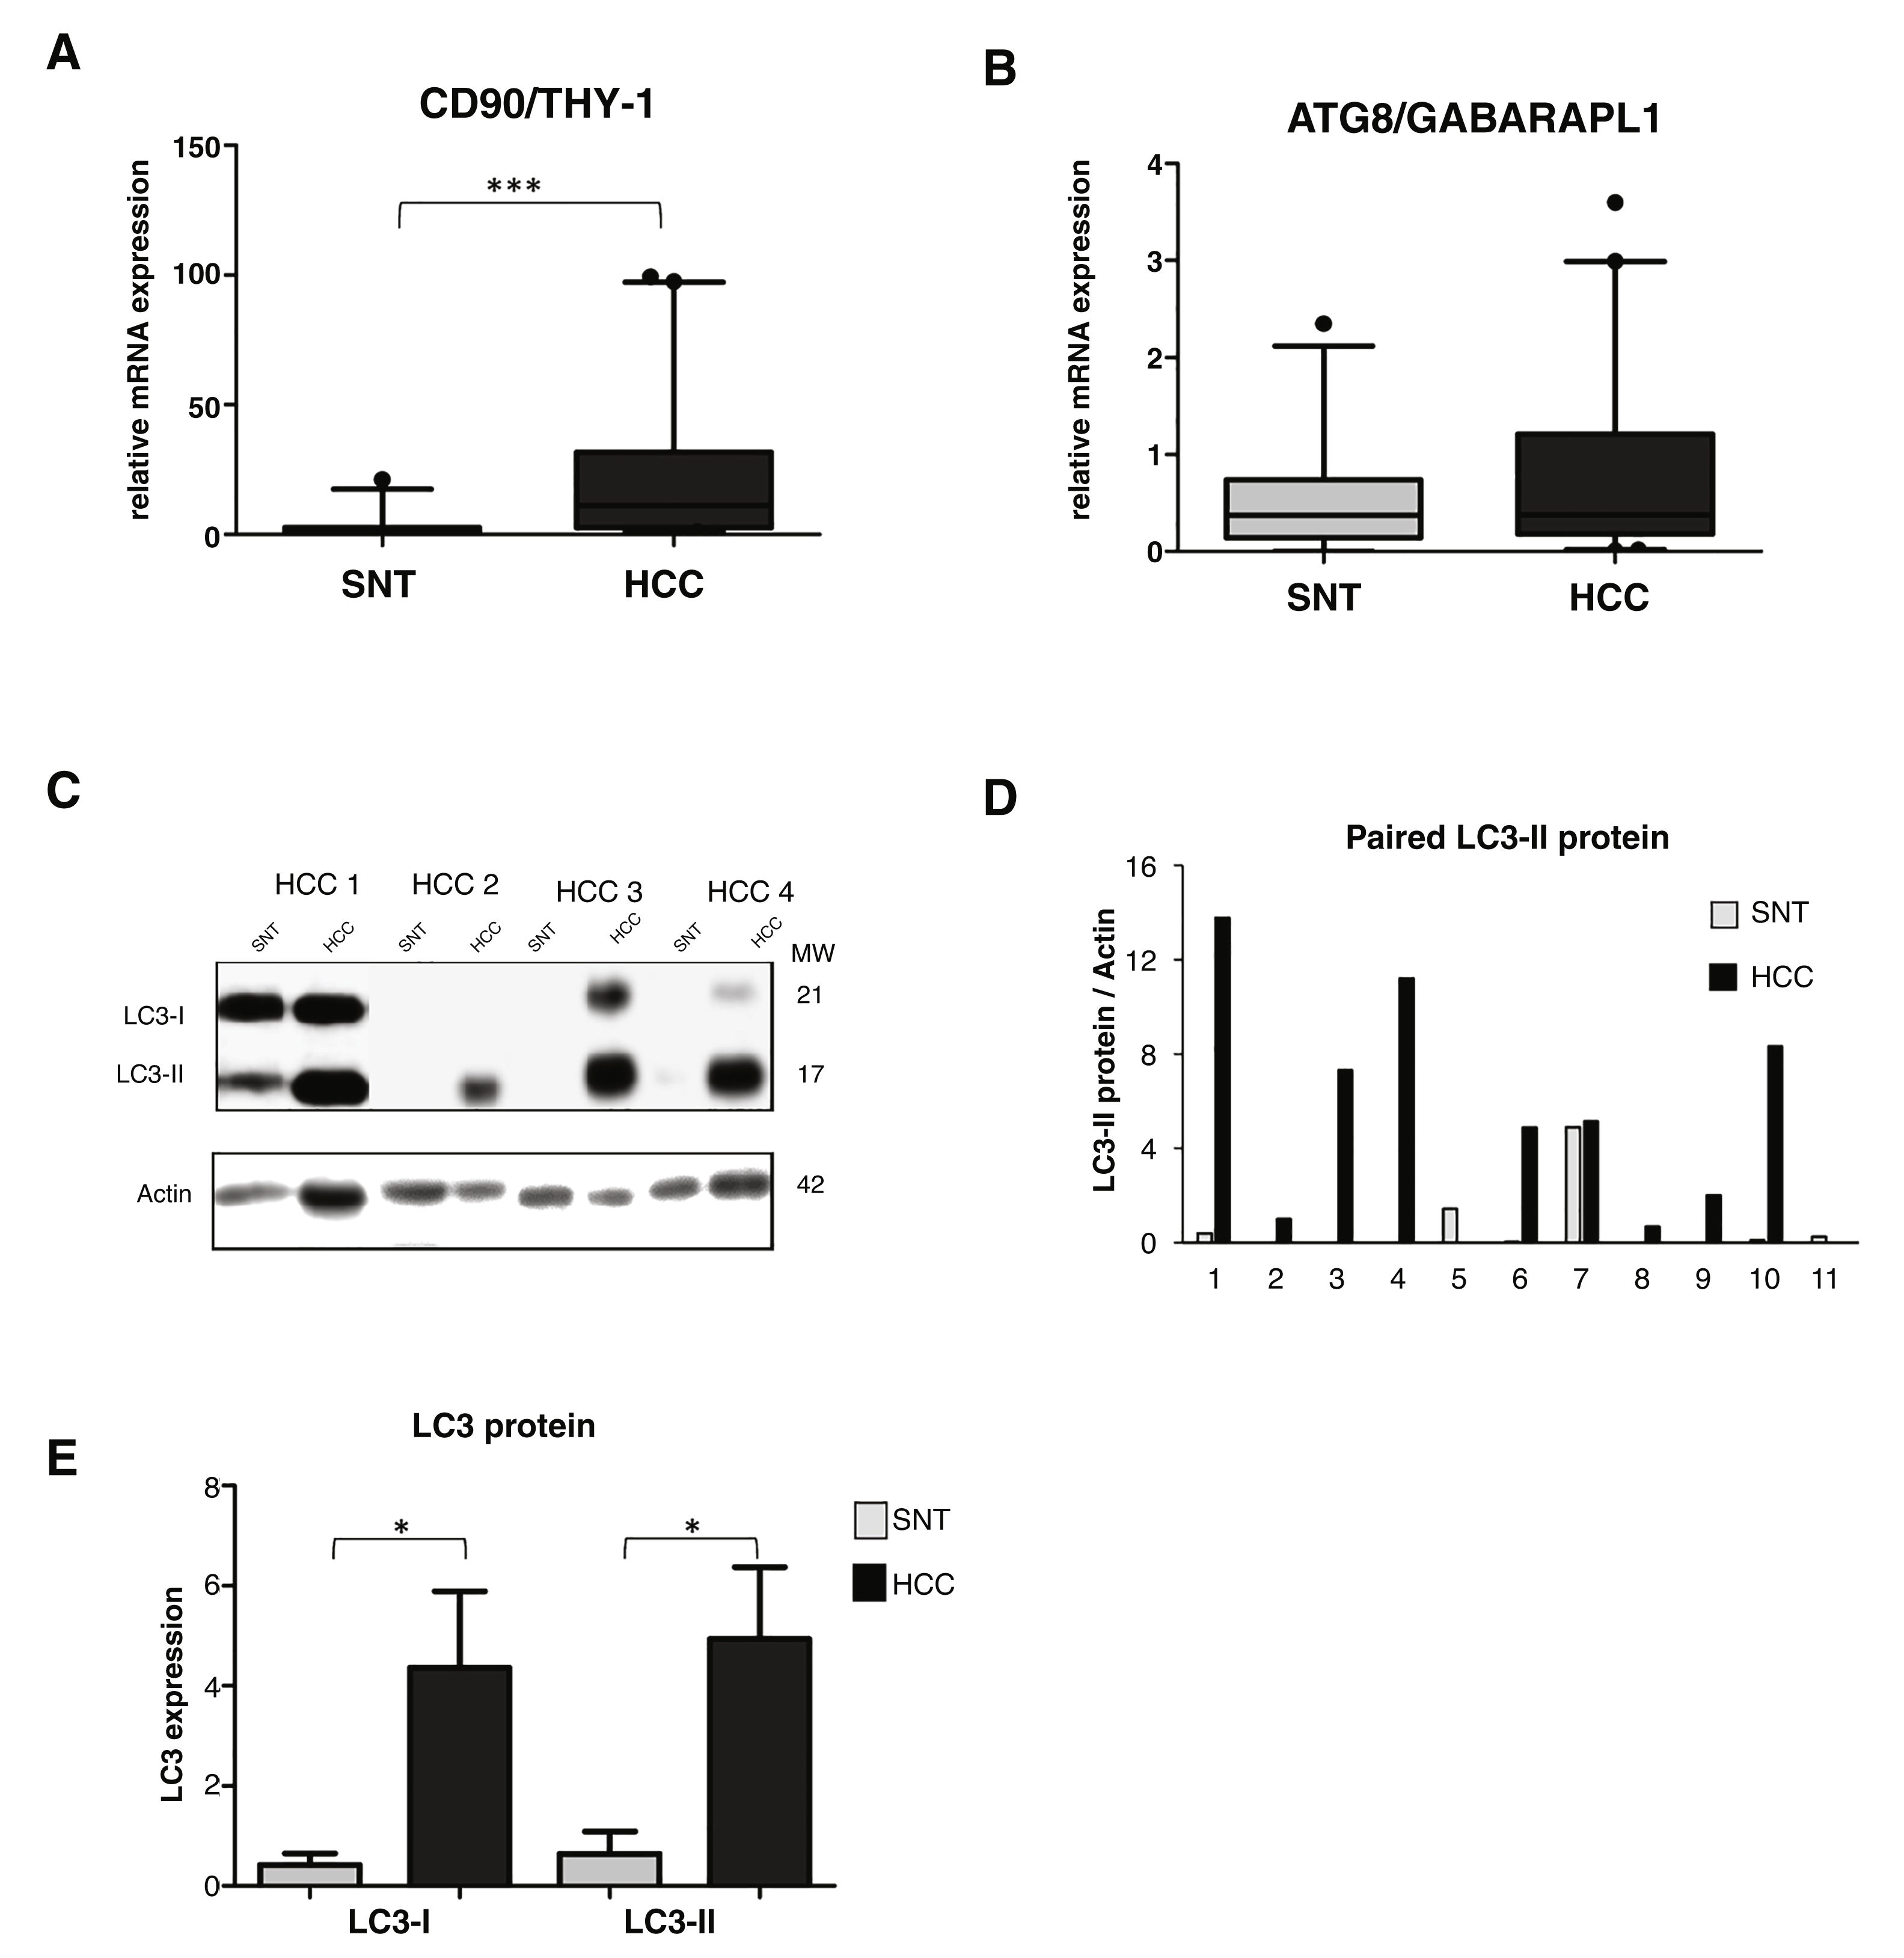
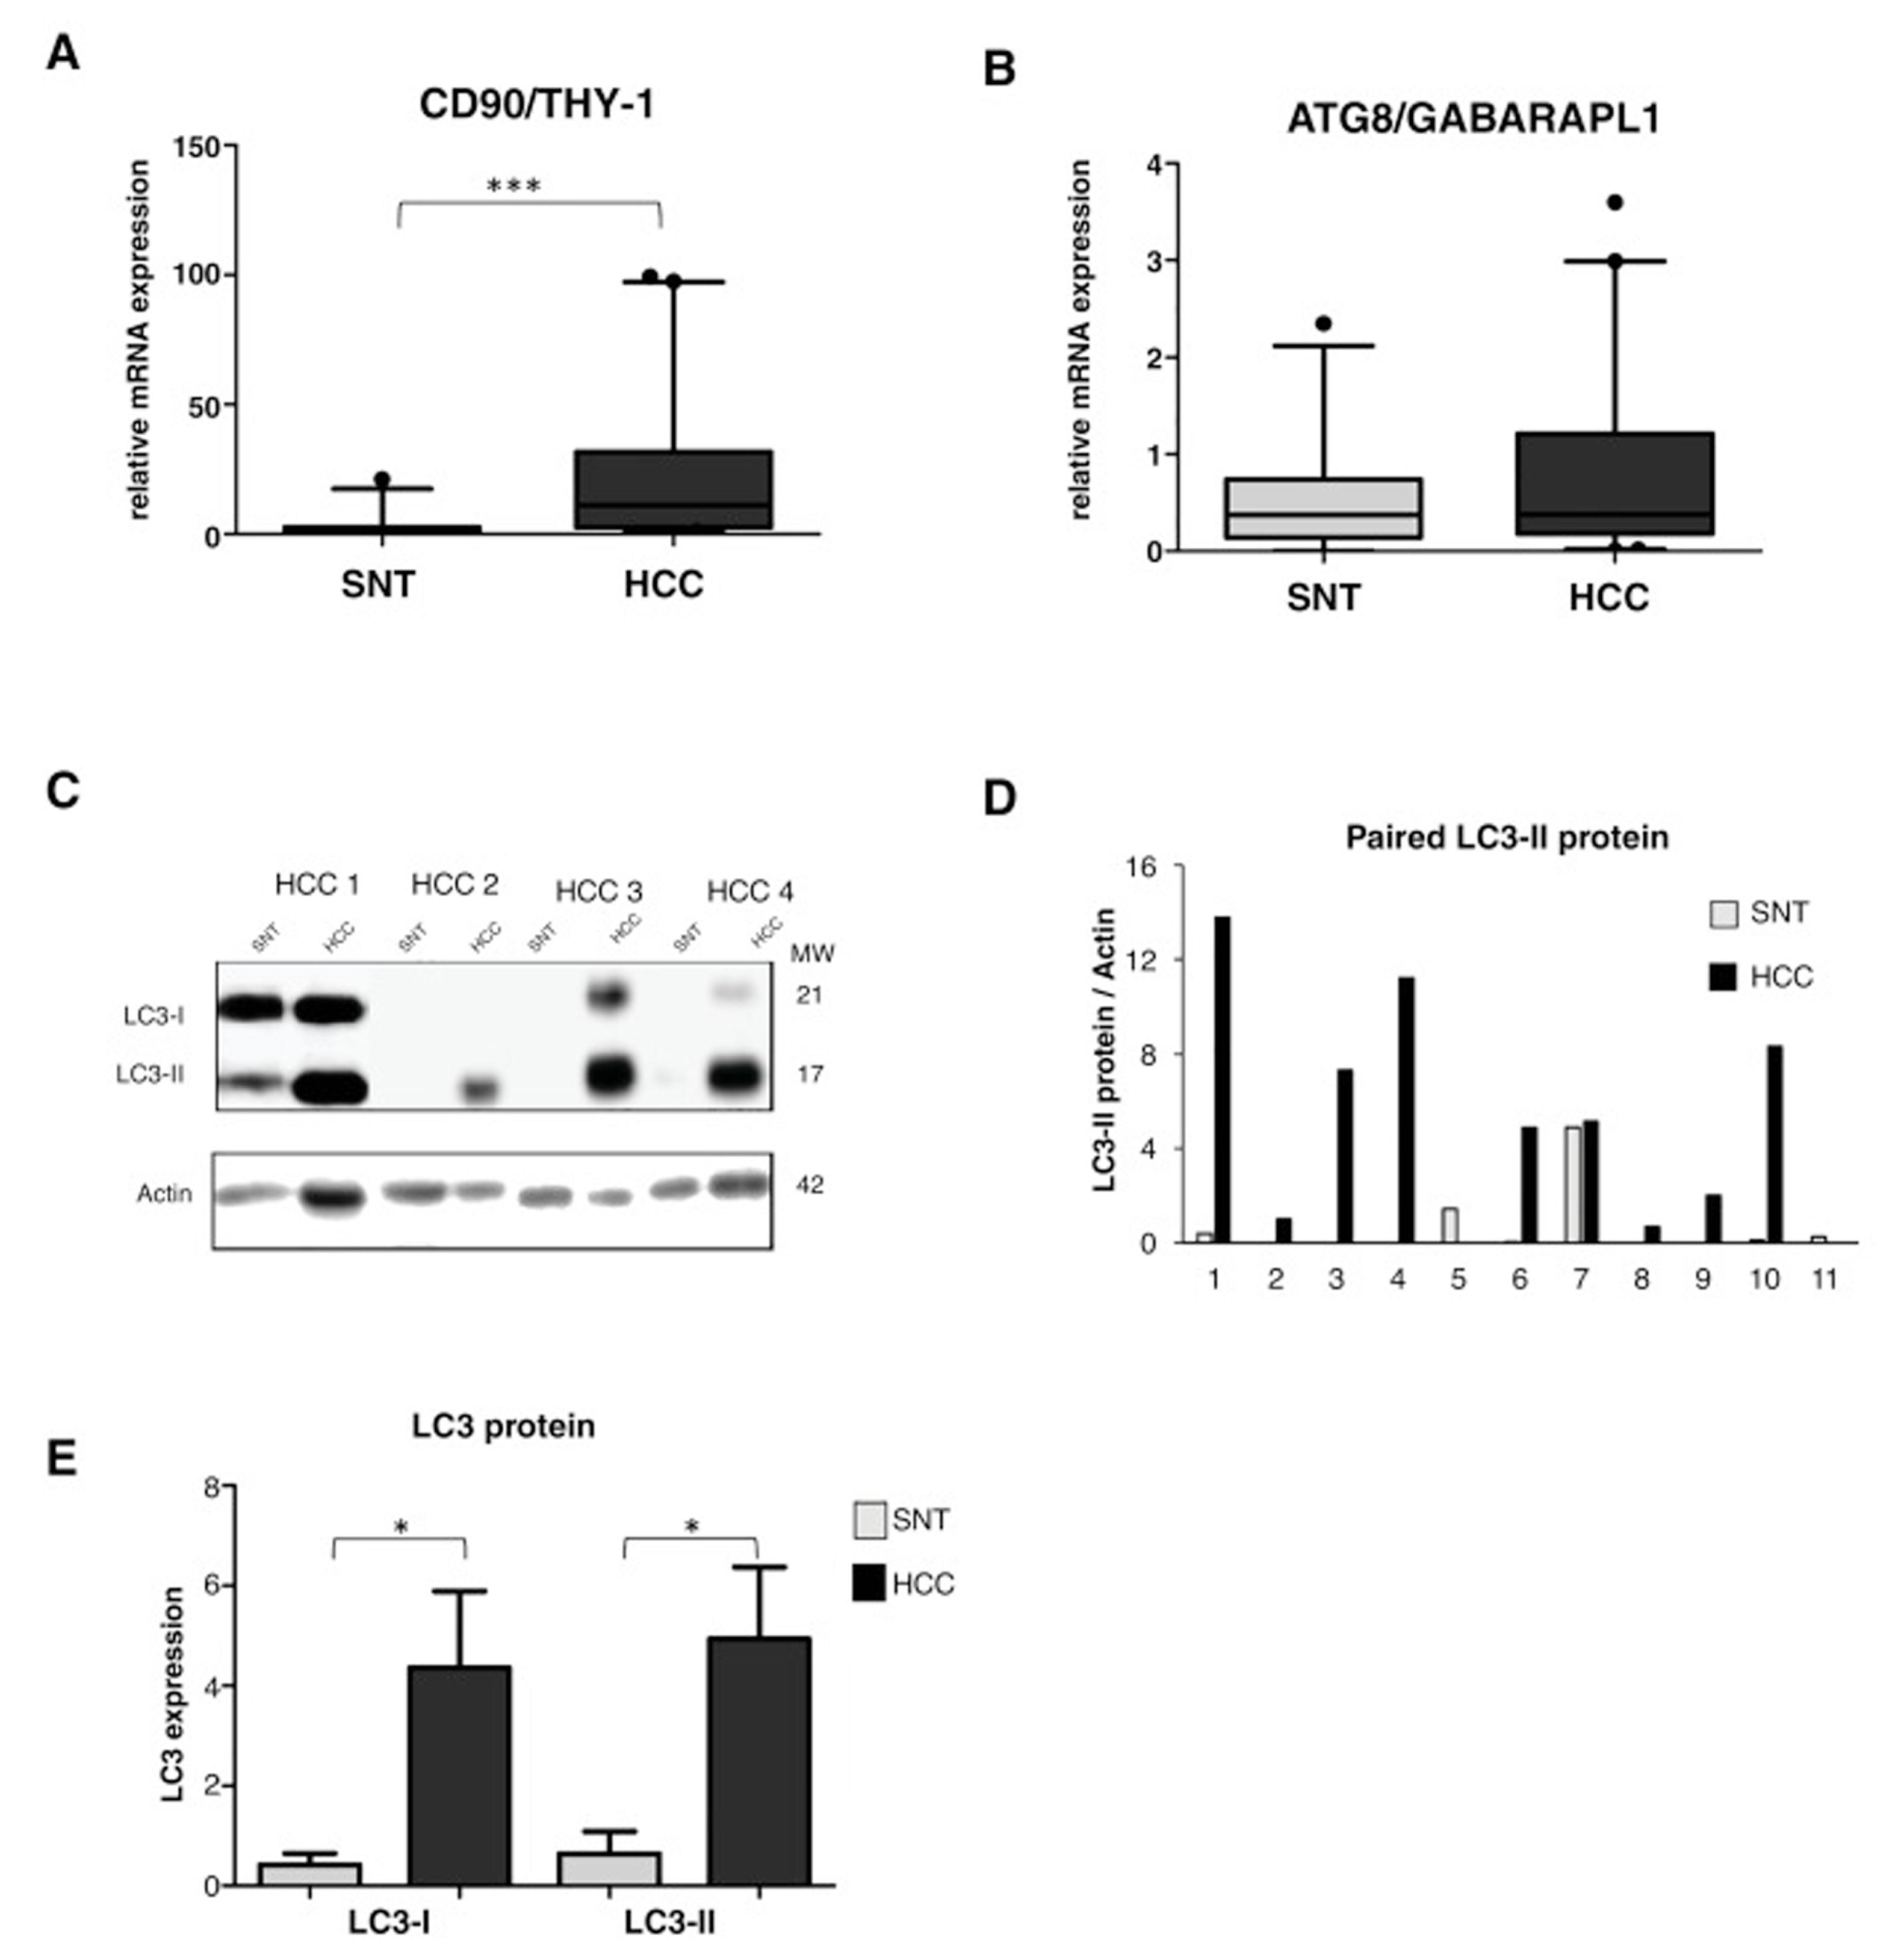
3.2High LC3 protein expression in HCC tissuesOur previous study showed a high up-regulation of CSC marker CD90/THY-1 in HCC tissues in European cohort [31]. Here we checked its expression in this Vietnamese cohort by quantitative RT-PCR. We analyzed mRNA expression from a total of 86 tissue sample specimens by RT-qPCR and expressed in arbitrary unit (au) with a sample considered as 1.0 au. A significant increase of CD90 was observed in HCC compared to its paired surrounding non-tumoral tissue (SNT), with the mean value expressed (95% CI) of 23.2 (14.2-32.4) and 2.7 (1.0-4.5) for HCC and SNT, respectively (p < 0.001) (Fig. 1A).
 showed the presence of LC3-I (21 kDa) and LC3-II (17 kDa). Actin was used as housekeeping protein. D. Relative LC3-II expression of eleven paired HCC and SNT. Densitometric analysis was performed by normalizing LC3-II signal to actin. E. Mean value of LC3-I and LC3-II protein expression. Target gene was normalized to two reference genes ACTB and 18sRNA. The expression of a normal sample was considered as 1.0. Student's t-test: * p < 0.05, *** p < 0.001")
Relevance of autophagy in HCC tissues.
A. mRNA expression of CSC marker CD90/THY-1. B. mRNA expression of autophagy marker ATG8/GABARAPL1 C. Representative of LC3 blotting of paired HCC and its corresponding surrounding non-tumoral tissue (SNT) showed the presence of LC3-I (21 kDa) and LC3-II (17 kDa). Actin was used as housekeeping protein. D. Relative LC3-II expression of eleven paired HCC and SNT. Densitometric analysis was performed by normalizing LC3-II signal to actin. E. Mean value of LC3-I and LC3-II protein expression. Target gene was normalized to two reference genes ACTB and 18sRNA. The expression of a normal sample was considered as 1.0. Student's t-test: * p < 0.05, *** p < 0.001
Using the same set of samples as for CD90, autophagy markers of the ATG family, the GABA type A receptor associated protein like 1 (ATG8/GABARAPL1) and ATG6/Beclin-1 were quantified. The ATG8 mRNA expression was slightly higher in HCC compared to SNT tissues with the mean value expressed (95% CI) of 0.8 (0.5-1.1) and 0.6 (0.4-0.8) for HCC and SNT, respectively (Fig. 1B). On the other hand, the expression of Beclin-1 mRNA was found dispersed, both in HCC and SNT tissues (Supplementary Data Figure S1). Further analysis of the correlation existing between ATG8 mRNA and clinical parameters was defined. Both in HCC and SNT tissues, the ATG8 expression was related to HBV-related HCC (p < 0.05 compared to both metabolic and HCV-related HCC) and ALT level higher than 59 U/mL (median value of the samples) (p < 0.05 and p < 0.001 for HCC and SNT, respectively). ATG8 mRNA expression appeared positively increased in poor-differentiation ES grades. No other clinical parameters were related to the ATG8F mRNA expression (Table 2).
Correlation between ATG8 mRNA and clinical parameters.
| Parameter | n | ATG8 mRNA expression (mean +/- SD) | ||||
|---|---|---|---|---|---|---|
| HCC | p | SNT | p | |||
| Age | < = 58 | 21 | 0.66 ± 0.73 | ns | 0.51 ± 0.48 | ns |
| >58 | 22 | 0.83 ± 1.00 | 0.71 ± 0.74 | |||
| Sex | M | 35 | 0.79 ± 0.97 | ns | 0.54 ± 0.61 | ns |
| F | 8 | 0.51 ± 0.40 | 0.98 ± 0.61 | |||
| Etiology | HBV | 28 | 1.15 ± 1.42 | <0.05 | 0.72 ± 0.71 | <0.05 |
| HCV | 6 | 0.59 ± 0.75 | 0.48 ± 0.53 | |||
| Metabolic | 9 | 0.96 ± 0.91 | 1.08 ± 0.80 | |||
| HCC size | < 5 cm | 21 | 0.61 ± 0.61 | ns | 0.51 ± 0.49 | ns |
| > 5 cm | 17 | 0.82 ± 1.10 | 0.59 ± 0.72 | |||
| ES grade | ES1 | 15 | 0.48 ± 0.58 | ns | 0.44 ± 0.56 | ns |
| ES2 | 11 | 0.84 ± 1.24 | 0.75 ± 0.51 | |||
| ES3-4 | 11 | 1.01 ± 1.05 | 0.58 ± 0.81 | |||
| ALT | < 59 (U/mL) | 31 | 0.57 ± 0.69 | <0.05 | 0.43 ± 0.44 | <0.01 |
| >59 (U/mL) | 12 | 1.32 ± 1.20 | 1.09 ± 0.82 | |||
| AST | <75 (U/mL) | 33 | 0.72 ± 0.88 | ns | 0.53 ± 0.52 | ns |
| >75 (U/mL) | 10 | 0.87 ± 0.98 | 0.82 ± 0.81 | |||
| AFP | <20 ng/mL | 14 | 0.87 ± 0.86 | ns | 0.54 ± 0.60 | ns |
| 20 - 400 ng/mL | 14 | 0.67 ± 0.89 | 0.38 ± 0.24 | |||
| >400 ng/mL | 9 | 0.34 ± 0.44 | 0.40 ± 0.38 | |||
The relative expression of LC3 protein in paired HCC and SNT tissues was then determined by Western blot (Fig. 1C). As shown in Fig. 1E, both LC3 bands, the LC3-I (21 kDa), and the LC3-II (17 kDa) were highly expressed in HCC tissues (p < 0.05). Densitometric analysis in a representative eleven paired HCC and its corresponding SNT showed that LC3-II, the autophagy turnover marker, was significantly up-regulated in HCC for around 5-fold (Fig. 1D).
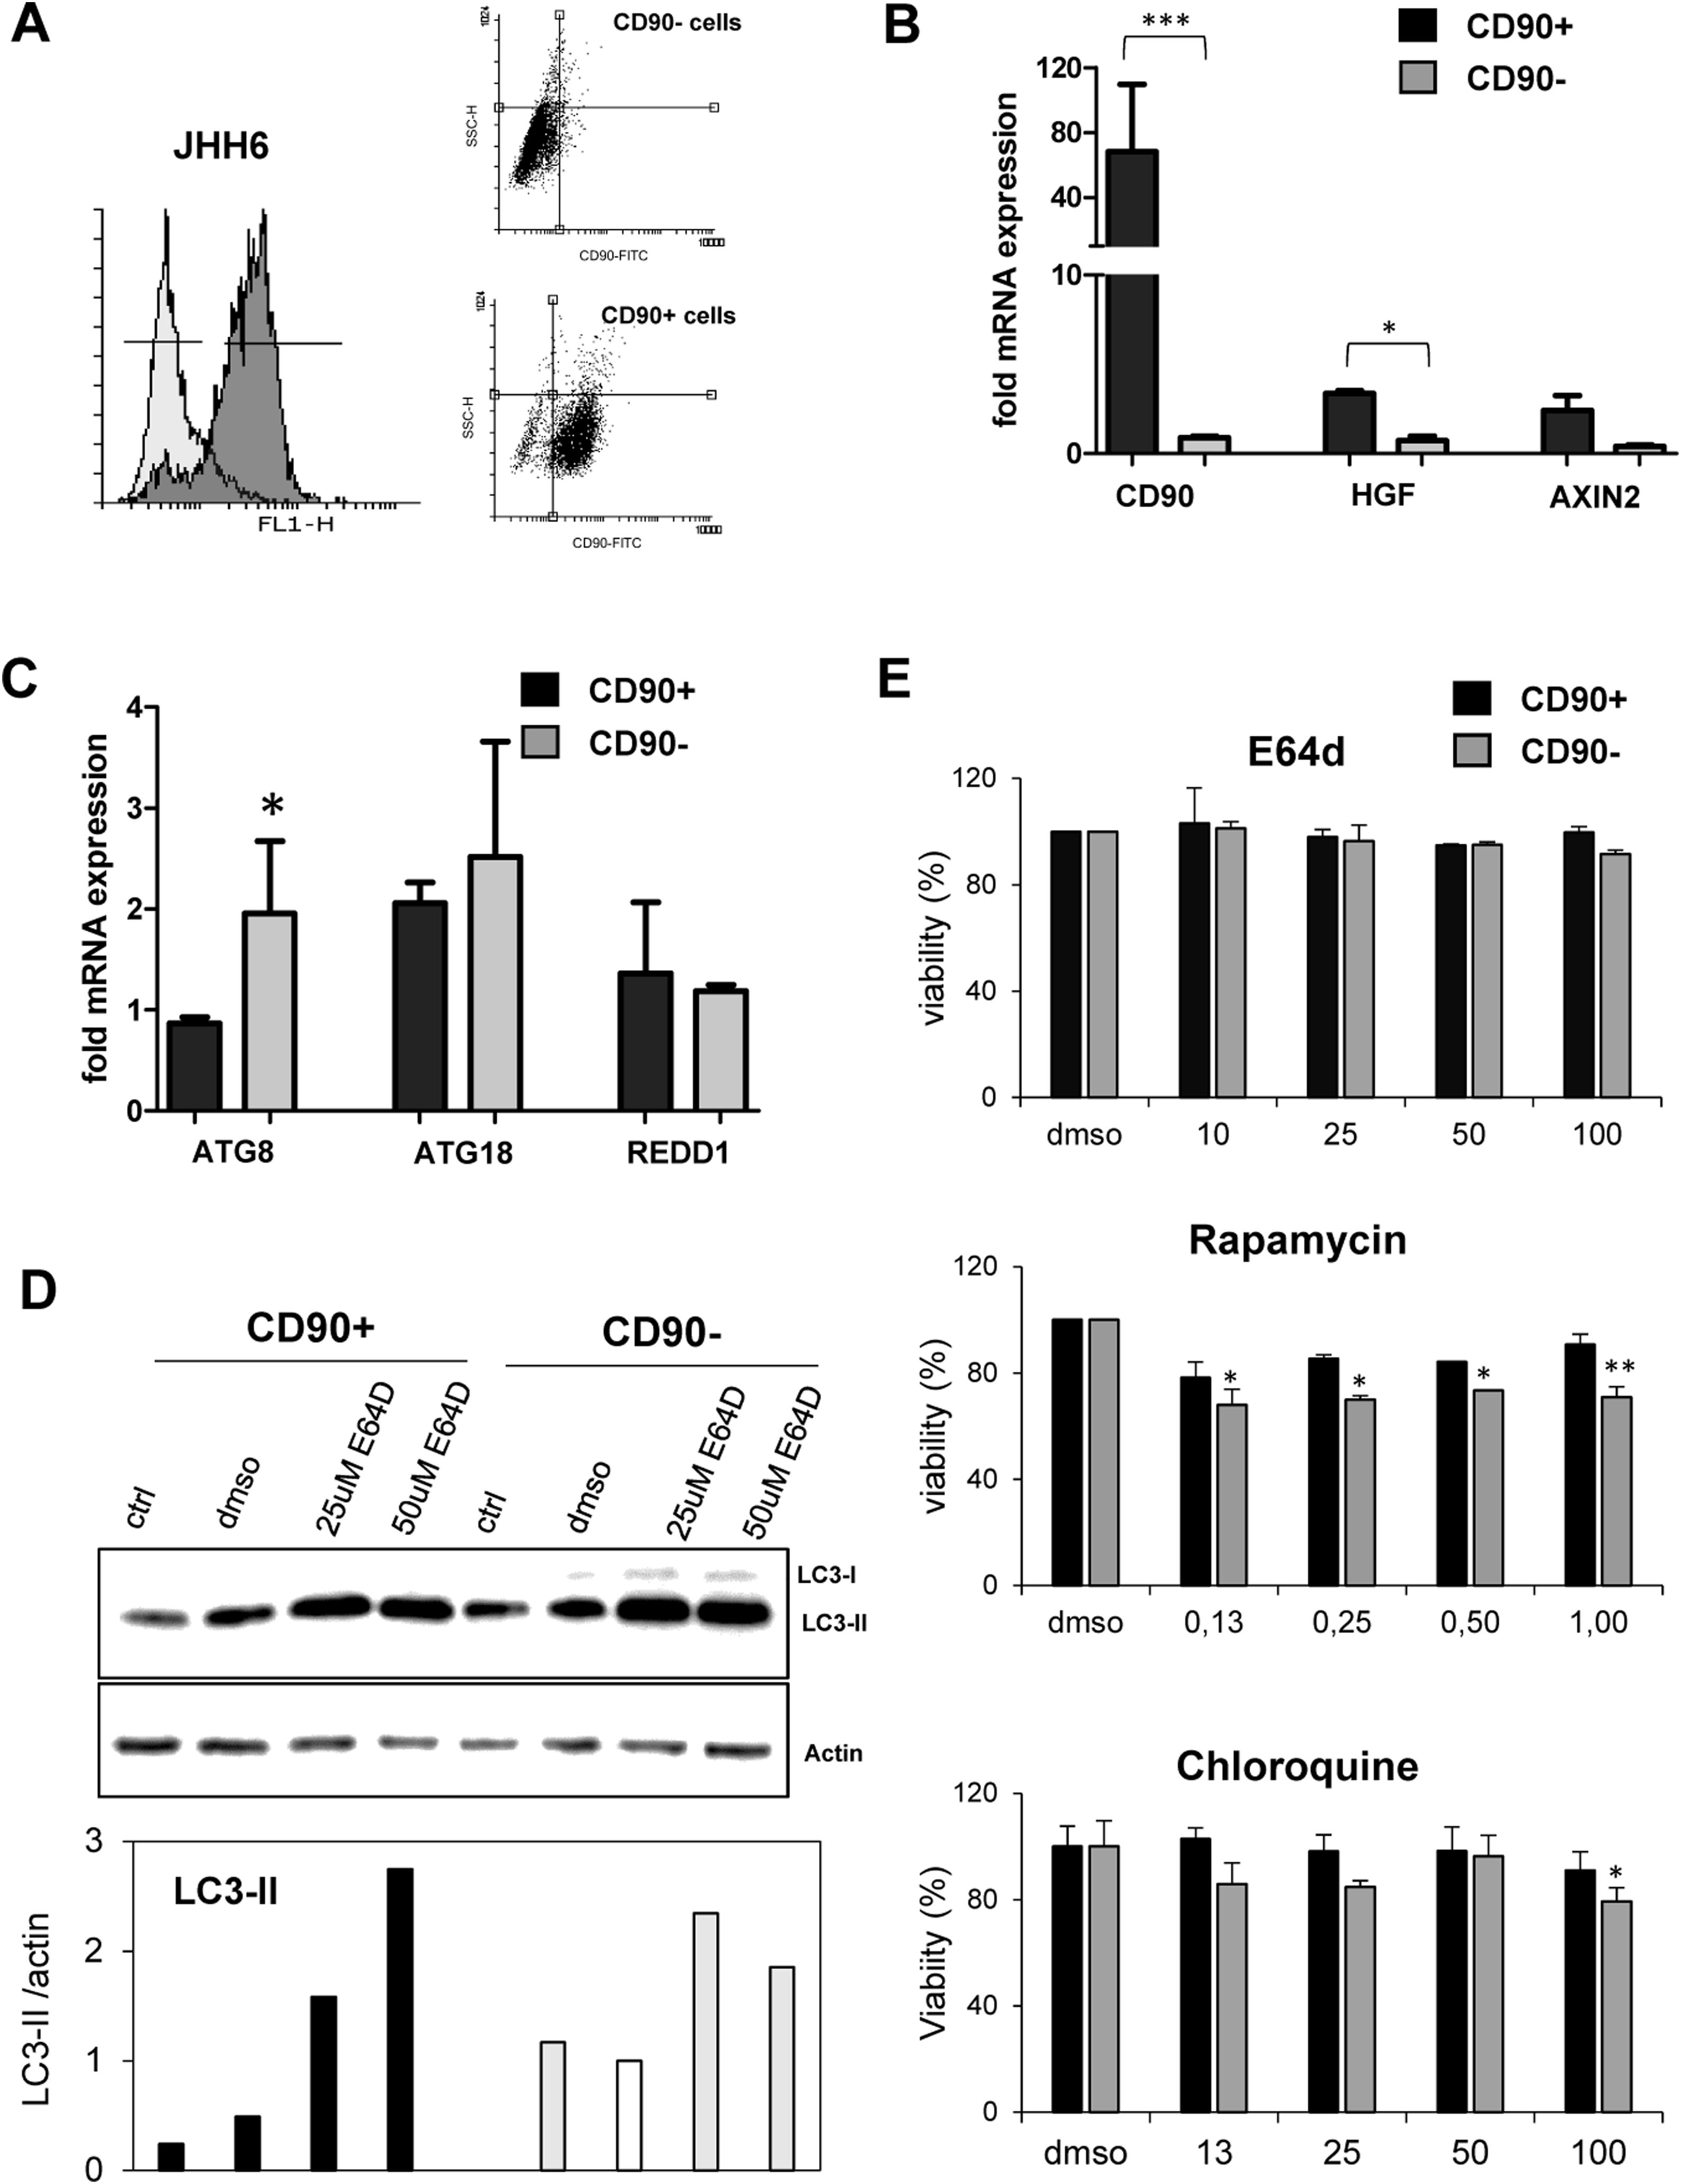
3.3Differential expression of autophagy markers in isolated CD90+ cellsSince the CD90 is a marker for different cell types, we explored the function of CD90+ cells in HCC by using an in vitro model using a HCC cell line. CD90+ cells from JHH6 were isolated by magnetic flow sorting and confirmed by flow cytometry as previously described [31]. The purity of CD90+ subpopulations used in the analysis was chosen higher than 70% of positivity (up to 5th passage after sorting) (Fig. 2A). As expected, at basal level, the CD90 mRNA was around 60-fold higher in isolated CD90+ subpopulations than its CD90- counterpart (p < 0.001) (Fig. 2A-B). We checked also several markers such as hepatocyte growth factor (HGF) and AXIN2 which were previously reported to be related to autophagy in CD90, showing up-regulation in this cell subpopulation (Fig. 2B).
. B. Confirmation of cells separation by mRNA expression of CD90. CD90+ cells showed higher expression of HGF and AXIN2. C. mRNA expression of autophagy marker ATG8/GABARAPL1, ATG18/WIPI1, and REDD1/DDIT4 in separated cells. D. LC-3 blotting of separated cells together with its relative LC3-II protein expression. Densitometric analysis was performed by normalizing LC3-II signal to actin.CD90- with DMSO was indicated as 1.0. E. MTT test of several inhibitors/inducers of autophagy. 0.3% DMSO was taken as 100% for each subpopulation. Student's t-test: * p < 0.05, ** p < 0.01, *** p < 0.001")
Differential basal autophagy activity between CD90+ and CD90- subpopulation of JHH6.
A. Flow cytometric profile of isolated CD90+ cells by gradual magnetic sorting showed high presence of CD90+ in positive fraction (>85%). B. Confirmation of cells separation by mRNA expression of CD90. CD90+ cells showed higher expression of HGF and AXIN2. C. mRNA expression of autophagy marker ATG8/GABARAPL1, ATG18/WIPI1, and REDD1/DDIT4 in separated cells. D. LC-3 blotting of separated cells together with its relative LC3-II protein expression. Densitometric analysis was performed by normalizing LC3-II signal to actin.CD90- with DMSO was indicated as 1.0. E. MTT test of several inhibitors/inducers of autophagy. 0.3% DMSO was taken as 100% for each subpopulation. Student's t-test: * p < 0.05, ** p < 0.01, *** p < 0.001
The expressions of autophagy genes and basal LC3 protein in JHH6 CD90+ and CD90- cells were then determined by mRNA expression (RTq-PCR) and Western blot, respectively. Autophagy-related genes ATG8 (p < 0.05) and ATG18 were lower expressed in CD90+ compared to its CD90- counterpart for around 50% and 80%, respectively, while REDD1 expression was comparable. The mRNA expression result was then confirmed by protein expression using LC3 blotting. At basal level (ctrl and DMSO), both cells expressed LC3-II (17 kDa) band. However, both LC3-II band (17 kDa) and LC3-I (21 kDa) were higher in the CD90- cells compared to CD90+ (p < 0.05) in line with the ATG8 and ATG18 mRNA expression data (Fig. 2C-D).
In order to check LC3-II turnover upon autophagy stimulation, both cells were treated with E64D, an inhibitor of lysosomal proteases, at concentrations ranging from 5 to 200 µM for 24 hours. DMSO concentration was calculated being 0.3% in each treatment. MTT test performed to check cell viability upon treatment did not show any toxicity for the chosen concentration of 50 µM (Fig. 2E). Upon treatment with E64D and vehicle DMSO, the extent of LC3-II accumulation was more noticeable in CD90+ cells (about 6-fold and 2-fold, for E64D and DMSO, respectively) compared to CD90- cells (about 3-fold for E64D) (Fig. 2D-E). This data may suggest that CD90 cells result more sensitive to autophagy stimulation even though this sensitivity was not reflected by cell viability. Cell viability tests for rapamycin, an m-TOR inhibitor, and chloroquine, a lysosome proteasomal inhibitor, both involved in autophagy pathway, were also performed, showing higher viabilities for the CD90+ cells (Fig. 2E).
3.4Effect of doxorubicin on autophagy in CD90+ cellsAutophagy is associated with a cell defense mechanism against chemotherapy. Here we treated both CD90+ and CD90- cells with doxorubicin, an anti-neoplastic drug commonly used to treat HCC in the early-intermediate stage. Concentration of 5 µM was chosen based on our previous data on the LC50 of doxorubicin in several HCC cell lines, including in the JHH6 [32].
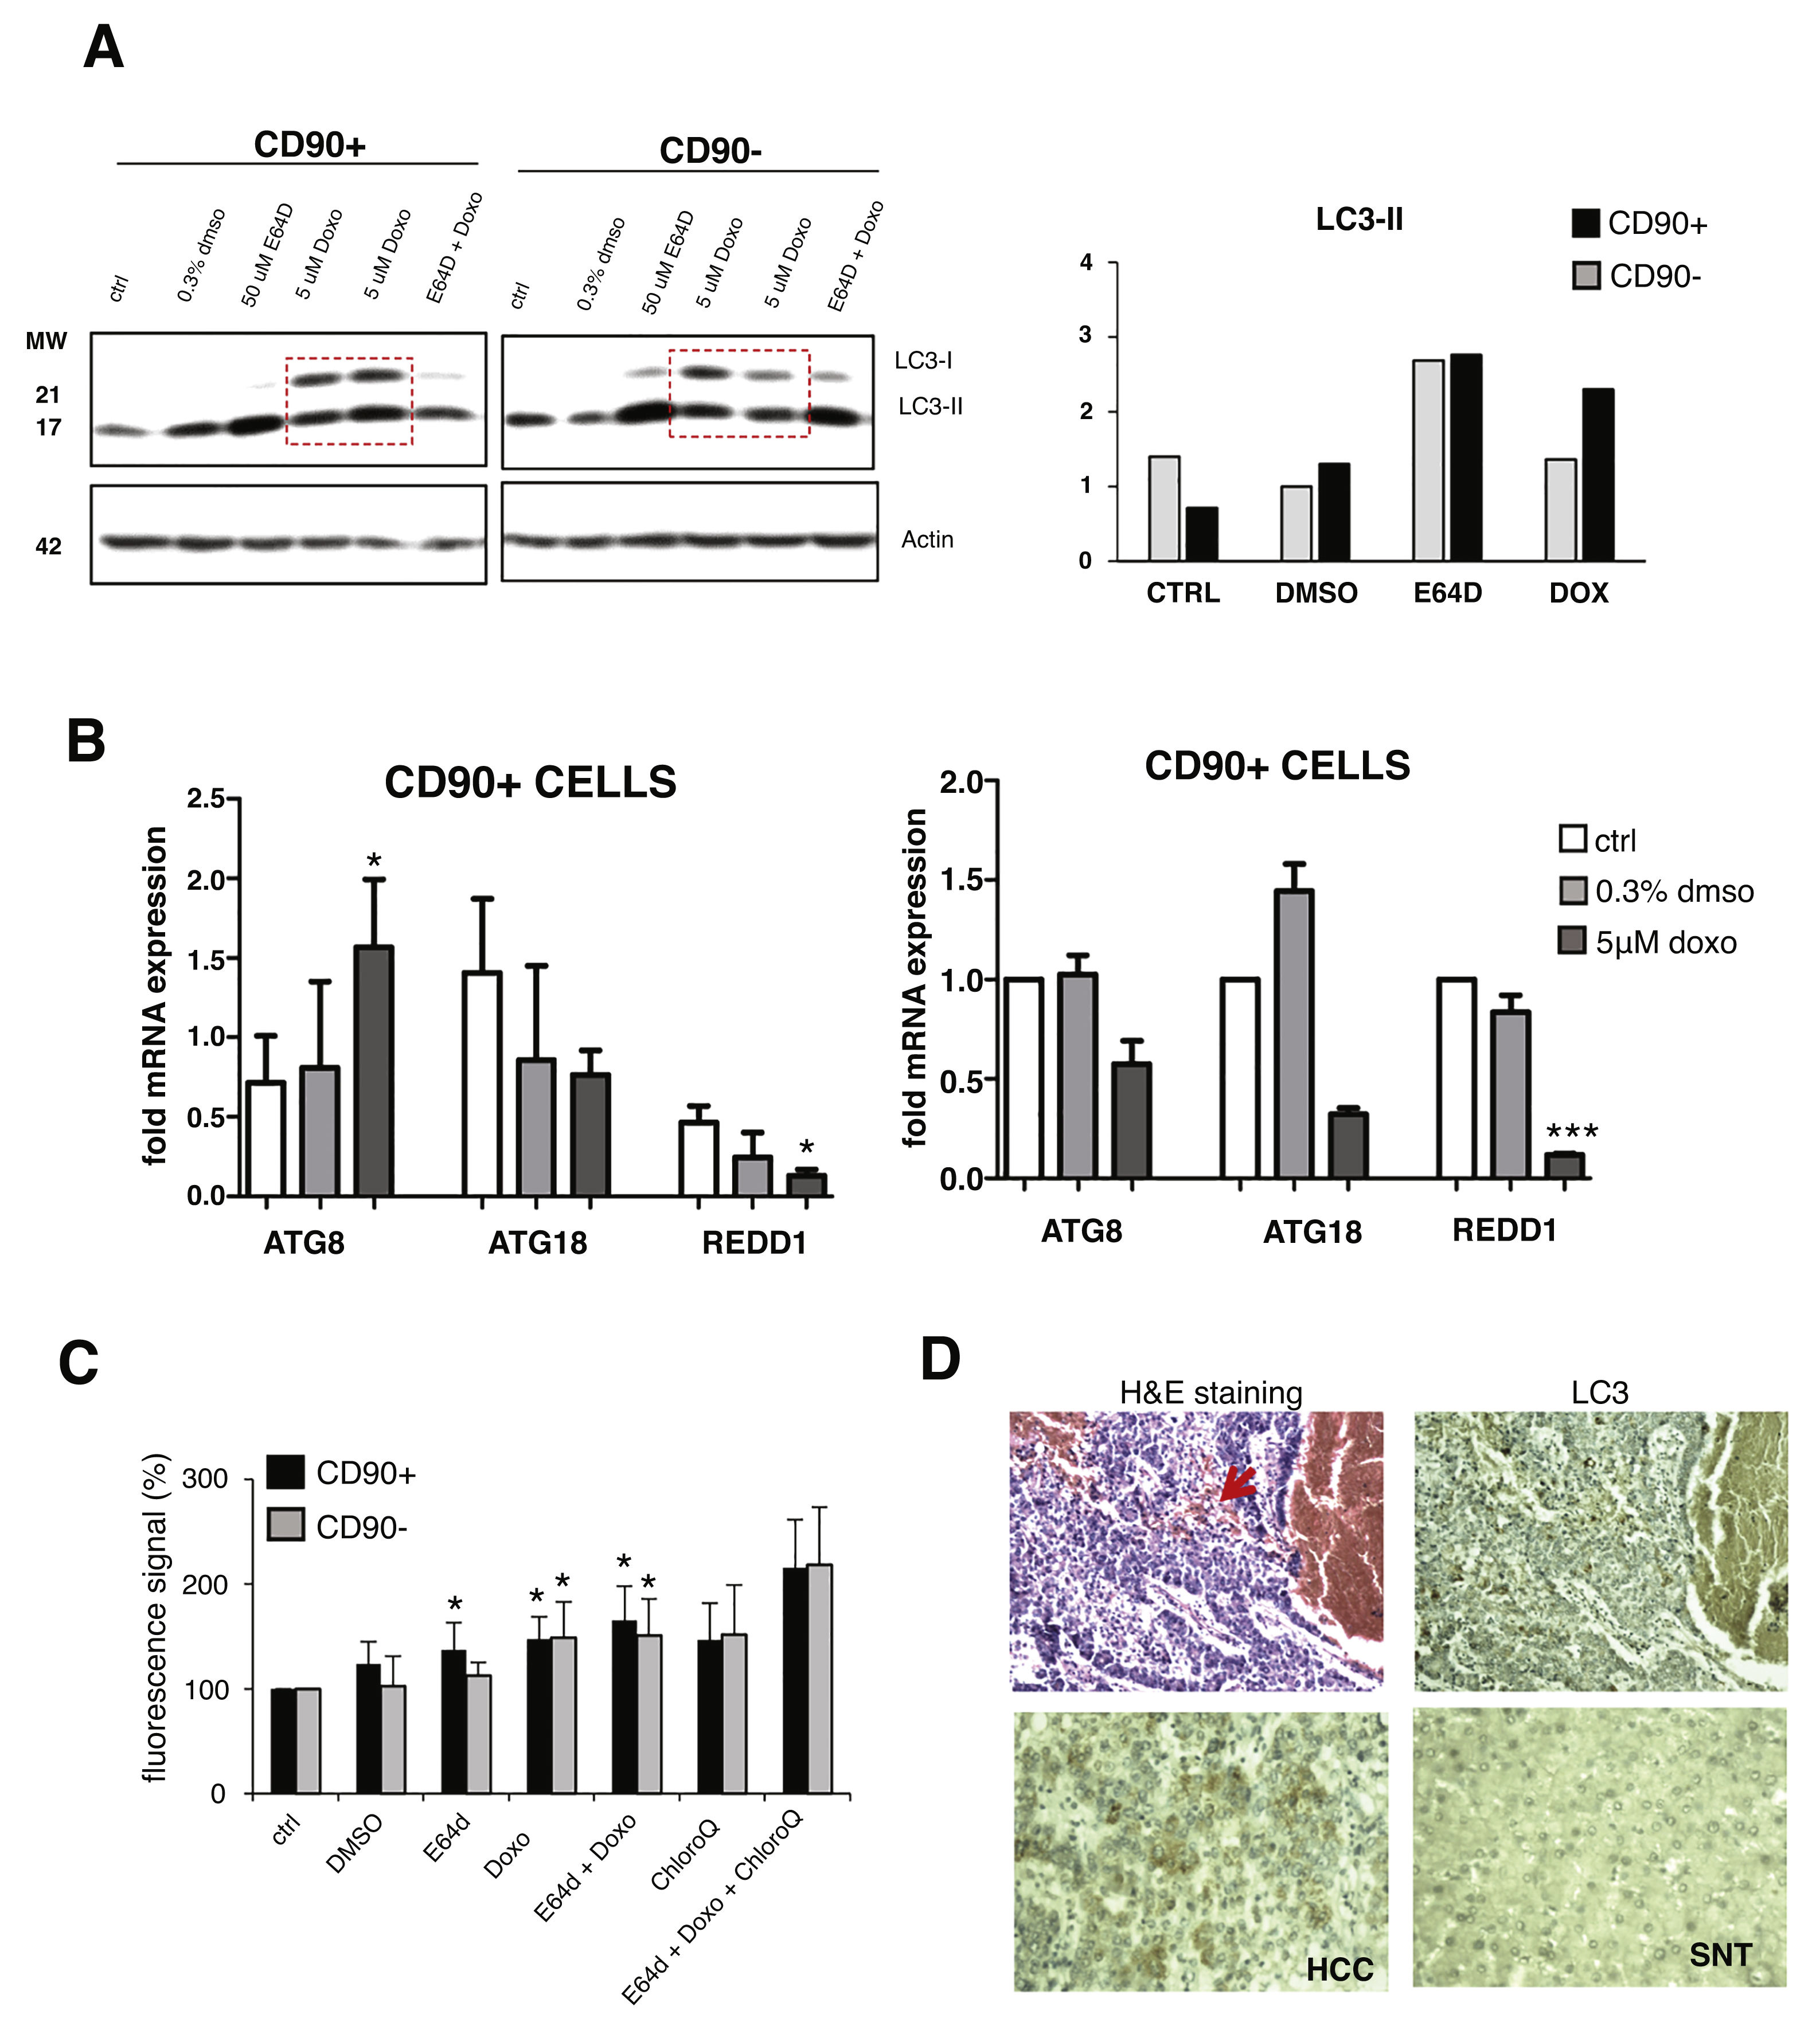
Upon doxorubicin treatment for 24 hours, both LC3 bands were increased in CD90+ and CD90-subpopulations. The increase of LC3-I level was also apparent, also in comparison with E64D, indicated an activation of autophagy-translated genes after doxorubicin exposure. After the treatment, the extent of LC3-II up-regulation was higher in CD90+ compared to CD90- cells (p < 0.05) (Fig. 3A). The pattern of gene modulations between the two cell populations was also dissimilar. The increase of ATG8 was noticed only in CD90+ cells (Fig. 3B).
. Lower panel: LC3 expression in paired SNT and HCC tissue.")
Autophagy activation after doxorubicin in CD90+ and CD90- subpopulation of JHH6.
A. LC-3 blotting of doxorubicin-treated cells together with its relative LC3-II protein expression. Densitometric analysis was performed by normalizing LC3-II signal to actin.CD90- DMSO was indicated as 1.0. Red box showed cells treated with doxorubicin. B. mRNA expression of autophagy marker ATG8/GABARAPL1, ATG18/WIPI1, and REDD1/DDIT4. Target gene was normalized to two reference genes ACTB and 18sRNA. The expression of non-treated in CD90- cells was considered as 1.0. C. Determination of autophagic vacuoles also in the presence of lysosomal proteosomal inhibitor chloroquine. Untreated control cells for each cell subpopulations was taken as 100%. Student's t-test * p < 0.05 vs CTRL of each subpopulation. D. Upper panel: A representative of HE and LC3 staining in a HCC nodule with an administration of doxorubicin (arrow). Lower panel: LC3 expression in paired SNT and HCC tissue.
The presence of autophagic vacuoles was detected by fluorescence reading. Green autophagy signal was then normalized with the blue nucleus signal and the data were presented as relative to control of each subpopulation. The presence of autophagic vacuoles after E64D was slightly noticed for CD90+ compared to CD90- cells (Fig. 3C). To compare data doxorubicin treatment in vitro in clinical sample, we checked also two HCC samples whose patient had received a previous locoregional therapy by doxorubicin, showing positivity of LC3 on the tissues (Fig.3D).
4DiscussionAutophagy is a self-digestion and is one of the normal cellular mechanisms to maintain its intracellular homeostasis by transporting cytoplasmic material to lysosomes via autophagosomes. Upon exposure to the extrinsic agents, including chemotherapeutic drugs, autophagy can be activated thus eliminating potential damaged materials and organelles.
Currently, chemotherapy by transarterial chemoembolization is an internationally-approved treatment option for HCC patients [33]. Doxorubicin is one of the most common chemotherapy agents used to treat HCC; however, HCC resistance to doxorubicin is a common feature of therapeutic regimens, thus reducing the efficacy of the treatment. Furthermore, response to doxorubicin might vary not only among patients but also in an individual HCC cases. Disparate sensitivities may be related to HCC heterogeneity, including in the presence of various cellular populations.
CD90 is one of the markers commonly used to recognize CSC population. In this study, we showed that CD90 mRNA is significantly upregulated in HCC compared to its paired non-tumoral tissues. This data, obtained from Asian HCC cases, was in line with our previous data from European cases [31], suggesting CD90 as a common marker of hepatocarcinogenesis, also for diverse etiologies of HCC. Several studies had demonstrated that separated CD90+ cells have different properties in comparison to the ‘bulk’ of the tumor (CD90-). CD90+ cells were associated with poor differentiation, inflammation, ABC transporters, drug resistance, and lipid metabolism compared to CD90- cells or CD90+ cells from non-tumoral liver [9,10,34].
In vitro studies had shown that doxorubicin induced cytotoxicity and alteration of cellular organelles together with the upregulation of LC3-II protein and the involvement of autophagy [35]. In this study we showed that in JHH6, a poor-differentiated HCC cell line, autophagy activation extent by doxorubicin were distinct between CD90+ and CD90- subpopulations, with the higher capacity observed in the positive subpopulation. From both mRNA (ATG8/LC3/GABARAPL1) and LC3 immunoblotting data, it was noticed that even though the CD90+ subpopulations had a lower basal expression, they were more sensitive to autophagic induction shown by the higher up-regulation as compared to CD90- cells. This increase was not only observed in doxorubicin and E64D treatments, but a substantial effect was also noticed upon 0.3% DMSO as a vehicle.
In HCC tissues, ATG8 mRNA distributions were comparable between HCC nodules (high CD90) and SNT (low CD90), while in JHH6 cell line, ATG8 expression was significantly lower in CD90+ cells. This data was in line with a previous report showing that a low level of ATG8 in HCC tissues was related to the bad prognosis of the patient [36], similarly to what observed for the high level of CD90. From clinical data, we observed that ATG8 expression is significantly high in HBV-related HCCs and patients with high ALT levels. Furthermore, ATG8 expression in HCC nodules progressively increased moving from well-differentiated (ES1), moderate-differentiated (ES2) to poor-differentiated HCC (ES3/ES4). An inverse correlation was found for AFP level, also observed for high CD90+ expression in previous studies [8,31].
To confirm mRNA data, we performed LC3 protein expression in liver tissues. Our data was in line with previous studies [37–39] showing a high LC3 expression in HCC compared to SNT tissues. From immunoblotting data of paired HCC tissues, we observed high variability of LC3 expression, with the majority being high in the HCC nodule compared to its SNT (72%). It should be noted that the association between autophagy genes and protein in HCC nodules and the clinical variables could be contrasting. We consider that a direct quantification of LC3 or autophagy genes in different HCC specimens might be rather complicated since normal cells have a basal autophagic flux that may vary between individuals in a physiologic manner. Wide cancer heterogeneity and cancer microenvironment further complicate the data. For this reason, in-depth analysis of HCC subpopulations as shown in this study would be useful to better understand the mechanism.
In conclusion, we confirm that HCC CD90+ and CD90- cells have different autophagy activation. Autophagy is involved in cancer-defense mechanism against doxorubicin. Cancer promoting the function of autophagy in CD90+ cells was related to HCC environment.
Conflict of interestAuthors declare no conflict of interest.
Financial supportThis work was funded by a grant of International Cooperation with Vietnam from the Regione of Friuli Venezia Giulia to the Fondazione Italiana Fegato. CHCS was supported by the grant from Associazione Italiana per la Ricerca sul Cancro (AIRC) (IG19862) to GT.
The authors thank Dr. C Bellarosa for the reagents on the autophagy in vitro experiments at the Fondazione Italiana Fegato. The authors also thank the Vietnam National Foundation for Science and Technology Development (NAFOSTED; grant no. 108.05-2017.30) for reagents on the autophagy experiment in Vietnam.
The following are Supplementary data to this article:


