


The prevalence of alcohol, tobacco, and coffee use and association with liver health among North Americans with Chronic Hepatitis B (CHB) infection has not been well described.
Materials and methodsThe Hepatitis B Research Network includes an observational study of untreated CHB adults enrolled at 21 sites in the United States and Canada. Alcohol use was categorized as none, moderate, and at-risk based on the definition from the National Institute on Alcohol Abuse and Alcoholism; tobacco use as never, current and former; coffee use as none, 1–2 cups/day, and ≥3 cups/day. Linear regression and linear mixed models were used to associate lifestyle behaviors with ALT and FIB-4 values.
Results1330 participants met eligibility: 53% males, 71% Asian and the median age was 42 years (IQR: 34–52). Median ALT was 33U/L (IQR: 22–50), 37% had HBV DNA <103IU/mL, 71% were HBeAg negative, and 65% had a FIB-4 <1.45. At baseline, 8% of participants were at-risk alcohol drinkers, 11% were current smokers and 92% drank <3 cups of coffee/day. Current tobacco and ‘at-risk’ alcohol use, were significantly associated with elevated ALT levels in univariable analyses, however, these associations were not statistically significant when controlling for sociodemographic and HBV characteristics.
ConclusionsIn this large diverse cohort of untreated CHB participants, at-risk alcohol use, current tobacco use and limited coffee consumption did not have an association with high ALT and FIB-4 values. In contrast, significant associations were found between the frequency of these lifestyle behaviors and sociodemographic factors.
Chronic Hepatitis B (CHB) is a viral infection that affects roughly 250 million individuals worldwide with 2.2 million individuals in the United States (US). CHB can lead to an increased risk of cirrhosis, liver failure, hepatocellular carcinoma (HCC) and death with indirect costs of care reaching $1.3 billion in the US [1–4]. Along with viral and host mediated factors, lifestyle behaviors may also contribute to progression of liver disease. For example, alcohol and tobacco use are known risk factors in the development of cirrhosis and HCC in chronic liver diseases [4–7]. Conversely, coffee drinking may have a protective role by reducing liver fibrosis and lowering the risk of HCC in certain liver diseases such as Hepatitis C [8–10]. Despite the potential of various lifestyle behaviors to impact the development of liver fibrosis in CHB, large-scale epidemiological data in a multiethnic adult population living with CHB are lacking. The aim of this study was to describe the prevalence of lifestyle behaviors, specifically; alcohol, tobacco, and coffee consumption in CHB patients enrolled in the Hepatitis B Research Network (HBRN) and to correlate lifestyle behaviors with clinical markers of liver disease severity including alanine aminotransferase (ALT) levels and the Fibrosis-4 score (FIB-4).
2Materials and methods2.1The Hepatitis B Research Network (HBRN)The Hepatitis B Research Network (HBRN) is a research consortium funded by the National Institute of Diabetes and Digestive and Kidney Diseases (NIDDK) to examine the epidemiology, natural history, and long-term outcome of CHB among North American's from 28 clinical sites in the United States and Toronto, Canada [12]. All protocols were approved by the HBRN Steering Committee and the Institutional Review Boards (Research Ethics Board in the case of the Toronto site) of the participating sites and all participants provided written informed consent.
2.2Adult cohort study designThe HBRN adult cohort study is a prospective observational study of persons at least 18 years old with CHB infection defined as HBsAg positivity for at least 6 months. Those with a history of hepatic decompensation, HCC, solid organ or bone marrow transplantation and human immunodeficiency virus (HIV) co-infection were excluded. Pregnant women, those with current and/or previous HBV antiviral therapy, those with acute hepatitis B and participants who were specifically targeted for enrollment in sub-studies (Immune Active and Immune Tolerant, anti-HDV, pregnancy, and immunology studies) were also excluded from the current analysis. Data collected at baseline and at Weeks 48, 96, and 144 are reported for this analysis.
2.3Baseline evaluationThe baseline evaluation included a detailed medical history, physical examination, and laboratory tests. Social and demographic characteristics collected include sex, age, race, household income, employment status, education, and continent of birth. Participants were asked to complete a health questionnaire on their use of alcohol, tobacco and coffee. One drink was defined as a 12-ounce can of beer, a 4-ounce glass of wine or a 1-ounce shot of liquor. Alcohol consumption was categorized into (a) none (fewer than 12 drinks in lifetime and/or no alcohol in last 12 months), (b) moderate use (12 or more drinks in the past year), and (c) at-risk use based on the National Institute on Alcohol Abuse and Alcoholism (NIAAA) definition of heavy drinking (>4 drinks/day or total of 14 drinks/week for males and >3 drinks/day or a total of >7drinks/week for females or if there was a history of binge drinking: ≥5 drinks in a single day in the past 12 months) [13]. Tobacco included cigarette, cigar, or smokeless tobacco and participants were categorized as (a) never smoker, (b) former smoker or (c) current smoker. Coffee use was defined as one 8-ounce cup or one espresso or cappuccino beverage and categorized as (a) less than 1 or none/day, (b) 1–2/day, and (c) ≥3/day in the last 12 months. Laboratory markers of liver disease assessed for this study included: ALT levels and FIB-4 score.
2.4Statistical analysisCategorical variables were summarized using frequencies and percentages. Continuous variables were described as median values and interquartile ranges. Lifestyle behavior variables (alcohol, tobacco, coffee) were described and compared between patient and disease characteristics using Pearson Chi-squared or Kruskal–Wallis tests. Liver specific outcome variables ALT and FIB-4 were described as categories and for regression models continuous values were log-transformed (base-2) to achieve normality. To examine the associations of baseline behaviors and baseline ALT levels, univariable linear regression was used. The associations between ALT levels and each behavior were also investigated using multivariable analysis by fitting linear regression models that adjusted for all behaviors simultaneously, in addition to significant baseline sociodemographic characteristics and HBV characteristics such as HBV DNA, HBeAg status, and HBV genotype. This same procedure was repeated with FIB-4 as the dependent variable. Linear mixed models were used to determine the associations of longitudinal ALT levels and behaviors over time. The associations between longitudinal ALT levels and behaviors over time were adjusted for significant baseline sociodemographic characteristics and all behaviors simultaneously. To determine if the associations changed over time, the interaction of behavior and time-point by the F-test was tested. The above procedures for the longitudinal models were repeated for FIB-4. These results were summarized as ratios (and corresponding 95% confidence intervals) comparing the mean liver disease marker of a given group to the reference group. Comparisons of estimates for multi-level categorical variables used F-tests, and were considered significant at a nominal p<0.05. Analyses were performed with SAS 9.4 (Cary, NC).
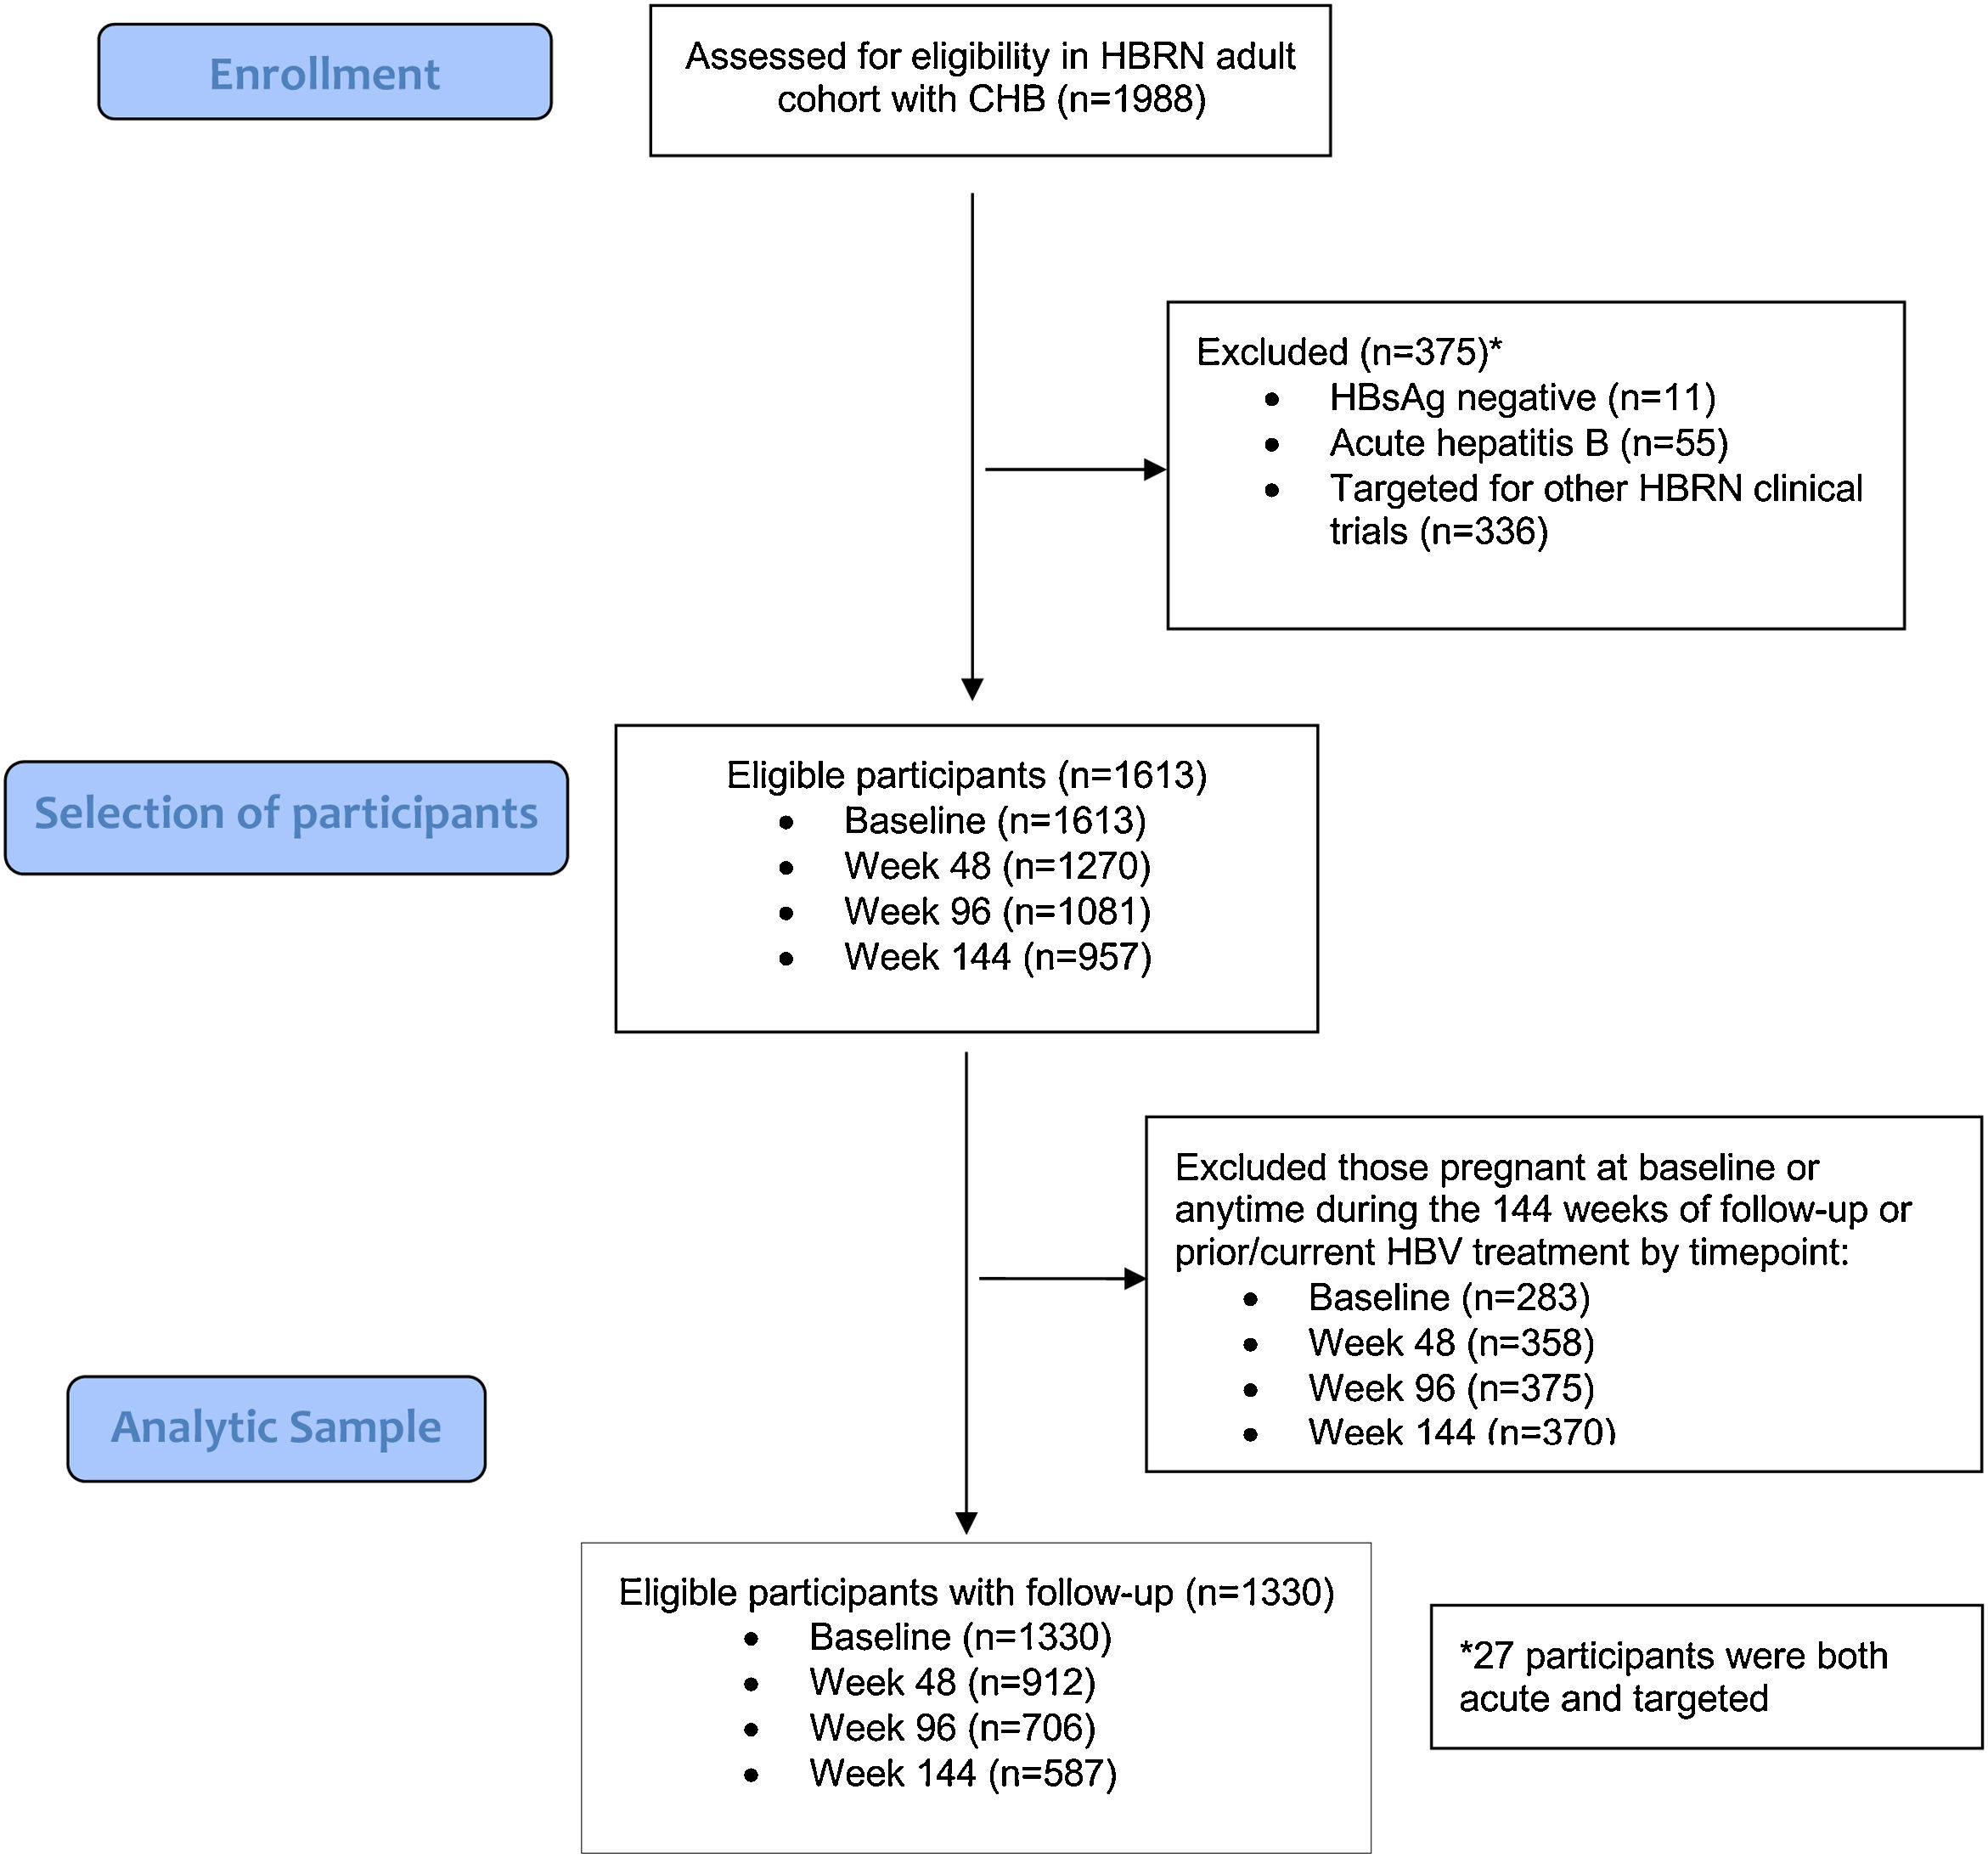
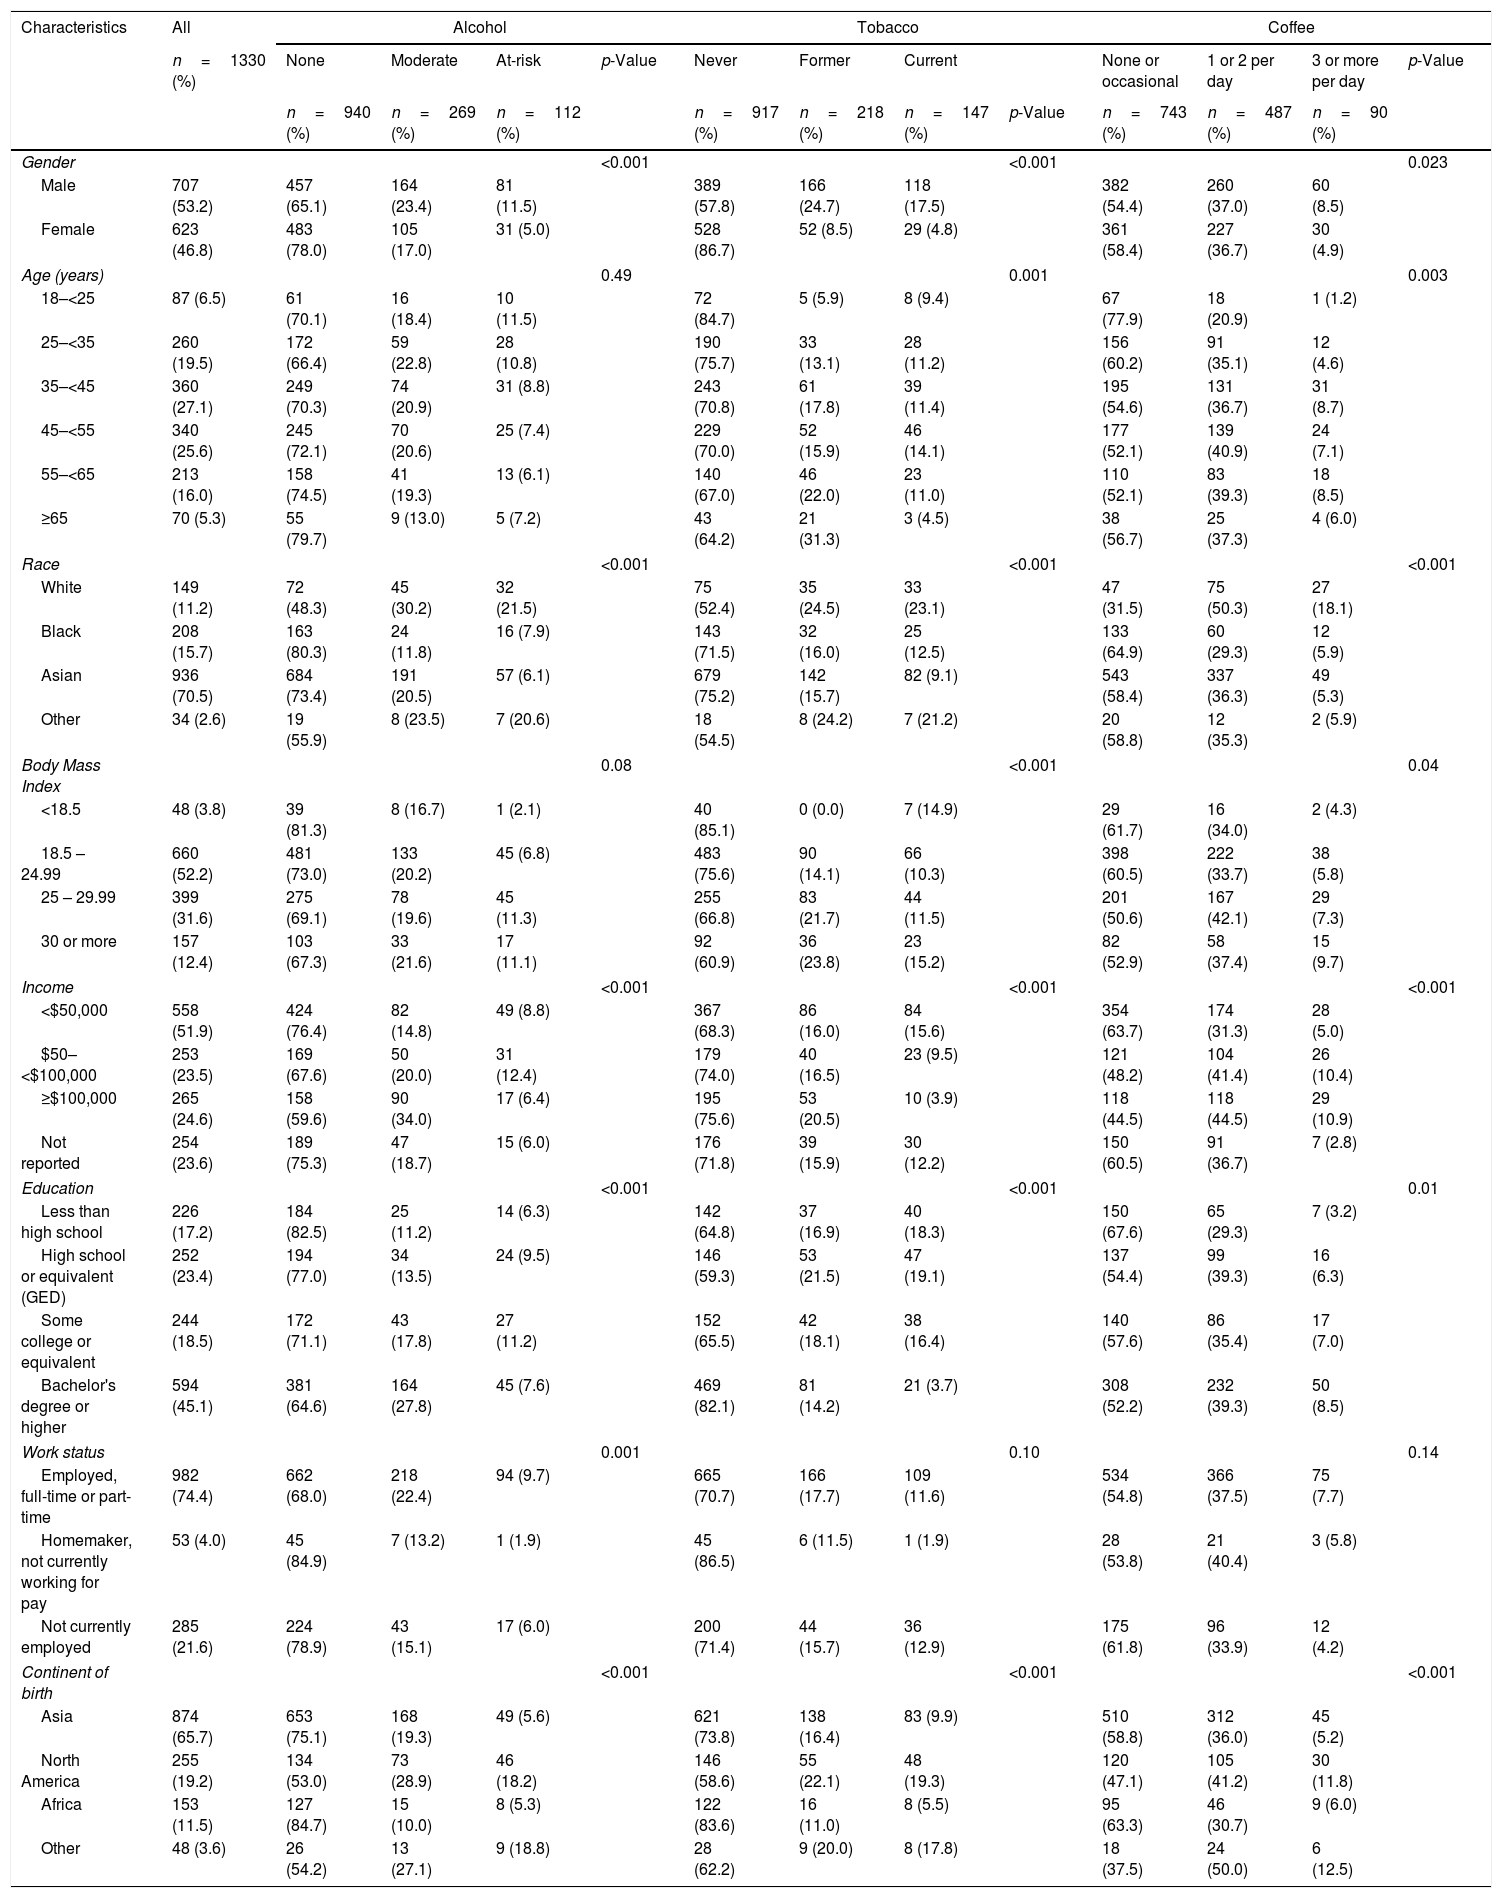
3Results3.1Baseline characteristicsA total of 1988 adult participants were enrolled in the adult HBRN cohort study between January 2011 and May 2016 (Fig. 1). For this analysis, participants were excluded if they had acute hepatitis B (n=55), were HBsAg negative at enrollment (n=11), were targeted specifically for enrollment in other HBRN clinical studies (n=336), were pregnant at baseline or during 144-weeks of follow-up, or received HBV antiviral therapy at any time during the study period (n=283). These exclusions resulted in a cohort of 1330 participants eligible for analysis. The cohort included 707 (53.2%) males, 936 (70.5%) Asians, 1075 (80.8%) foreign born, with a median age of 42 years (IQR: 34–52) (Table 1) (Appendix A shows characteristics of ineligible participants were similar to those included in this analysis). The median ALT level was 33U/L (IQR 22–50), 487 (36.6%) had an HBV DNA level <103IU/mL, 942 (70.8%) were HBeAg negative, and 868 (65.3%) had a FIB-4 score <1.45. The most common HBV genotypes were B (38.8%) and C (30.6%) reflecting the preponderance of Asian participants. With respect to socioeconomic factors, 558 (51.9%) of those reporting had an income of less than $50,000, 594 (45.1%) earned a bachelor's degree or higher education, and 982 (74.4%) participants were employed.

Baseline participant characteristics. Percentages under “All” shows the distribution of the characteristics in the cohort, whereas percentages under each behavior shows the distribution of that behavior across categories of the characteristics.
| Characteristics | All | Alcohol | Tobacco | Coffee | |||||||||
|---|---|---|---|---|---|---|---|---|---|---|---|---|---|
| n=1330 (%) | None | Moderate | At-risk | p-Value | Never | Former | Current | None or occasional | 1 or 2 per day | 3 or more per day | p-Value | ||
| n=940 (%) | n=269 (%) | n=112 (%) | n=917 (%) | n=218 (%) | n=147 (%) | p-Value | n=743 (%) | n=487 (%) | n=90 (%) | ||||
| Gender | <0.001 | <0.001 | 0.023 | ||||||||||
| Male | 707 (53.2) | 457 (65.1) | 164 (23.4) | 81 (11.5) | 389 (57.8) | 166 (24.7) | 118 (17.5) | 382 (54.4) | 260 (37.0) | 60 (8.5) | |||
| Female | 623 (46.8) | 483 (78.0) | 105 (17.0) | 31 (5.0) | 528 (86.7) | 52 (8.5) | 29 (4.8) | 361 (58.4) | 227 (36.7) | 30 (4.9) | |||
| Age (years) | 0.49 | 0.001 | 0.003 | ||||||||||
| 18–<25 | 87 (6.5) | 61 (70.1) | 16 (18.4) | 10 (11.5) | 72 (84.7) | 5 (5.9) | 8 (9.4) | 67 (77.9) | 18 (20.9) | 1 (1.2) | |||
| 25–<35 | 260 (19.5) | 172 (66.4) | 59 (22.8) | 28 (10.8) | 190 (75.7) | 33 (13.1) | 28 (11.2) | 156 (60.2) | 91 (35.1) | 12 (4.6) | |||
| 35–<45 | 360 (27.1) | 249 (70.3) | 74 (20.9) | 31 (8.8) | 243 (70.8) | 61 (17.8) | 39 (11.4) | 195 (54.6) | 131 (36.7) | 31 (8.7) | |||
| 45–<55 | 340 (25.6) | 245 (72.1) | 70 (20.6) | 25 (7.4) | 229 (70.0) | 52 (15.9) | 46 (14.1) | 177 (52.1) | 139 (40.9) | 24 (7.1) | |||
| 55–<65 | 213 (16.0) | 158 (74.5) | 41 (19.3) | 13 (6.1) | 140 (67.0) | 46 (22.0) | 23 (11.0) | 110 (52.1) | 83 (39.3) | 18 (8.5) | |||
| ≥65 | 70 (5.3) | 55 (79.7) | 9 (13.0) | 5 (7.2) | 43 (64.2) | 21 (31.3) | 3 (4.5) | 38 (56.7) | 25 (37.3) | 4 (6.0) | |||
| Race | <0.001 | <0.001 | <0.001 | ||||||||||
| White | 149 (11.2) | 72 (48.3) | 45 (30.2) | 32 (21.5) | 75 (52.4) | 35 (24.5) | 33 (23.1) | 47 (31.5) | 75 (50.3) | 27 (18.1) | |||
| Black | 208 (15.7) | 163 (80.3) | 24 (11.8) | 16 (7.9) | 143 (71.5) | 32 (16.0) | 25 (12.5) | 133 (64.9) | 60 (29.3) | 12 (5.9) | |||
| Asian | 936 (70.5) | 684 (73.4) | 191 (20.5) | 57 (6.1) | 679 (75.2) | 142 (15.7) | 82 (9.1) | 543 (58.4) | 337 (36.3) | 49 (5.3) | |||
| Other | 34 (2.6) | 19 (55.9) | 8 (23.5) | 7 (20.6) | 18 (54.5) | 8 (24.2) | 7 (21.2) | 20 (58.8) | 12 (35.3) | 2 (5.9) | |||
| Body Mass Index | 0.08 | <0.001 | 0.04 | ||||||||||
| <18.5 | 48 (3.8) | 39 (81.3) | 8 (16.7) | 1 (2.1) | 40 (85.1) | 0 (0.0) | 7 (14.9) | 29 (61.7) | 16 (34.0) | 2 (4.3) | |||
| 18.5 – 24.99 | 660 (52.2) | 481 (73.0) | 133 (20.2) | 45 (6.8) | 483 (75.6) | 90 (14.1) | 66 (10.3) | 398 (60.5) | 222 (33.7) | 38 (5.8) | |||
| 25 – 29.99 | 399 (31.6) | 275 (69.1) | 78 (19.6) | 45 (11.3) | 255 (66.8) | 83 (21.7) | 44 (11.5) | 201 (50.6) | 167 (42.1) | 29 (7.3) | |||
| 30 or more | 157 (12.4) | 103 (67.3) | 33 (21.6) | 17 (11.1) | 92 (60.9) | 36 (23.8) | 23 (15.2) | 82 (52.9) | 58 (37.4) | 15 (9.7) | |||
| Income | <0.001 | <0.001 | <0.001 | ||||||||||
| <$50,000 | 558 (51.9) | 424 (76.4) | 82 (14.8) | 49 (8.8) | 367 (68.3) | 86 (16.0) | 84 (15.6) | 354 (63.7) | 174 (31.3) | 28 (5.0) | |||
| $50–<$100,000 | 253 (23.5) | 169 (67.6) | 50 (20.0) | 31 (12.4) | 179 (74.0) | 40 (16.5) | 23 (9.5) | 121 (48.2) | 104 (41.4) | 26 (10.4) | |||
| ≥$100,000 | 265 (24.6) | 158 (59.6) | 90 (34.0) | 17 (6.4) | 195 (75.6) | 53 (20.5) | 10 (3.9) | 118 (44.5) | 118 (44.5) | 29 (10.9) | |||
| Not reported | 254 (23.6) | 189 (75.3) | 47 (18.7) | 15 (6.0) | 176 (71.8) | 39 (15.9) | 30 (12.2) | 150 (60.5) | 91 (36.7) | 7 (2.8) | |||
| Education | <0.001 | <0.001 | 0.01 | ||||||||||
| Less than high school | 226 (17.2) | 184 (82.5) | 25 (11.2) | 14 (6.3) | 142 (64.8) | 37 (16.9) | 40 (18.3) | 150 (67.6) | 65 (29.3) | 7 (3.2) | |||
| High school or equivalent (GED) | 252 (23.4) | 194 (77.0) | 34 (13.5) | 24 (9.5) | 146 (59.3) | 53 (21.5) | 47 (19.1) | 137 (54.4) | 99 (39.3) | 16 (6.3) | |||
| Some college or equivalent | 244 (18.5) | 172 (71.1) | 43 (17.8) | 27 (11.2) | 152 (65.5) | 42 (18.1) | 38 (16.4) | 140 (57.6) | 86 (35.4) | 17 (7.0) | |||
| Bachelor's degree or higher | 594 (45.1) | 381 (64.6) | 164 (27.8) | 45 (7.6) | 469 (82.1) | 81 (14.2) | 21 (3.7) | 308 (52.2) | 232 (39.3) | 50 (8.5) | |||
| Work status | 0.001 | 0.10 | 0.14 | ||||||||||
| Employed, full-time or part-time | 982 (74.4) | 662 (68.0) | 218 (22.4) | 94 (9.7) | 665 (70.7) | 166 (17.7) | 109 (11.6) | 534 (54.8) | 366 (37.5) | 75 (7.7) | |||
| Homemaker, not currently working for pay | 53 (4.0) | 45 (84.9) | 7 (13.2) | 1 (1.9) | 45 (86.5) | 6 (11.5) | 1 (1.9) | 28 (53.8) | 21 (40.4) | 3 (5.8) | |||
| Not currently employed | 285 (21.6) | 224 (78.9) | 43 (15.1) | 17 (6.0) | 200 (71.4) | 44 (15.7) | 36 (12.9) | 175 (61.8) | 96 (33.9) | 12 (4.2) | |||
| Continent of birth | <0.001 | <0.001 | <0.001 | ||||||||||
| Asia | 874 (65.7) | 653 (75.1) | 168 (19.3) | 49 (5.6) | 621 (73.8) | 138 (16.4) | 83 (9.9) | 510 (58.8) | 312 (36.0) | 45 (5.2) | |||
| North America | 255 (19.2) | 134 (53.0) | 73 (28.9) | 46 (18.2) | 146 (58.6) | 55 (22.1) | 48 (19.3) | 120 (47.1) | 105 (41.2) | 30 (11.8) | |||
| Africa | 153 (11.5) | 127 (84.7) | 15 (10.0) | 8 (5.3) | 122 (83.6) | 16 (11.0) | 8 (5.5) | 95 (63.3) | 46 (30.7) | 9 (6.0) | |||
| Other | 48 (3.6) | 26 (54.2) | 13 (27.1) | 9 (18.8) | 28 (62.2) | 9 (20.0) | 8 (17.8) | 18 (37.5) | 24 (50.0) | 6 (12.5) | |||
*Not all columns sum due to missing data.
At baseline, a total of 112 (8.4%) participants were at-risk alcohol users, 269 (20.2%) were moderate drinkers and 940 (70.7%) were categorized as non-drinkers. There were 147 (11.1%) current smokers, 218 (16.4%) former smokers and 917 (68.9%) never smokers. A total of 90 (6.8%) participants reported drinking 3 or more cups of coffee per day, 487 (36.6%) reported drinking 1–2 cups per day and 743 (55.9%) were none/occasional coffee drinkers.
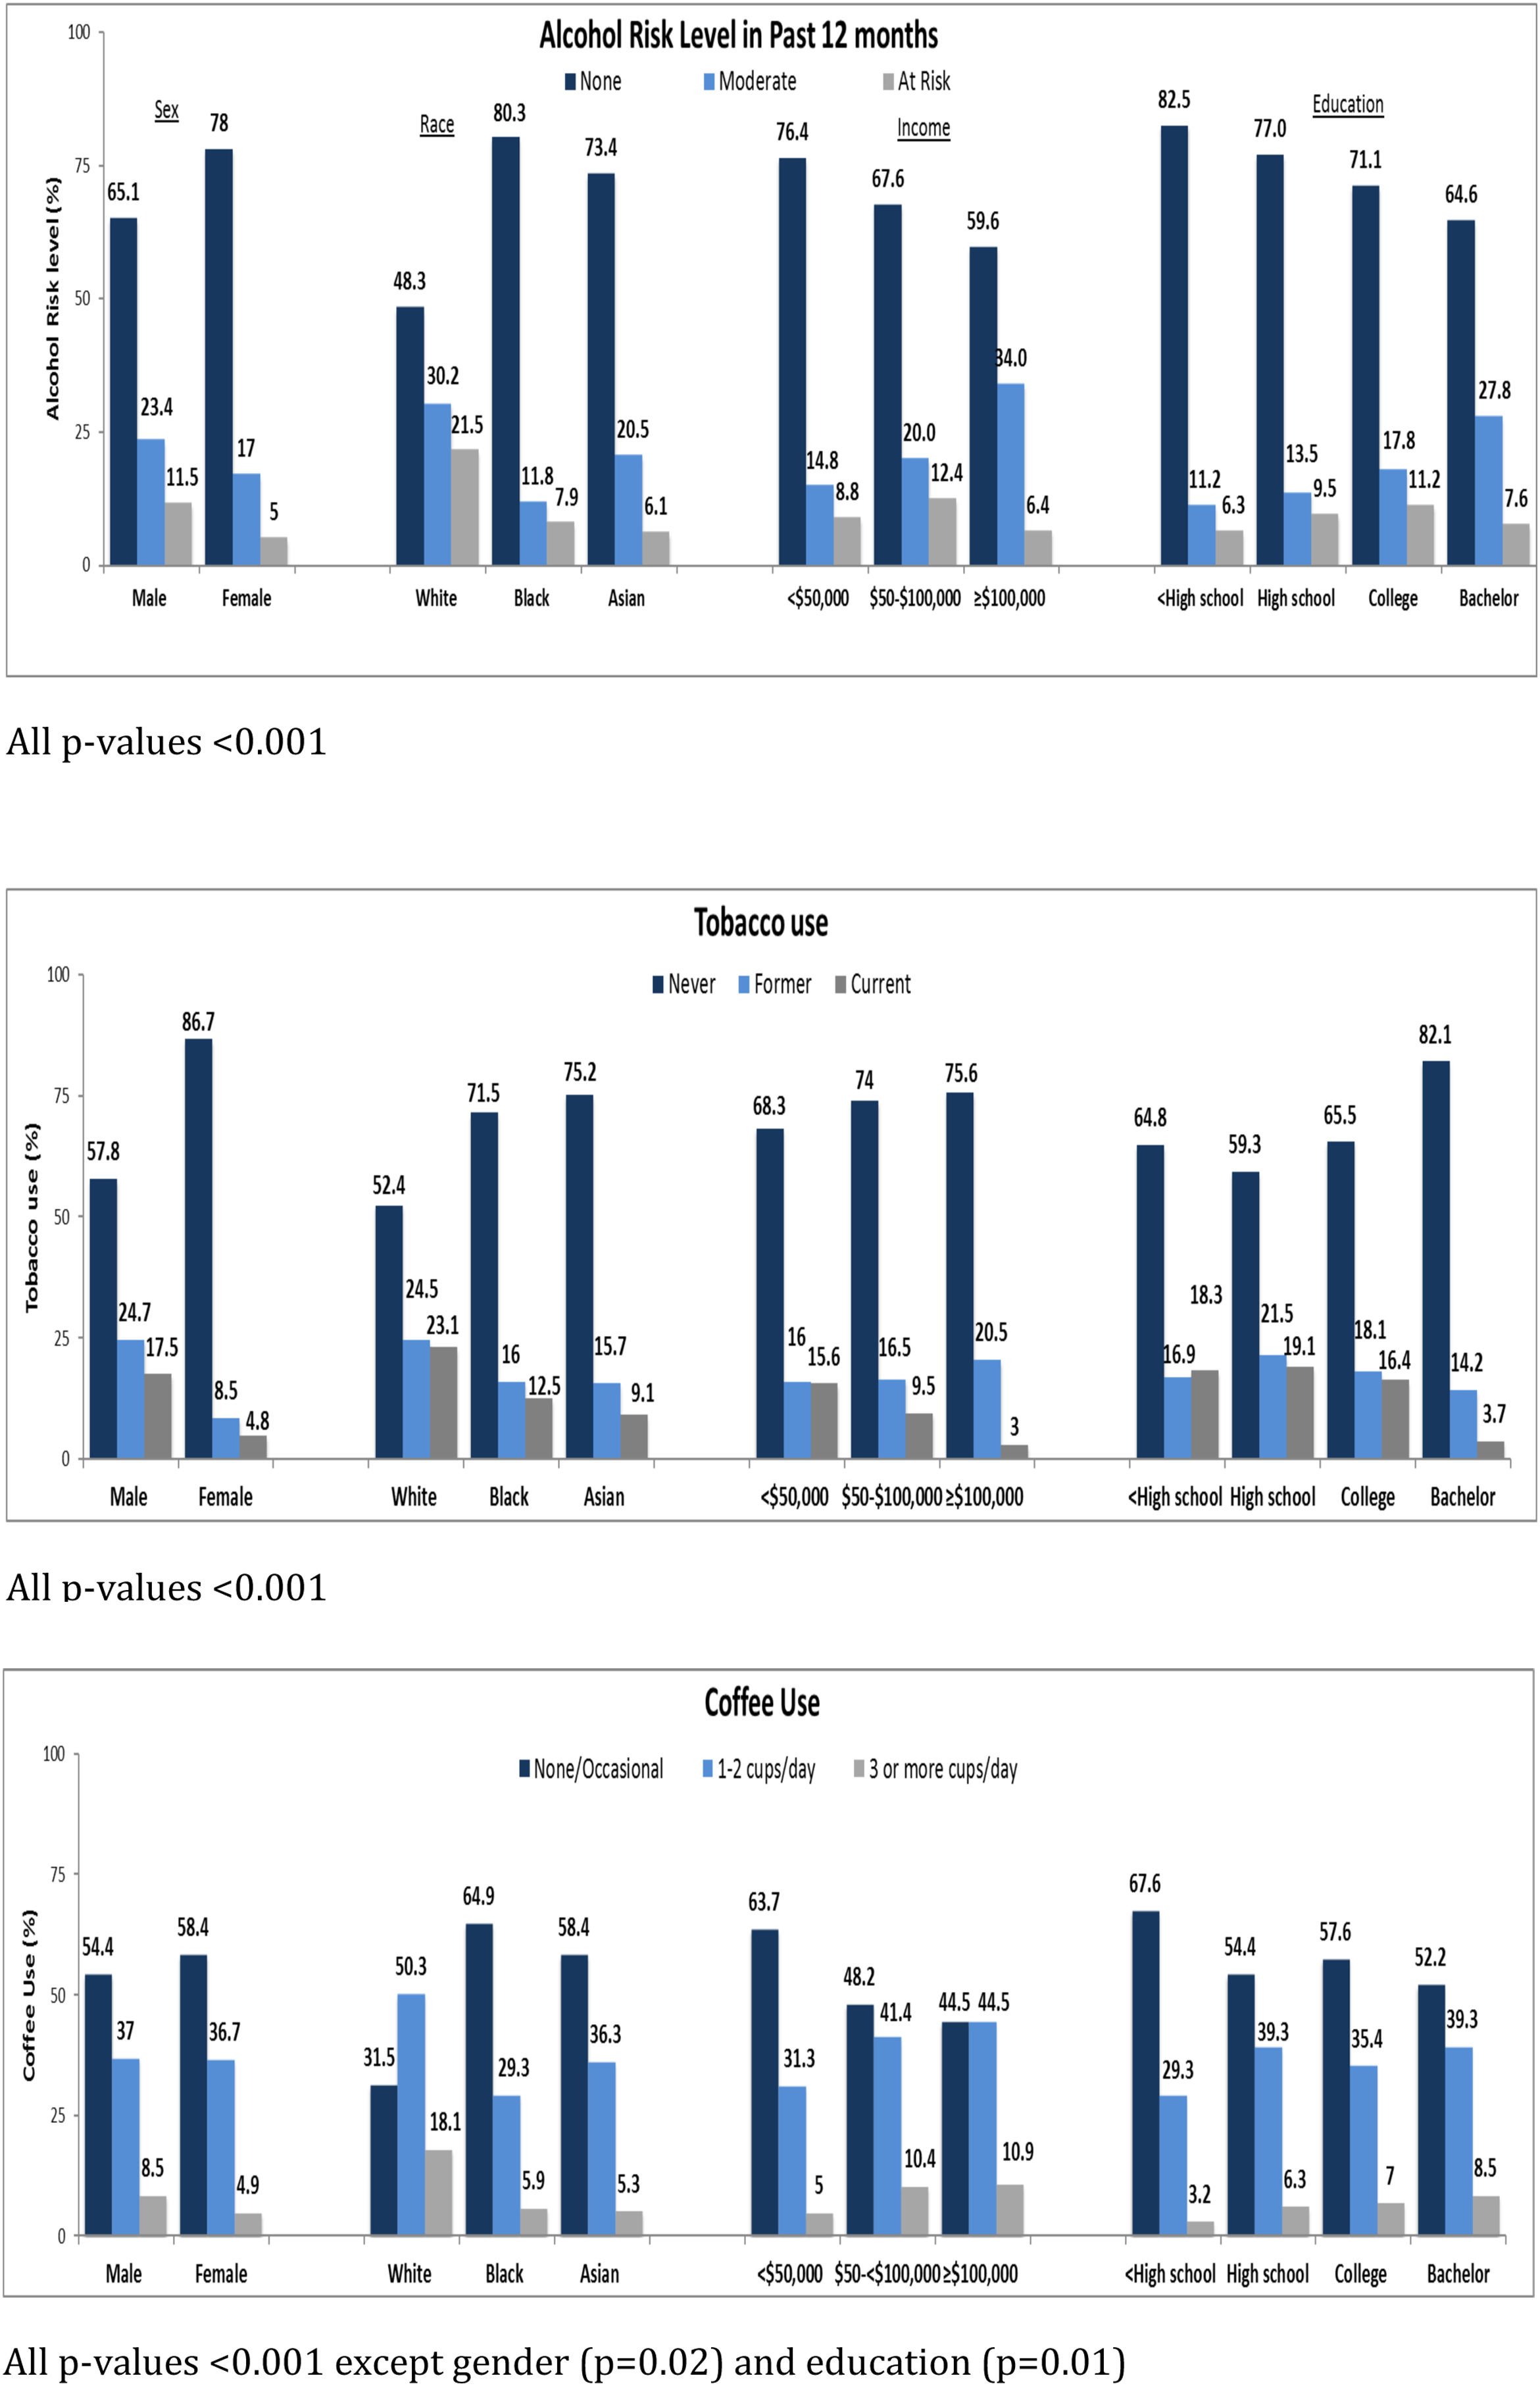
3.2Association of sociodemographic factors with lifestyle behaviorThe associations between sociodemographic factors and various lifestyle behaviors are summarized in Table 1 and Fig. 2A–C. Participants with CHB who were male, white, employed, with average annual income between $50,000 to $100,000, college educated, and born in North America were more likely to be at-risk alcohol drinkers. Participants who were male, between ages 45–<55, white, born in North America, had high school or lower education, with annual income <$50,000 were more likely to be current smokers. Participants who were male, aged 35–<45 years, white, born in North America, with annual income >$100,000, and college educated were more likely to drink 3 or more cups of coffee per day. Common to all three behaviors were male sex, white race, and born in North America. Tobacco use, in contrast to alcohol and coffee use, was more frequent in participants with lower education levels and lower annual incomes. Coffee consumption was more common in younger participants with higher annual incomes. These associations are similar to what has been found in other population-based surveys of lifestyle behaviors.
3.3Association of lifestyle behaviors with hepatitis B liver disease and viral markers
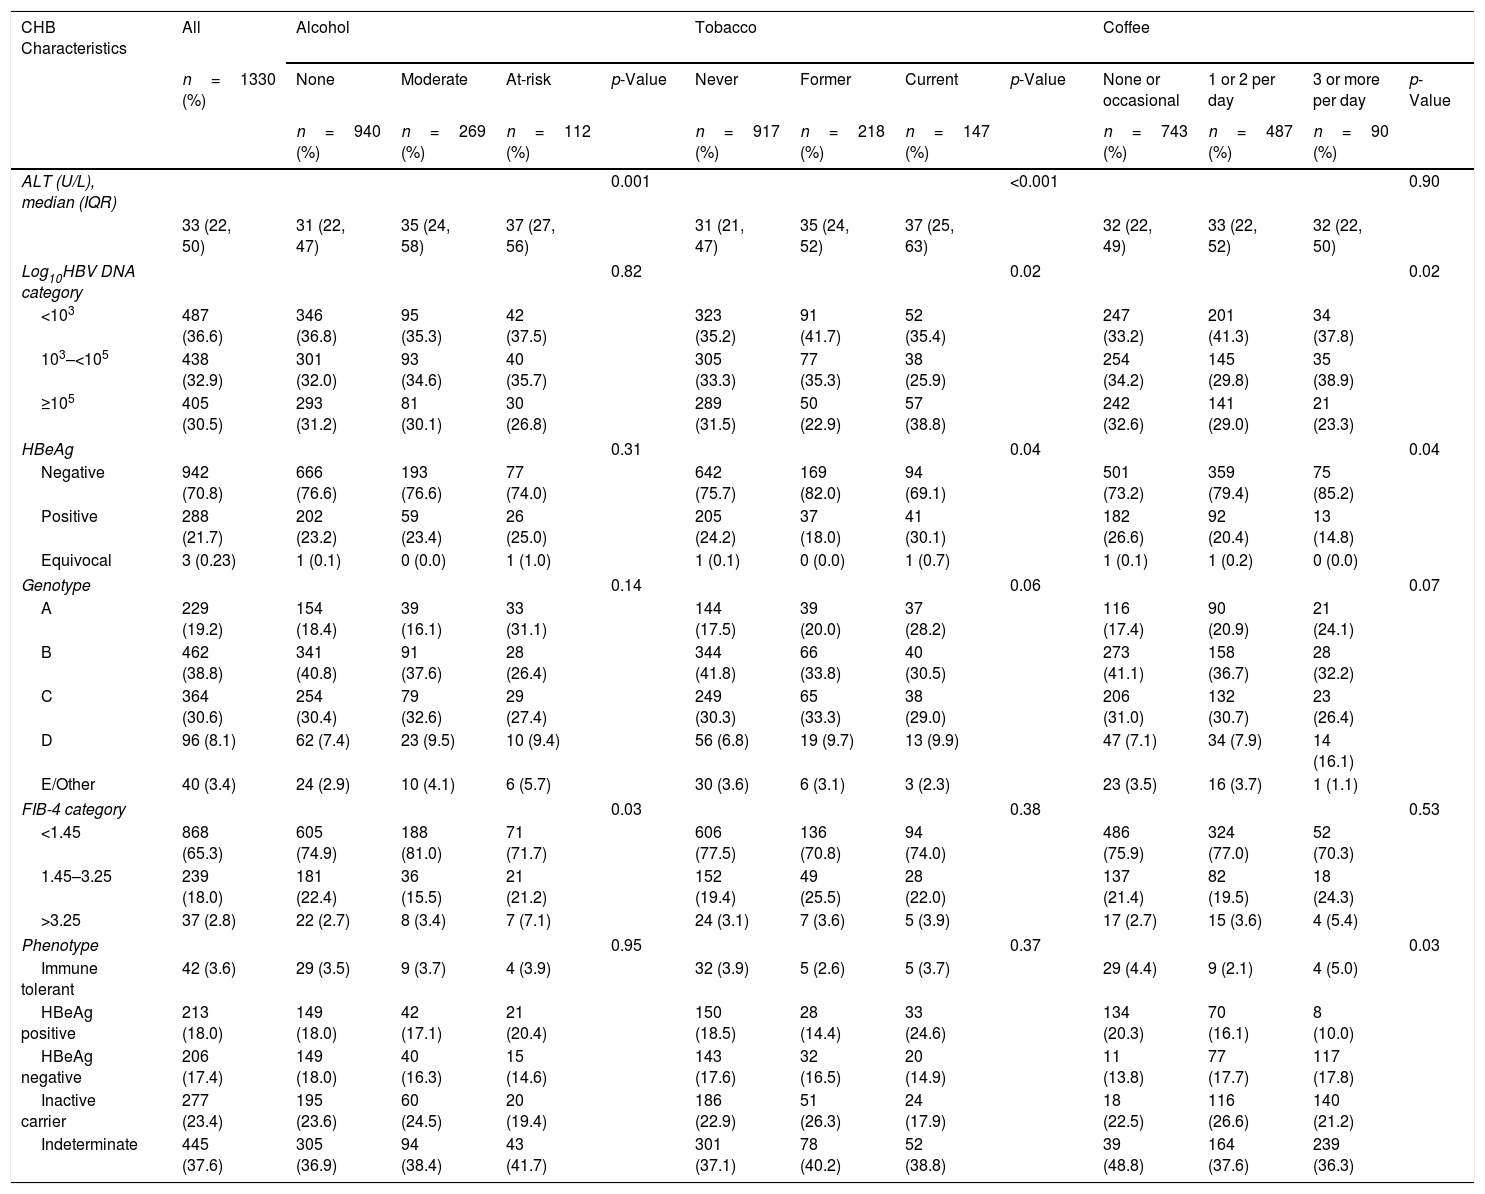
The association between lifestyle behaviors and liver disease parameters are shown in Table 2. Participants with at-risk alcohol use had higher baseline ALT levels [37 (IQR: 27–56) U/L] compared to participants with moderate alcohol use [35 (IQR: 24–58) U/L] or no alcohol use [31 (IQR: 22–47) U/L] and a higher proportion had FIB-4 values >3.25 (7.1% compared to 3.4% for moderate and 2.7% no alcohol use). Current smokers were also more likely to have higher ALT values [37 (IQR: 25–63) U/L] and also more likely to have higher HBV DNA levels (≥5logsIU/mL) (38.5%), and HBeAg positivity (30.1%) compared to former smokers [ALT 35 (IQR: 24–52) U/L; HBV DNA ≥5logsIU/mL (22.9%); positive HBeAg (18%)] and never smokers [ALT 31 (IQR: 21–47) U/L; HBV DNA ≥5logsIU/mL (31.5%); positive HBeAg (24.2%)]. Lastly, although there were no differences in ALT values at baseline among participants with different coffee consuming behaviors, there was a difference in HBV DNA levels and HBeAg status with more participants never or occasionally consuming coffee having HBV DNA ≥5logsIU/mL (32.6%) and positive HBeAg (26.6%) as compared to participants consuming 1 or 2 cup(s)/day (HBV DNA ≥5logsIU/mL (29.0%); positive HBeAg (20.4%)) and participants consuming >3cups/day (HBV DNA ≥5logsIU/mL (23.3%); positive HBeAg (14.8%)).
Baseline CHB Characteristics by behavior. Percentages under “All” column shows the distribution of the CHB characteristics in the whole cohort; percentages under each behavior shows the distribution of the characteristics across the categories of the behavior.
| CHB Characteristics | All | Alcohol | Tobacco | Coffee | |||||||||
|---|---|---|---|---|---|---|---|---|---|---|---|---|---|
| n=1330 (%) | None | Moderate | At-risk | p-Value | Never | Former | Current | p-Value | None or occasional | 1 or 2 per day | 3 or more per day | p-Value | |
| n=940 (%) | n=269 (%) | n=112 (%) | n=917 (%) | n=218 (%) | n=147 (%) | n=743 (%) | n=487 (%) | n=90 (%) | |||||
| ALT (U/L), median (IQR) | 0.001 | <0.001 | 0.90 | ||||||||||
| 33 (22, 50) | 31 (22, 47) | 35 (24, 58) | 37 (27, 56) | 31 (21, 47) | 35 (24, 52) | 37 (25, 63) | 32 (22, 49) | 33 (22, 52) | 32 (22, 50) | ||||
| Log10HBV DNA category | 0.82 | 0.02 | 0.02 | ||||||||||
| <103 | 487 (36.6) | 346 (36.8) | 95 (35.3) | 42 (37.5) | 323 (35.2) | 91 (41.7) | 52 (35.4) | 247 (33.2) | 201 (41.3) | 34 (37.8) | |||
| 103–<105 | 438 (32.9) | 301 (32.0) | 93 (34.6) | 40 (35.7) | 305 (33.3) | 77 (35.3) | 38 (25.9) | 254 (34.2) | 145 (29.8) | 35 (38.9) | |||
| ≥105 | 405 (30.5) | 293 (31.2) | 81 (30.1) | 30 (26.8) | 289 (31.5) | 50 (22.9) | 57 (38.8) | 242 (32.6) | 141 (29.0) | 21 (23.3) | |||
| HBeAg | 0.31 | 0.04 | 0.04 | ||||||||||
| Negative | 942 (70.8) | 666 (76.6) | 193 (76.6) | 77 (74.0) | 642 (75.7) | 169 (82.0) | 94 (69.1) | 501 (73.2) | 359 (79.4) | 75 (85.2) | |||
| Positive | 288 (21.7) | 202 (23.2) | 59 (23.4) | 26 (25.0) | 205 (24.2) | 37 (18.0) | 41 (30.1) | 182 (26.6) | 92 (20.4) | 13 (14.8) | |||
| Equivocal | 3 (0.23) | 1 (0.1) | 0 (0.0) | 1 (1.0) | 1 (0.1) | 0 (0.0) | 1 (0.7) | 1 (0.1) | 1 (0.2) | 0 (0.0) | |||
| Genotype | 0.14 | 0.06 | 0.07 | ||||||||||
| A | 229 (19.2) | 154 (18.4) | 39 (16.1) | 33 (31.1) | 144 (17.5) | 39 (20.0) | 37 (28.2) | 116 (17.4) | 90 (20.9) | 21 (24.1) | |||
| B | 462 (38.8) | 341 (40.8) | 91 (37.6) | 28 (26.4) | 344 (41.8) | 66 (33.8) | 40 (30.5) | 273 (41.1) | 158 (36.7) | 28 (32.2) | |||
| C | 364 (30.6) | 254 (30.4) | 79 (32.6) | 29 (27.4) | 249 (30.3) | 65 (33.3) | 38 (29.0) | 206 (31.0) | 132 (30.7) | 23 (26.4) | |||
| D | 96 (8.1) | 62 (7.4) | 23 (9.5) | 10 (9.4) | 56 (6.8) | 19 (9.7) | 13 (9.9) | 47 (7.1) | 34 (7.9) | 14 (16.1) | |||
| E/Other | 40 (3.4) | 24 (2.9) | 10 (4.1) | 6 (5.7) | 30 (3.6) | 6 (3.1) | 3 (2.3) | 23 (3.5) | 16 (3.7) | 1 (1.1) | |||
| FIB-4 category | 0.03 | 0.38 | 0.53 | ||||||||||
| <1.45 | 868 (65.3) | 605 (74.9) | 188 (81.0) | 71 (71.7) | 606 (77.5) | 136 (70.8) | 94 (74.0) | 486 (75.9) | 324 (77.0) | 52 (70.3) | |||
| 1.45–3.25 | 239 (18.0) | 181 (22.4) | 36 (15.5) | 21 (21.2) | 152 (19.4) | 49 (25.5) | 28 (22.0) | 137 (21.4) | 82 (19.5) | 18 (24.3) | |||
| >3.25 | 37 (2.8) | 22 (2.7) | 8 (3.4) | 7 (7.1) | 24 (3.1) | 7 (3.6) | 5 (3.9) | 17 (2.7) | 15 (3.6) | 4 (5.4) | |||
| Phenotype | 0.95 | 0.37 | 0.03 | ||||||||||
| Immune tolerant | 42 (3.6) | 29 (3.5) | 9 (3.7) | 4 (3.9) | 32 (3.9) | 5 (2.6) | 5 (3.7) | 29 (4.4) | 9 (2.1) | 4 (5.0) | |||
| HBeAg positive | 213 (18.0) | 149 (18.0) | 42 (17.1) | 21 (20.4) | 150 (18.5) | 28 (14.4) | 33 (24.6) | 134 (20.3) | 70 (16.1) | 8 (10.0) | |||
| HBeAg negative | 206 (17.4) | 149 (18.0) | 40 (16.3) | 15 (14.6) | 143 (17.6) | 32 (16.5) | 20 (14.9) | 11 (13.8) | 77 (17.7) | 117 (17.8) | |||
| Inactive carrier | 277 (23.4) | 195 (23.6) | 60 (24.5) | 20 (19.4) | 186 (22.9) | 51 (26.3) | 24 (17.9) | 18 (22.5) | 116 (26.6) | 140 (21.2) | |||
| Indeterminate | 445 (37.6) | 305 (36.9) | 94 (38.4) | 43 (41.7) | 301 (37.1) | 78 (40.2) | 52 (38.8) | 39 (48.8) | 164 (37.6) | 239 (36.3) | |||
*Not all columns sum due to missing data.
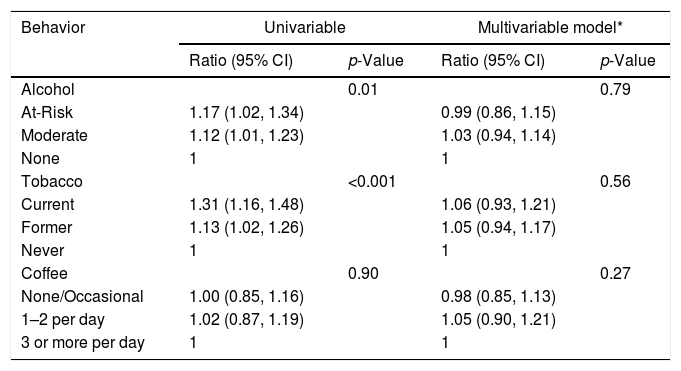
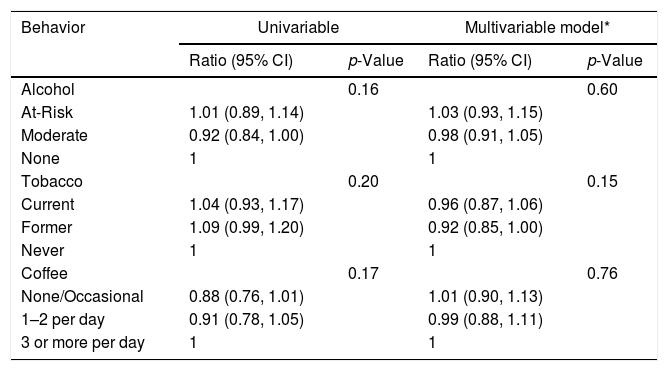
In univariable analysis, baseline ALT had statistically significant associations with alcohol (p=0.01) and tobacco (p<0.001) use as shown in Table 3A. At-risk alcohol users had 1.17 times (95% CI: 1.02–1.34) higher mean ALT levels compared to participants who did not use alcohol. Current tobacco smokers had 1.31 times (95% CI: 1.16–1.48) higher mean ALT levels compared to participants who never smoked. Coffee intake of ≥3cups/day showed no statistical association with ALT levels. Alcohol, tobacco and coffee use behaviors did not have statistically significant associations with FIB-4 values in univariable analysis (Table 3B).
Association between Lifestyle Behaviors and ALT at baseline.*
| Behavior | Univariable | Multivariable model* | ||
|---|---|---|---|---|
| Ratio (95% CI) | p-Value | Ratio (95% CI) | p-Value | |
| Alcohol | 0.01 | 0.79 | ||
| At-Risk | 1.17 (1.02, 1.34) | 0.99 (0.86, 1.15) | ||
| Moderate | 1.12 (1.01, 1.23) | 1.03 (0.94, 1.14) | ||
| None | 1 | 1 | ||
| Tobacco | <0.001 | 0.56 | ||
| Current | 1.31 (1.16, 1.48) | 1.06 (0.93, 1.21) | ||
| Former | 1.13 (1.02, 1.26) | 1.05 (0.94, 1.17) | ||
| Never | 1 | 1 | ||
| Coffee | 0.90 | 0.27 | ||
| None/Occasional | 1.00 (0.85, 1.16) | 0.98 (0.85, 1.13) | ||
| 1–2 per day | 1.02 (0.87, 1.19) | 1.05 (0.90, 1.21) | ||
| 3 or more per day | 1 | 1 | ||
Association between Lifestyle Behaviors and FIB-4 at baseline.*
| Behavior | Univariable | Multivariable model* | ||
|---|---|---|---|---|
| Ratio (95% CI) | p-Value | Ratio (95% CI) | p-Value | |
| Alcohol | 0.16 | 0.60 | ||
| At-Risk | 1.01 (0.89, 1.14) | 1.03 (0.93, 1.15) | ||
| Moderate | 0.92 (0.84, 1.00) | 0.98 (0.91, 1.05) | ||
| None | 1 | 1 | ||
| Tobacco | 0.20 | 0.15 | ||
| Current | 1.04 (0.93, 1.17) | 0.96 (0.87, 1.06) | ||
| Former | 1.09 (0.99, 1.20) | 0.92 (0.85, 1.00) | ||
| Never | 1 | 1 | ||
| Coffee | 0.17 | 0.76 | ||
| None/Occasional | 0.88 (0.76, 1.01) | 1.01 (0.90, 1.13) | ||
| 1–2 per day | 0.91 (0.78, 1.05) | 0.99 (0.88, 1.11) | ||
| 3 or more per day | 1 | 1 | ||
In multivariable analysis, however, neither baseline ALT or FIB-4 values were associated with lifestyle behaviors of alcohol, tobacco, and coffee use. Controlling for sex differences accounted for the majority of these discrepancies, in that men had higher ALT levels than women and were also more likely to be current smokers and heavy drinkers. When sex was controlled for, the associations were no longer present. Given the large number of Asians in our cohort, subgroup analyses were conducted in only these participants. Similar to the whole cohort, no statistically significant associations were found for any lifestyle behavior and ALT or FIB-4 values (Data not shown). Follow up values for ALT and FIB-4 were available on a subset of participants in this analysis. After adjusting for potential confounders, there were no significant associations of alcohol, tobacco and coffee use and ALT or FIB-4 values over the study period (Appendix BA–C, 3A–C).
4DiscussionUnderstanding the role of lifestyles behaviors in liver disease severity and progression is important for shaping counseling messages for patients. Alcohol use, smoking and coffee consumption are potential modifiable risks, and in this large, ethnically diverse North-American cohort of participants with CHB, 8.5% used alcohol at-risk levels, 11.5% were current smokers and 93.2% had <3 cups of coffee per day. Importantly, and in contrast with studies in other liver diseases, these lifestyle behaviors did not have statistically significant associations with CHB clinical disease markers after adjustment of sociodemographic characteristics.
Over half of the United States (US) population consumes alcohol leading to approximately 88,000 deaths and 2.5 million years of potential life lost each year in the US [14]. In our cohort 20.2% of participants consumed alcohol in the moderate category and 8.4% in the ‘at-risk’ category which is similar to the hepatitis C virus (HCV) infected population [15,16]. However, in contrast to HCV where at risk alcohol is a known risk factor for progressive liver disease and its complications, in our North American CHB cohort, at-risk or moderate alcohol use was not associated with markers of disease severity represented by ALT or FIB-4 values after adjusting for potential confounders [17,18]. This finding is also in contrast to reports from Asian studies where alcohol use has been associated with an increased risk of mortality and HCC in CHB [3,19–22]. Our findings may be related to the exclusion of patients with more advanced liver disease which is supported by the observation that only 2.8% of subjects had a FIB-4 score >3.25 consistent with advanced fibrosis or early cirrhosis. Furthermore, the use of HBV antiviral therapy when indicated during follow-up could have been a factor in the absence of disease progression.
Tobacco use remains the leading preventable cause of death in the US with approximately 20% of the population using tobacco products resulting in 443,000 deaths annually [23]. However, estimates of the rate of tobacco use in CHB participants are lacking and thus our cohort provides a glimpse of tobacco use and association with liver health in CHB infected individuals. We found that 11% of our participants currently used tobacco which is less than the general population and what has been reported in the HCV population (ranging from 25–56%) [24]. Although many of the harmful effects of tobacco are well known and been shown to promote fibrosis and development of HCC in HCV, its link to fibrosis and HCC may not be appreciated by providers and patients in the setting of HBV infection [25–27]. In our study, univariable analyses showed statistically significant associations of current tobacco use with ALT but these disappeared in multivariable analysis after controlling for other lifestyle behaviors, sociodemographic, and viral characteristics. Moreover, neither current nor previous tobacco use was associated with FIB-4 values. Our findings contrast with retrospective case-controlled studies in Asia showing tobacco use to be an independent risk factor for HCC development in CHB [28,29]. The differences between past studies and our current study may be explained by the study design (retrospective vs. prospective), length of follow-up period, and the exclusion of patients with advanced liver disease.
Coffee consumption (>3cups/day) has gained widespread attention for its protective effect in patients with chronic liver disease and has been inversely associated with progression of liver-disease among participants in the Hepatitis C Antiviral Long-Term Treatment against Cirrhosis (HALT-C) trial who had HCV related bridging fibrosis or cirrhosis [30–32]. However, the effect of coffee consumption in patients with CHB has not been well studied in a diverse population. In our cohort only 7% of participants reported drinking ≥3cup/day which may, in part, explain the inability to find an association on inflammatory or viral markers of CHB, which is consistent with the findings of Ong et al. showing that any amount of caffeine (coffee/tea/chocolate) intake did not affect liver stiffness in 1045 Asian patients with CHB after adjusting for confounders [33].
The strengths of our study include the large, racially diverse cohort of patients who were assessed at baseline in a standardized questionnaire and followed prospectively, thus the results seen in the study should have broad generalizability in contrast to previous retrospective studies of predominantly Asian cohorts. Moreover, although the findings differ from many previous reports on the effects of alcohol, smoking and coffee drinking, it needs to be stressed that the current analyses were unbiased and prospectively designed whereas most previous studies were retrospectively assembled and dealt with the separate effects of alcohol, tobacco or coffee on one or a few components of liver disease. However, the limitations of this study need to be considered. The cohort consisted of patients who were not being treated for CHB and thus consisted mostly of patients with mild or minimal disease. In addition, enrollment in a prospective observational study likely selects patients with concern about their health and may not engage in ‘at risk’ behavior. Nevertheless, after controlling for factors such as age, sex and race, no association was found between these lifestyle behaviors (current or former) and clinical features of CHB. The lack of associations largely applies to patients with mild or moderate CHB disease activity and stage. Patients with more advanced CHB might suffer adverse effects from moderate alcohol intake and tobacco use and may have benefit from coffee intake. None of these associations, however, have been clearly defined in prospective studies due to differing definitions of alcohol and tobacco, which are also often not reflective of cumulative amounts. Finally, the current analysis was based on the surrogate marker of ALT levels for CHB disease activity and FIB-4 values for CHB stage or fibrosis. While liver biopsies are not routinely done anymore, they would be considered the gold standard for measuring disease activity and stage. The long-term results from the prospective HBRN cohort may be able to address some of these issues, as these standard lifestyle questionnaires are used in all of these studies.
To conclude, in this large, racially diverse study of CHB participants from North America both socioeconomic and demographic factors were associated with alcohol, tobacco, and coffee use. However, in both cross-sectional and in limited longitudinal analyses, these lifestyle behaviors did not appear to be associated with the severity of the rate of progression of the liver disease throughout the study period.
Author's contributionStudy concept & design: MB, CY, DW, MK, ASL, HJ
Acquisition of data: MB, SL, ASW, CY, BH, ASL, HJ, NT
Analysis/interpretation: MB, CY, BH, SL, ASW, ASL, HJ
Drafting: MB, CY, BH, HJ
Critical review/revision: MB, CY, BH, ASW, ASL, HJ, MK, NT
Statistical analysis: SL, ASW, BH
FundingThe HBRN was funded as a Cooperative Agreement between the National Institute of Diabetes and Digestive and Kidney Diseases (NIDDK) to the following investigators: Lewis R. Roberts, MB, ChB, PhD (U01-DK082843), Anna Suk-Fong Lok, MD (U01-DK082863), Steven H. Belle, PhD, MScHyg (U01-DK082864), Kyong-Mi Chang, MD (U01-DK082866), Michael W. Fried, MD (U01-DK082867), Adrian M. Di Bisceglie, MD (U01-DK082871), William M. Lee, MD (U01-DK082872), Harry L. A. Janssen, MD, PhD (U01-DK082874), Daryl T-Y Lau, MD, MPH (U01-DK082919), Richard K. Sterling, MD, MSc (U01-DK082923), Steven-Huy B. Han, MD (U01-DK082927), Robert C. Carithers, MD (U01-DK082943), Norah A. Terrault, MD, MPH (U01-DK082944), an interagency agreement with NIDDK: Lilia M. Ganova-Raeva, PhD (A-DK-3002-001) and support from the intramural program, NIDDK, NIH: Marc G. Ghany, MD. Additional funding to support this study was provided to Kyong-Mi Chang, MD, the Immunology Center, (NIH/NIDDK Center of Molecular Studies in Digestive and Liver DiseasesP30DK50306, NIH Public Health Service Research Grant M01-RR00040), Richard K. Sterling, MD, MSc (UL1TR000058), NCATS (National Center for Advancing Translational Sciences, NIH), Norah A. Terrault, MD, MPH (CTSA Grant Number UL1TR000004), Michael W. Fried, MD (CTSA Grant Number UL1TR001111), and Anna Suk-Fong Lok (CTSA Grant Number UL1RR024986, U54TR001959.) Additional support was provided by Gilead Sciences, Inc. and Roche Molecular Systems via a CRADA through the NIDDK. Dr. Khalili, MD (U01-DK082944) who was also partially supported by K24AA022523.AbbreviationsCHB Chronic Hepatitis B Hepatitis B Research Network National Institute on Alcohol Abuse and Alcoholism alanine aminotransferase Hepatitis B virus Fibrosis-4 hepatocellular carcinoma National Institute of Diabetes and Digestive and Kidney Diseases human immunodeficiency virus United States Hepatitis C virus Hepatitis C Antiviral Long-Term Treatment against Cirrhosis
Dr. Janssen reports receiving consultant fees and/or grant support from Bristol Myers Squibb, Gilead Sciences, Novartis, Roche, and Merck. Dr. Lok reports receiving consultant fees and/or grant support from Gilead Sciences, GlaxoSmithKline, and from Bristol-Myers Squibb. Dr. Khalili reports receiving consultant fees and/or grant support from AbbVie, Gilead Sciences, Intercept Inc. Dr. Terrault reports receiving consultant fees and/or grant support from Gilead Sciences, AbbVie, Bristol-Myers Squibb, Merck, Novartis and Dynavax. Colina Yim reports receiving speaker honorarium from Gilead Sciences. Abdus Wahed, Stephen Liu, Junyao Wang, Bettina Hansen, and Dr's. Brahmania, Wong and Ghany report no potential conflict of interest relevant to this article.
The HBRN:Harvard Consortium: Daryl T-Y Lau, MD, MPH (Beth Israel Deaconess Medical Center, Boston, MA), Raymond T. Chung, MD (Massachusetts General Hospital, Boston, MA). Minnesota Alliance for Research in Chronic Hepatitis B Consortium: Lewis R. Roberts, MB, ChB, PhD (Mayo Clinic Rochester, Rochester, MN), Mohamed A. Hassan, MD (University of Minnesota, Minneapolis, MN). Midwest Hepatitis B Consortium: Adrian M. Di Bisceglie, MD, (Saint Louis University School of Medicine, St Louis, MO), Mauricio Lisker-Melman, MD (Washington University School of Medicine, St. Louis, MO). University of Toronto Consortium: Joshua Juan, MD (Toronto General Hospital, Toronto, Ontario), Jordan Feld, MD, MPH (Toronto General Hospital, Toronto, Ontario), Keyur Patel, MD (Toronto General Hospital, Toronto, Ontario). HBV CRN North Texas Consortium: William M. Lee, MD (Division of Digestive and Liver Diseases, University of Texas Southwestern Medical Center at Dallas, Dallas, TX), Carol S. Murakami, MD (Division of Digestive and Liver Diseases, University of Texas Southwestern Medical Center at Dallas, Dallas, TX), Robert Perrillo, MD, (Baylor University Medical Center, Dallas, TX), Son Do, MD (University of Texas Southwestern, Dallas, TX). Los Angeles Hepatitis B Consortium: Steven-Huy B. Han, MD (David Geffen School of Medicine, UCLA, Los Angeles, CA), Tram T. Tran, MD (Cedars Sinai Medical Center, Los Angeles, CA). San Francisco Hepatitis B Research Group Consortium: Stewart L. Cooper, MD (Division of General and Transplant Hepatology, California Pacific Medical Center, San Francisco, CA). Michigan Hawaii Consortium: Robert J. Fontana, MD (University of Michigan, Ann Arbor, MI), Naoky Tsai, MD (The Queen's Medical Center, University of Hawaii, Honolulu, HI), Barak Younoszai, DO (The Queen's Medical Center, University of Hawaii, Honolulu, HI). Chapel Hill, NC Consortium: Michael W. Fried, MD, (University of North Carolina at Chapel Hill, Chapel Hill, NC), Andrew Muir, M.D. (Duke University Medical Center, Durham, NC), Donna Evon, Ph.D. (University of North Carolina at Chapel Hill, Chapel Hill, NC), Jama M. Darling, MD (University of North Carolina at Chapel Hill, NC). PNW/Alaska Clinical CenterConsortium: Robert C. Carithers, MD (University of Washington Medical Center, Seattle WA), Margaret Shuhart, M.D. (Harborview Medical Center, Seattle WA), Kris V. Kowdley, MD (Virginia Mason Medical Center, Seattle WA), Chia C. Wang, MD (Virginia Mason Medical Center, Seattle WA). Virginia Commonwealth University Medical Center: Richard K. Sterling, MD, MSc (Virginia Commonwealth University Health System, Richmond, VA), Velimir A. Luketic, MD (Virginia Commonwealth University Health System, Richmond, VA). Liver Diseases Branch, NIDDK: T. Jake Liang, MD (National Institutes of Health, Bethesda, MD). Liver Disease Research Branch, NIDDK: Jay H. Hoofnagle, MD (National Institutes of Health, Bethesda, MD), Edward Doo, MD (National Institutes of Health, Bethesda, MD). Immunology Center: Kyong-Mi Chang, MD, (University of Pennsylvania Perelman School of Medicine, Philadelphia, PA), Jang-June Park, PhD (University of Pennsylvania Perelman School of Medicine, Philadelphia, PA). Data Coordinating Center: Steven H. Belle, PhD, MScHyg (Graduate School of Public Health, University of Pittsburgh, Pittsburgh, PA), Yona Cloonan, PhD (Graduate School of Public Health, University of Pittsburgh, Pittsburgh, PA). Central Pathology: David Kleiner, MD, PhD. (Center for Cancer Research, National Cancer Institute, NIH, Bethesda, MD).


