


COVID-19 caused by the SARS-CoV-2 continues to spread rapidly across the world. In our study, we aim to investigate the relationship between the liver enzymes on admission (AST, ALT, ALP, GGT) and severity of COVID-19. We evaluated course of disease, hospital stay, liver damage and mortality.
Materials and methodsOur study included 614 patients who were hospitalized with the diagnosis of COVID-19 between 03.16.20 and 05.12.20. Patients with liver disease, hematological and solid organ malignancy with liver metastases were excluded, resulting in 554 patients who met our inclusion criteria. We retrospectively evaluated liver transaminase levels, AST/ALT ratio, cholestatic enzyme levels and R ratio during hospital admission and these were compared in terms of morbidity, mortality and clinical course.
ResultsMean age of 554 subjects were 66.21±15.45 years, 328 (59.2%) were men. The mean values of liver enzymes on admission were AST (36.2±33.6U/L), ALT (34.01±49.34U/L), ALP (78.8±46.86U/L), GGT (46.25±60.05U/L). Mortality rate and need for intensive care unit were statistically significant in subjects that had high ALT–AST levels during their admission to the hospital (p=0.001). According to the ROC analysis AST/ALT ratio was a good marker of mortality risk (AUC=0.713: p=0.001) and expected probability of intensive care unit admission (AUC=0.636: p=0.001). R ratio, which was used to evaluate prognosis, showed a poor prognosis rate of 26.5% in the cholestatic injury group, 36.1% in the mixed pattern group and 30% in the hepato-cellular injury group (p 0.001).
ConclusionsALT–AST elevation and AST/ALT ratio >1 was associated with more severe course and increased mortality in COVID-19.
A novel type of coronavirus was identified after multiple unexplained cases of pneumonia in Wuhan on December 2019, declared a pandemic by the WHO on 12 March 2020 [1,2]. Since the first case was reported, many people have been infected and unfortunately many have died all over the world.
Patients infected with corona virus disease 2019 (COVID-19) are often admitted to the hospital with cough, shortness of breath, high fever, fatigue, and anosmia. Mortality is due to respiratory failure, for which the rate is approximately 2–3% [3,4].
Although the most important clinical manifestations are related to the lung injury, pathological clinical findings can also occur in other organs such as the liver, heart, pancreas and kidneys. This is likely due to multiple organs expressing the main viral entry receptor, called ACE2 receptor (Angiotensin-converting enzyme 2 receptor) [5,6]. Due to receptor distribution throughout the body, SARS-CoV-2 may infect hepatocytes and bile duct cells and cause the abnormal liver function seen in these patients [5,24].
The abnormality in liver function tests are particularly abnormal in severe COVID-19 cases, and the rate has previously been reported around 14–53%, most often in a hepatocellular pattern [7,8].
There are different mechanisms that result in liver damage in patients with COVID-19 infection. A liver biopsy from a case with COVID19 showed moderate microvesicular steatosis and mild lobular and portal activity, consistent with either direct viral infection or drug-induced liver injury; however, hepatocyte viral inclusions were not identified [9]. It has been reported that mortality and need for intensive care may be greater in those with severe liver disease [10–12].
Thus far cases of various liver pathologies have been reported, such as acute hepatitis, severe acute hepatitis, and acute-on-chronic liver failure. In this study, we retrospectively investigated liver enzymes on admission in SARS-CoV-2 infected patients from a single center in Istanbul Faculty of Medicine, Istanbul University and compared the clinical features, and clinical outcomes of COVID-19 patients with and without liver damage.
2Study design and settingThe study was designed as a single-center, retrospective study in the COVID Department of the Istanbul Faculty of Medicine, Istanbul University. Study protocols abided by ethical guidelines as stated in the World Medical Association (WMA) at the 64th WMA General Assembly, Fortaleza, Brazil, October 2013 were approved by the local institutional review board. (Registration number: 29624016-050.99-595)
3Materials and methods3.1Patients and dataThroughout March 16, 2020 and May 12, 2020, we retrospectively evaluated the data of 614 patients who had been hospitalized with COVID-19. According to inclusion criteria, a total of 604 patients with COVID-19 pneumonia were included in this study.
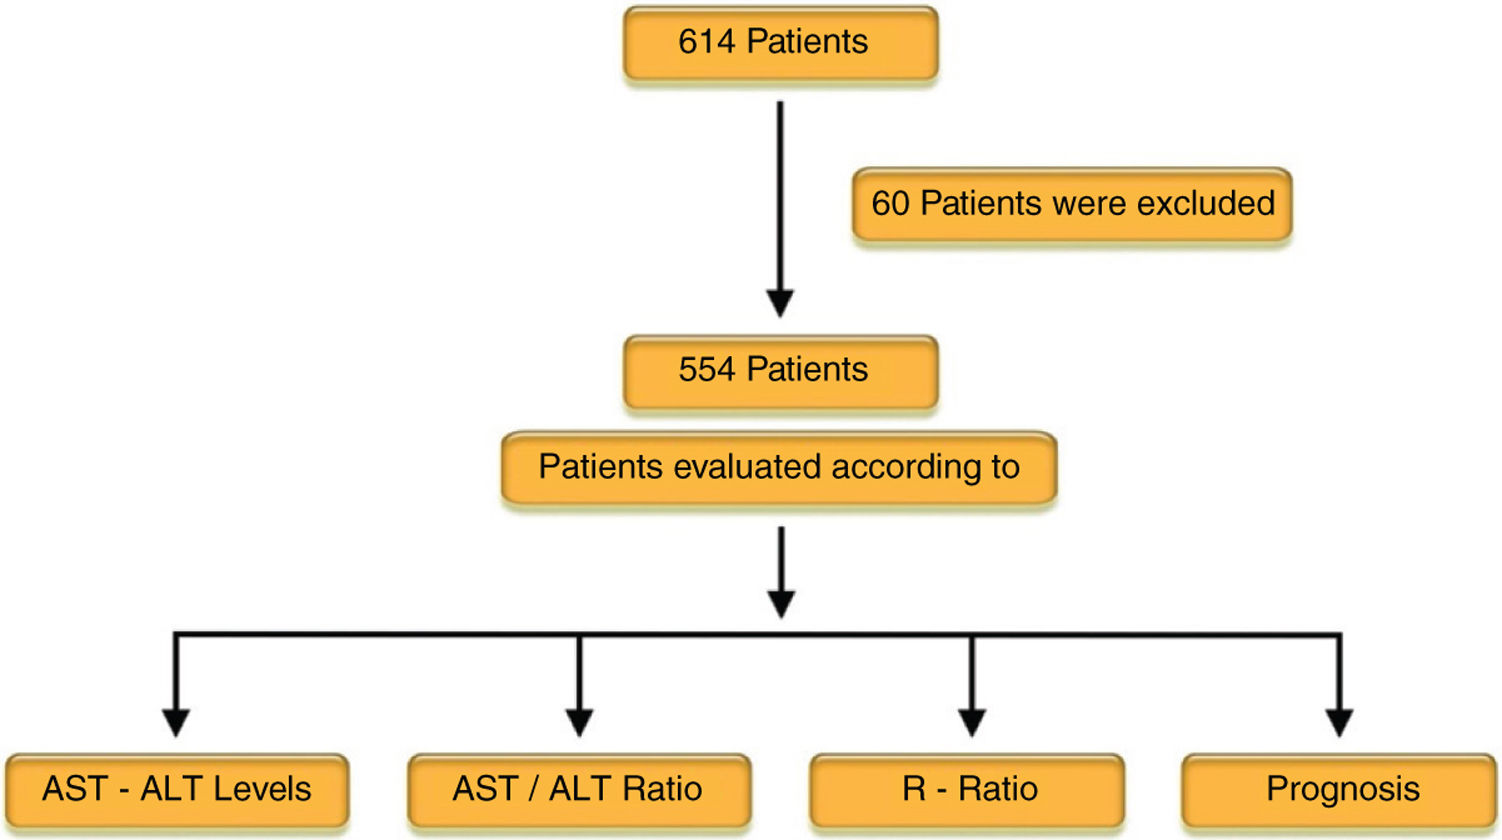
All patients had clinical manifestations including fever, respiratory symptoms and a diagnosis of pneumonia based on radiological findings. Patients with liver comorbidities, including hepatitis B virus (HBV), hepatitis C virus (HCV) co-infection, chronic alcohol consumption (>30g in men and 20g in women of pure alcohol per day), Wilson's disease, autoimmune hepatitis, other known liver disease and imaging or laboratory results that indicated cirrhosis and evidence of immune suppression, human immunodeficiency virus (HIV) co-infection, and patients diagnosed with malignancy (solitary or hematological) were excluded from the study (60 patients total) (Fig. 1).

Study design: 614 patients hospitalized with COVID-19 were evaluated and 60 patients with liver disease, hematological malignancy and solid organ malignancy with liver metastases were excluded from the study. 554 patients met our inclusion criteria. The prognoses were evaluated according to the AST–ALT levels, AST/ALT, and R ratio.
Patient demographics and laboratory findings were evaluated. Laboratory parameters were evaluated according to gender and age groups (<50, 50–65, >65). Epidemiological, clinical, laboratory characteristics, treatment, subjective and objective data were obtained by the hospitalization management system.
All subjects underwent serum biochemistry testing on admission, including alanine aminotransferase (ALT), aspartate aminotransferase (AST), alkaline phosphatase (ALP), gamma-glutamyl transpeptidase (GGT), lactate dehydrogenase (LDH), bilirubin, procalcitonin (PCT), ferritin, fibrinogen, aPTT (active Partial thromboplastin time), d-dimer, lactate, albumin, C-reactive protein (CRP) and complete blood counts. Enzyme linked immunosorbent assays (ELISA) were used to measure HBsAg, anti-HCV antibodies, and HIV.
Serum liver tests were considered abnormal if levels were above the following thresholds: ALT>40units/liter (U/L), AST>40U/L, GGT>85U/L, ALP>105U/L, and Total Billirubin (TBILI) >1.2mg/dl (13). ALP, GGT, value were evaluated for cholestatic liver injury if the ALP >1.5 ULN (upper limit of normal) and GGT >3 ULN (ALP 40–130IU/L, GGT 5–85IU/L) and increased aminotransferases were defined if ALT or AST >40IU/ml according to EASL (European Association for the Study of the Liver) guideline [13].
In these subjects, R ratio was calculated according to this formula; R=(ALT value/ALT ULN)/(ALP value/ALP ULN). The subjects were categorized to three groups according to the R ratio (<2, 2–5 and >5): cholestatic, mixed pattern and hepatocellular injury, respectively [13,14].
COVID-19 was diagnosed based on clinical manifestations, chest CT (Computed Tomography) or/and Reverse transcription polymerase chain reaction (RT-PCR) according to the WHO interim guidance and the New Coronavirus Pneumonia Prevention and Control Program (5th edition) published by the National Health Commission Health Commission of China [2,27].
The subjects were divided in mild and moderate-diffuse groups based on their CT findings. A CT arbitrary score was used separately according to the CT findings or images [15].
Study groups were stratified based on AST–ALT levels (<40 or >40), AST/ALT ratios (<1 or >1) and the R ratio. The prognoses were evaluated according to the AST–ALT levels, AST/ALT, and R ratio (Fig. 1).
A poor prognosis was determined according to intensive care admission, death and diffuse pneumonia.
3.2Treatment approachAll patients were isolated and placed on bed rest. They received supportive care including fluid replacement therapy, and all electrolyte imbalances were treated according to clinical situations.
Blood pressure, pulse and oxygen saturation were monitored twice a day and supplemental oxygen was given to hypoxemic patients.
Since there is no accepted antiviral treatment regimen, patients were treated with a combination of medicines consisting of hydroxychloroquine sulfate, azithromycin, favipravir, tocilizumab and anakinra. Drug choice was based on the medical team's decision and the patients’ clinical symptoms.
The specific treatment protocols were defined as Favipravir (1.6g orally twice daily on day 1, followed by 600mg orally twice daily for a total duration of 5 days) Tocilizumab (8mg/kg intravenously as a single dose) and Anakinra (100mg subcutaneously twice daily for 7 days) determined according to patients’ symptoms, hypoxemia, chest CT findings and acute phase reactants (CRP, Fibrinogen, Ferritin). Antibiotics were used if needed and this decision was based on the patients’ healthcare providers discretion.
3.3Statistical analysisQuantitative variables are expressed as mean ± standard deviation if they contain continuous data. If they contain categorical data, they are expressed as percentage (%) and frequency (n).
Comparison of qualitative variables was analyzed using the Pearson Chi square test.
The normal distribution, which was used to question the presence of parametric data in the data containing the measurement, was examined by Kolmogrov–Smirnov and Curtosis–Skewness Tests. Age showed normal distribution, which could be parametric. A Student's t-test was used to compare parameters including only age.
Kruskal–Wallis Test was used for the analysis of continuous and more than two independent non-parametric groups (Bonferroni correction was used when necessary) and Mann–Whitney Test was used for post-hoc analysis. Receiver Operating Characteristic (ROC) Curves Dependent groups were handled one by one, ROC curves were drawn and “Area Under the Curve”, “Sensitive (sens) and Specificity (spes) of Cut-Off Values” were shown. Additionally, the optimum cut-off point suggestions were given for the parameters. Patient data that exceeds the cut-off value indicates that it involves a high risk in that parameter. The closer the Area Under the Curve (AUC) value is to 100, the better the cut-off points are, in that regard. This study suggested that these cut-off values can be used for these parameters in healthcare facilities, which are considered to include practically similar patients. The results were evaluated in 95% confidence interval and statistical significance level was defined as p<0.05. The analyzes were performed using IBM SPSS-21 (Statistical Package for Social Sciences, Chicago, IL, USA).
4ResultsThe mean age of 554 COVID-19 subjects in our study was 66.21±15.45 years, with the youngest patient being 18 and our oldest 96 years old. 30.1% of patients were over the age of 65. A total of 328 (59.2%) patients were men. The mean body mass index was 29.39±4.71. The mean hospital stay of the patients was 16.87±11.6 days. There were 77 (13.9%) patients transferred to the intensive care unit and 40 (7.2%) patients died. The mean values of liver enzymes on admission were: AST (36.2±33.2U/L), ALT (34.01±49.34U/L), ALP (78.8±48.86U/L), and GGT (46.25±60.05U/L). The clinical and laboratory features of patients are shown in Tables 1 and 2.
Laboratory values of all patients on hospital admission (n: 554).
| Variables | Mean | SD | Min | Max |
|---|---|---|---|---|
| Hgb (g/dl) | 12.99 | 1.88 | 5.20 | 17.70 |
| Plt (108cell/μl) | 228.00 | 89.00 | 105.00 | 592.00 |
| Wbc (108cell/μl) | 7.12 | 3.41 | 1.28 | 28520.00 |
| Neut (108cell/μl) | 5.30 | 3.27 | 0.07 | 27.50 |
| Lymp (108cell/μl) | 1.22 | 6.32 | 0.10 | 6.64 |
| AST (IU/L) | 36.20 | 33.60 | 7.00 | 421.00 |
| ALT (IU/L) | 34.01 | 49.34 | 3.00 | 610.00 |
| GGT (IU/L) | 46.25 | 60.05 | 0.00 | 718.00 |
| ALP (IU/L) | 78.80 | 46.86 | 19.00 | 662.00 |
| LDH (IU/L) | 282.95 | 131.76 | 130.00 | 1664.00 |
| Albumin (g/dl) | 3.95 | .53 | 1.50 | 5.10 |
| CRP (mg/L) | 66.10 | 69.73 | 1.00 | 460.00 |
| Procalsitonin (ng/ml) | 0.56 | 3.68 | 0.02 | 57.00 |
| Ferritin (mg/dl) | 700.45 | 3698.32 | 6.00 | 85616.00 |
| d-Dimer (μg/L) | 1446.90 | 2281.12 | 210.00 | 20000.00 |
| Fibrinogen (mg/dl) | 531.88 | 139.13 | 34.00 | 1085.00 |
| aPTT (s) | 29.65 | 4.99 | 13.00 | 65.00 |
| T Bil (mg/dL) | 0.53 | 0.61 | 0.07 | 5.45 |
| D Bil (mg/dL) | 0.24 | 0.30 | 0.01 | 2.78 |
| CT arbitrary score | 3.04 | 1.58 | 0.00 | 7.00 |
aPTT (s): active partial thromboplastin time.
Displayed in this table are the mean, SD, minimum and maximum laboratory values. In addition to this, CT arbitrary scores, established via CT findings of pneumonia severity, are also shown.
Clinical data in all groups (n: 554).
| Variables | n | % | |
|---|---|---|---|
| Age group | <50 | 206 | 37.2 |
| 50–6465 and (+) | 181167 | 32.730.1 | |
| Intensive care unit | (+) | 77 | 13.9 |
| (−) | 477 | 86.1 | |
| Mortality | (+) | 40 | 7.2 |
| (−) | 514 | 92.8 | |
| Fever | (+) | 381 | 69.0 |
| (−) | 171 | 31.0 | |
| Cough | (+) | 447 | 81.0 |
| (−) | 105 | 19.0 | |
| Dyspnea | (+) | 242 | 43.8 |
| (−) | 310 | 56.2 | |
| Fatigue, myalgia | (+) | 475 | 86.1 |
| (−) | 77 | 13.9 | |
| Diarrhea | (+) | 67 | 12.7 |
| (−) | 459 | 87.3 | |
| Anosmia | (+) | 42 | 8.0 |
| (−) | 484 | 92.0 | |
| Hypertension | (+) | 223 | 40.6 |
| (−) | 326 | 59.4 | |
| ARB | (+) | 101 | 45.5 |
| (−) | 121 | 54.5 | |
| ACEi | (+) | 55 | 24.8 |
| (−) | 167 | 75.2 | |
| ARB and ACEi | (+) | 11 | 5.0 |
| (−) | 211 | 95.0 | |
| Diabetes mellitus | (+) | 125 | 22.7 |
| (−) | 426 | 77.3 | |
| Asthma or COPD | (+) | 79 | 14.3 |
| (−) | 472 | 85.7 | |
| Coronary artery disease | (+) | 61 | 11.1 |
| (−) | 490 | 88.9 | |
| Heart failure | (+) | 38 | 6.9 |
| (−) | 513 | 93.1 |
ACE2: angiotensin-converting enzyme 2, ARBs: angiotensin receptor blockers. In addition to the demographic data of patients, and their complaints during the hospital admission, their pre-existing conditions (and medication history) have been included in this table.
During the first application to the hospital, increased aminotransferase group (n: 153/554) (ALT or AST were above >40IU/L) was 153 patients (27.6%) (Table 4). The rate of alkaline phosphatase or GGT elevation was 4% (Table 9).
In patients with increased aminotransferase levels, we detected statistically significant, increased levels of procalcitonin, CRP, ferritin, fibrinogen, d-dimer, lactate and TBILI. In addition, the period of hospital stay was longer in these patients (p=0.048). Albumin and lymphocyte values were statistically significant and lower in these patients. The age distribution of both groups was not significantly different (Table 3).
Comparison of patients with elevated and normal AST–ALT values.
| Variables | AST–ALT≤40 (n=401) mean±sd | AST–ALT>40 (n=153) mean±sd | p |
|---|---|---|---|
| AST (IU/L) | 23.86±7.15 | 68.55±50.15 | 0.001 |
| ALT (IU/L) | 19.87±8.40 | 71.08±82.23 | 0.001 |
| ALP (IU/L) | 74.67±34.57 | 89.57±68.45 | 0.066 |
| GGT (IU/L) | 34.66±42.09 | 76.61±84.57 | 0.001 |
| LDH (IU/L) | 251.96±84.17 | 363.96±187.93 | 0.001 |
| Albumin (g/dl) | 3.98±0.52 | 3.85±0.54 | 0.007 |
| CRP (mg/L) | 56.52±58.86 | 91.24±87.72 | 0.001 |
| Procalsitonin (ng/ml) | 0.22±0.89 | 1.46±6.80 | 0.001 |
| Ferritin (mg/dl) | 448.46±713.24 | 1365.25±6931.00 | 0.001 |
| d-Dimer (μg/L) | 1260.10±1992.92 | 1936.48±2854.12 | 0.001 |
| Fibrinogen (mg/dl) | 521.54±131.28 | 557.58±155.33 | 0.003 |
| aPTT (s) | 29.54±4.96 | 29.96±5.08 | 0.260 |
| Lymp (108cell/μl) | 1.26±0.65 | 1.13±0.56 | 0.015 |
| Wbc(108cell/μl) | 7.08±3.50 | 7.24±3.19 | 0.378 |
| Lactate (mmol/L) | 1.73±1.33 | 2.16±1.74 | 0.005 |
| Hgb (g/dl) | 12.84±1.93 | 13.37±1.69 | 0.006 |
| Total bilirubin (mg/dl) | 0.41±0.22 | 0.84±1.05 | 0.001 |
| Direct bilirubin (mg/dl) | 0.22±0.27 | 0.28±0.35 | 0.001 |
| Age | 57.01±15,58 | 56.41±16.48 | 0.237 |
| BMI | 29,20±4,71 | 29,88±4,67 | 0,349 |
| Hospitalization days | 8,87±5,92 | 10,76±8,39 | 0.048 |
aPTT(s): active partial thromboplastin time.
BMI: body mass index.
p value was obtained using the Mann–Whitney U test. Statistical significance level is defined as p<0.05.
In patients with AST/ALT>40 on admission; we detected higher levels of procalcitonin, C-reactive protein, ferritin, fibrinogen, d-dimer, lactate and total bilirubin, which were statistically significant. In addition, the period of hospital stay was longer in this group of patients (p=0.048). Albumin and lymphocyte values were statistically significantly lower in these patients. The age distribution of both groups was not significantly different.
The rates of specific treatment for individuals who had increased AST–ALT levels (58.2%) were observed to be higher than those with normal AST–ALT levels (33.9%) (p=0.001) (Table 4).
Comparison of patients with elevated and normal AST–ALT values.
| AST–ALT≤40 | AST–ALT>40 | p | ||||
|---|---|---|---|---|---|---|
| n (401) | % | n (153) | % | |||
| Specific treatment | Yes | 136 | 33.9 | 89 | 58.2 | 0.001 |
| No | 265 | 66.1 | 64 | 41.8 | ||
| Chest computed tomography | Mild | 222 | 56.6 | 55 | 36.2 | 0.001 |
| Moderate | 170 | 43.4 | 97 | 63.8 | ||
| Diffuse | ||||||
| Mortality | Yes | 19 | 4.7 | 21 | 13.7 | 0.001 |
| No | 382 | 95.3 | 132 | 86.3 | ||
| Intensive care unit | Yes | 42 | 10.5 | 35 | 22.9 | 0.001 |
| No | 359 | 89.5 | 118 | 77.1 | ||
| Fever | Yes | 267 | 66.6 | 114 | 75.5 | 0.044 |
| No | 134 | 33.4 | 37 | 24.5 | ||
| Dyspnea | Yes | 166 | 41.4 | 76 | 50.3 | 0.059 |
| No | 235 | 58.6 | 75 | 49.7 | ||
| Diarrhea | Yes | 51 | 13.1 | 16 | 11.6 | 0.639 |
| No | 337 | 86.9 | 122 | 88.4 | ||
| Anosmia | Yes | 34 | 8.8 | 8 | 5.8 | 0.270 |
| No | 394 | 91.2 | 147 | 94.2 | ||
p value was obtained using the Mann–Whitney U test. Statistical significance level is defined as p<0.05.
The rates of specific treatment, the presence of moderate and severe pneumonia according to CT findings, the mortality rate, and intensive care unit hospitalization for individuals who had AST–ALT levels >40 were observed to be higher than those with normal AST–ALT levels.
The rates of intensive care unit hospitalization (22.9%) in individuals with increased AST–ALT levels were observed to be higher compared to those with normal AST and ALT (10.5%) (p=0.001) (Table 4).
Moderate and severe pneumonia according to CT findings were observed in the elevated aminotransferases group (63.8%) compared to the normal aminotransferases group (43.8%) (p=0.001) (Table 4).
The rate of mortality was higher in the elevated aminotransferases group (13.7%) compared to the normal aminotransferases group (4.7%) (p=0.001) (Table 4).
Clinical and laboratory data was compared based on gender. Mean AST, ALT, GGT and TBILI levels were statistically significantly higher in men compared to women (Table 5).
Comparison of laboratory findings according to gender.
| Variables | Male (n=328)Mean±sd | Female (n=226)Mean±sd | p |
|---|---|---|---|
| AST (IU/L) | 39.89±39.72 | 30.85±20.77 | 0.001 |
| ALT (IU/L) | 40.07±60.17 | 25.23±24.29 | 0.001 |
| ALP (IU/L) | 79.57±49.94 | 77.65±42.07 | 0.702 |
| GGT (IU/L) | 54.50±70.08 | 34.28±38.30 | 0.001 |
| LDH (IU/L) | 291.88±150.33 | 270.03±97.80 | 0.379 |
| Total bilirubin (mg/dl) | 0.60±0.72 | 0.42±0.37 | 0.016 |
| Direct bilirubin (mg/dl) | 0.27±0.36 | 0.20±0.18 | 0.195 |
p value was obtained using the Mann–Whitney U test. Statistical significance level is defined as p<0.05.
Mean AST, ALT, GGT and total bilirubin levels were significantly higher in men compared to women.
Subjects were divided into two groups according to whether the AST/ALT ratio was greater than 1. 53.0% of the patients who had AST/ALT ratio >1 were male (p=0.001) (Table 7).
Subjects with increased AST/ALT ratio >1 had a statistically significant increased levels of LDH, CRP, aPTT, fibrinogen, and d-dimer. In the group of AST/ALT ratio >1 the GGT, albumin and lymphocyte levels were lower than the group of AST/ALT ratio <1 (Table 6). Several studies have suggested that low albumin levels on hospital admission can be used as a marker of severity of COVID-19 [25,26].
Patients with AST/ALT ratio less than or greater than 1.
| Variables | <1 (n=173)Mean±sd | >1 (n=381)Mean±sd | p |
|---|---|---|---|
| AST (IU/L) | 41.24±47.94 | 33.92±24.183 | 0.099 |
| ALT (IU/L) | 56.83±79.38 | 23.66±18.61 | 0.001 |
| ALP (IU/L) | 85.22±53.58 | 75.87±43.23 | 0.054 |
| GGT (IU/L) | 65.62±76.62 | 37.45±48.30 | 0.001 |
| LDH (IU/L) | 259.99±118.16 | 293.40±136.38 | 0.001 |
| Albumin (g/dl) | 4.09±0.56 | 3.88±0,50 | 0.001 |
| CRP (mg/L) | 56.55±64.73 | 70.45±71.54 | 0.001 |
| Fibrinogen (mg/dl) | 514.53±144.96 | 539.20±135.90 | 0.042 |
| d-Dimer (μg/L) | 1307.21±2126.50 | 1510.33±2347.93 | 0.009 |
| aPTT (s) | 28.48±4.37 | 30.18±5.16 | 0.001 |
| Lymp (108cell/μl) | 1.30±0.63 | 1.19±0.63 | 0.028 |
| Hgb (g/dl) | 13.46±1.71 | 12.77±1.92 | 0.001 |
| BMI | 29.63±4.51 | 29.29±4.79 | 0.261 |
| Hospitalization days | 8.90±6.41 | 9.61±6.88 | 0.209 |
p value was obtained using the Mann–Whitney U test. Statistical significance level is defined as p<0.05.
Subjects with AST/ALT ratio above 1 had a significantly increased levels of LDH, CRP, aPTT, fibrinogen, d-dimer. In the group of AST/ALT ratio >1 the GGT, albumin and lymphocyte levels were lower than the group of AST/ALT ratio < 1.
In the AST/ALT >1 group, the rates of intensive care unit admission (16%) are higher than in the AST/ALT <1 group (9.2%) (p=0.033). Additionally, in the AST/ALT> 1 (52.5%) group, the severity of pneumonia is higher than the AST/ALT <1 (41.4%) group (p=0.016) (Table 7).
Patients with AST/ALT ratio less than and greater than 1.
| AST/ALT | p | |||||
|---|---|---|---|---|---|---|
| <1 | >1 | |||||
| n (173) | % | n (381) | % | |||
| Gender | Male | 126 | 72.8 | 202 | 53.0 | 0.001 |
| Female | 47 | 27.2 | 179 | 47.0 | ||
| Age group | <50 | 79 | 45.7 | 127 | 33.3 | |
| 50–64 | 54 | 31.2 | 127 | 33.3 | 0.003 | |
| >65 | 40 | 23.1 | 127 | 33.3 | ||
| Specific treatment | Yes | 70 | 40.5 | 155 | 40.7 | 0.961 |
| No | 103 | 59.5 | 226 | 59.3 | ||
| Chest computed tomography | Mild | 99 | 58.6 | 178 | 47.5 | 0.016 |
| Moderate | 70 | 41.4 | 197 | 52.5 | ||
| Diffuse | ||||||
| Mortality | Yes | 6 | 3.5 | 34 | 8.9 | 0.059 |
| No | 167 | 96.5 | 347 | 91.1 | ||
| Intensive care unit | Yes | 16 | 9.2 | 61 | 16.0 | 0.033 |
| No | 157 | 90.8 | 320 | 84.0 | ||
| Dyspnea | Yes | 69 | 40.1 | 173 | 45.5 | 0.235 |
| No | 103 | 59.9 | 207 | 54.5 | ||
| Diarrhea | Yes | 23 | 13.9 | 44 | 12.2 | 0.602 |
| No | 143 | 86.1 | 316 | 87.8 | ||
| Anosmia | Yes | 12 | 7.2 | 30 | 8.3 | 0.664 |
| No | 154 | 92.8 | 330 | 91.7 | ||
p value was obtained using the Mann–Whitney U test. Statistical significance level is defined as p<0.05.
In the AST/ALT>1 group, the rates of intensive care unit admission and the severity of pneumonia (evaluated by Chest CT findings) were higher than the AST/ALT<1 group.
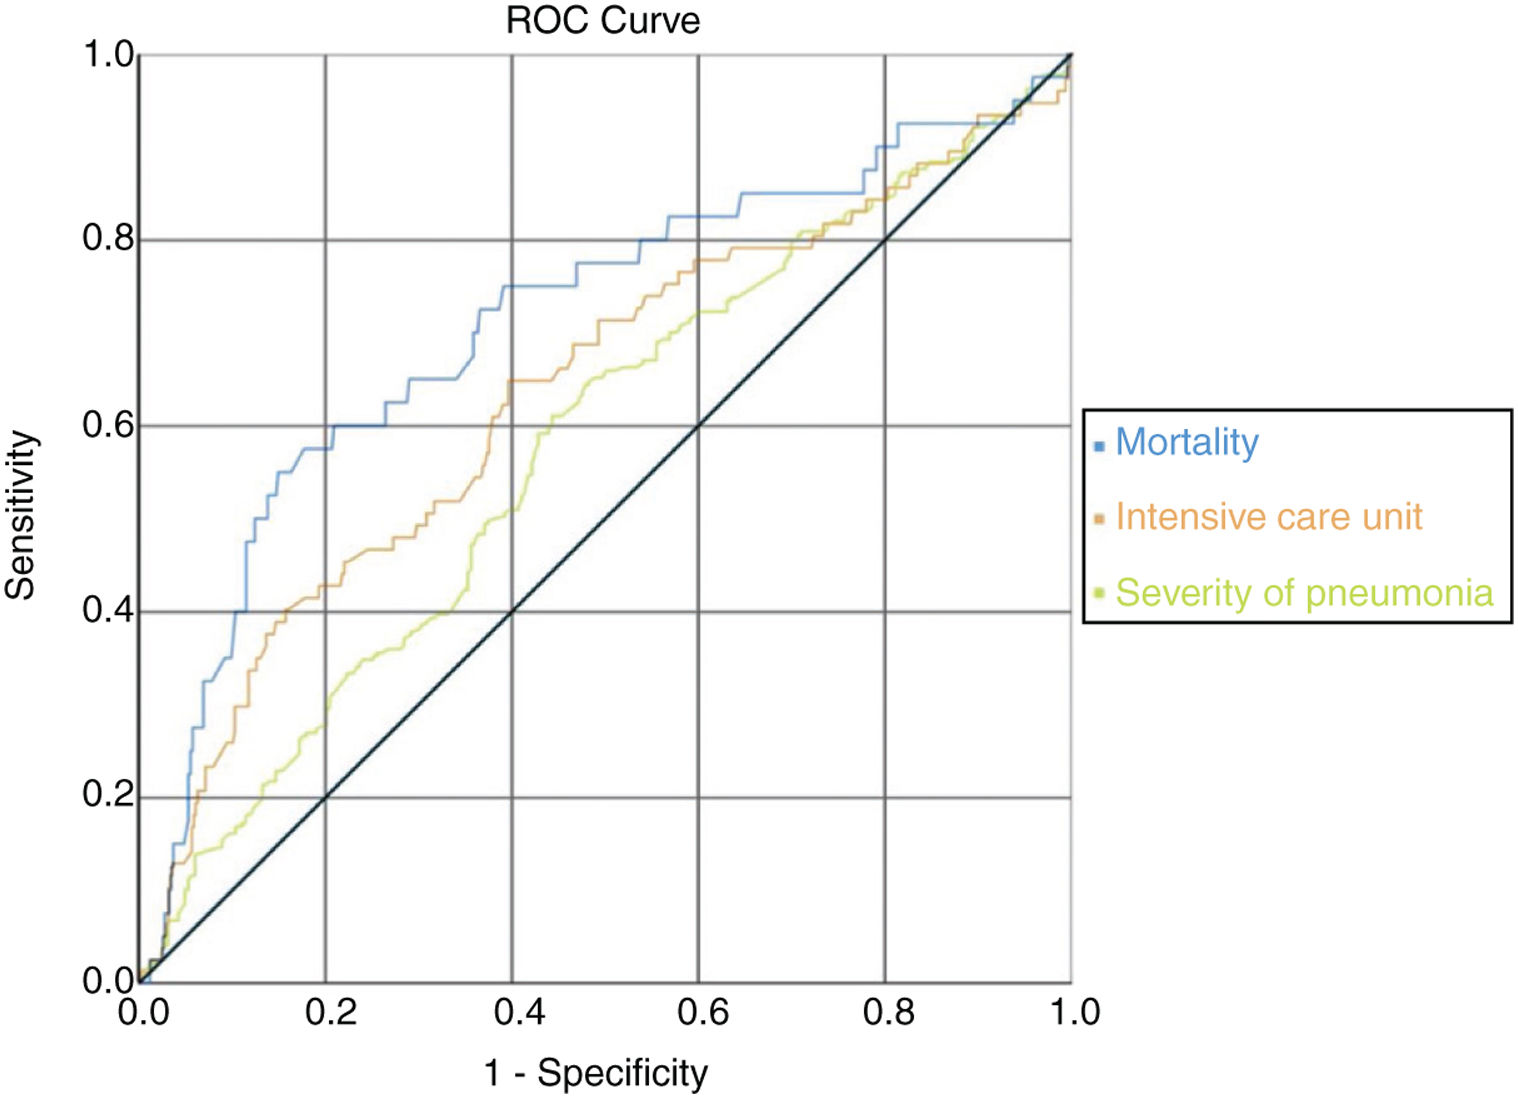
ROC analysis was used to determine clinical conditions according to AST/ALT ratio and if this ratio could be used as a candidate marker. It was observed that the AUC (Area Under the Curve) value under the ROC curve with AST/ALT ratio parameter was also statistically significant in the analyses on mortality, intensive care unit hospitalization, and severity of pneumonia. It was observed that AST/ALT ratio was the best marker of mortality risk (AUC=0.713/p=0.001); severity of pneumonia (AUC=0.577/p=0.002) and expected probability of intensive care unit admission (AUC=0.636/p=0.001) according the ROC analysis. There were no significant differences in specific treatment, hypertension, diabetes mellitus, asthma or COPD and coronary heart disease (Fig. 2) (Table 8).
; 1.26 (sens: 0.610/spes: 0.556); 1.55 (sens: 0.649/spes: 0.604), respectively.")
ROC curve according to AST/ALT ratio with mortality, intensive care unit admission and pneumonia severity. In the ROC curve analysis, the optimum cut-off points of mortality risk, probability of admission to expected intensive care unit and pneumonia severity were 1.65 (sens: 0.575/spes: 0.823); 1.26 (sens: 0.610/spes: 0.556); 1.55 (sens: 0.649/spes: 0.604), respectively.
Roc analysis for AST/ALT ratio.
| Cut-off | AUC (st error) | 95% CI | Sensitivity | Specificity | p | |
|---|---|---|---|---|---|---|
| Mortality | 1.65 | 0.713 (0.048) | 0.618–0.807 | 0.575 | 0.823 | 0.001 |
| Intensive care unit | 1.26 | 0.636 (0.037) | 0.564–0.709 | 0.649 | 0.604 | 0.001 |
| Pneumonia severity | 1.55 | 0.577 (0.024) | 0.529–0.625 | 0.610 | 0.556 | 0.002 |
| Heart failure | 1.31 | 0.600 (0.048) | 0.516–0.689 | 0.553 | 0.616 | 0.039 |
| Dyspnea | 1.18 | 0.551 (0.025) | 0.502–0.599 | 0.566 | 0.545 | 0.041 |
p value was obtained using the Mann–Whitney U test. Statistical significance level is defined as p<0.05.
It was observed that the AUC (Area under the Curve) value under the ROC curve with AST/ALT ratio parameter was statistically significant in the analyses on mortality, intensive care unit hospitalization, and pneumonia severity.
In the ROC curve analysis, the optimum cut-off points of mortality risk, severity of pneumonia and probability of admission to expected intensive care unit were respectively 1.65 (sens: 0.575/spes: 0.823); 1.55 (sens: 0.649/spes: 0.604) and 1.26 (sens: 0.610/spes: 0.556). When we look at the AUC; mortality was the strongest parameter among the cut off values. If the AST/ALT ratio exceeds 1.65 in COVID-19 patients, the risk of death appears to be very high (Fig. 2) (Table 8).
4.3Relationship between R ratio, pattern of liver enzymes abnormalities and Clinical OutcomesSubjects were evaluated in two seperate groups according to their prognosis. Poor prognosis was defined as an event of exitus, admission to the intensive care unit and/or meeting criteria for severe pneumonia. The prognosis of subjects was evaluated according to the R ratio (R ratio <2, 2–5 and >5).
Poor prognosis rate was 26.5% in the cholestatic injury group (R<2), 36.1% in the mixed injury pattern group (R: 2–5) and 30% in the hepato-cellular injury group (R>5) (p 0.001) (Table 9).
Classification by prognosis.
| Good Prognosis | Poor Prognosis | p | ||||
|---|---|---|---|---|---|---|
| n (439) | (79.2)% | n (115) | (20.8)% | |||
| According to R value | Normal | 293 | 84.4 | 54 | 15.6 | 0.001 |
| Cholestatic injury | 100 | 73.5 | 36 | 26.5 | ||
| Mixed injury Pattern | 39 | 63.9 | 22 | 36.1 | ||
| Hepato-cellular Injury | 7 | 70.0 | 3 | 30.0 | ||
| Cholestatic enzyme height (value) | Yes | 10 | 47.6 | 11 | 52.4 | 0.001 |
| No | 429 | 80.5 | 104 | 19.5 | ||
| AST–ALT | Normal | 338 | 84.3 | 63 | 15.7 | 0.001 |
| Minimal | 74 | 66.1 | 38 | 33.9 | ||
| Mild | 25 | 71.4 | 10 | 28.6 | ||
| Acute hepatitis Attack | 2 | 33.3 | 4 | 66.7 | ||
p value was obtained using the Mann–Whitney U test. Statistical significance level is defined as p<0.05.
Subjects were classified into two groups based on their prognosis. The prognosis of subjects was evaluated using the R ratio (R ratio <2, 2–5 and >5) which refers to cholestatic injury, mixed injury pattern and hepatocellular injury, respectively. The best prognosis was seen in the group with a normal R value (84.4%), and the worst prognosis was seen in the mixed-injury pattern group (36.1%).
Patients with ALP>1.5×ULN and/or GGT>3×ULN were considered as the elevated cholestatic liver enzyme group that had a poor prognosis rate of 52.4%. On the other hand, the poor prognosis rate was 19.5% in the normal cholestatic liver enzyme group (p 0.001).
Patients were divided into 3 groups according to liver transaminase elevation rates: minimal (n=112 patients), mild (n=35 patients) and severe (acute hepatitis) (n=6 patients), defined as liver transaminase elevations <2 times ULN, <5 times ULN, >5 times ULN, respectively. The best prognosis was seen in the group with normal ALT–AST levels.
Patients with ALP > 1.5×ULN and/or GGT>3×ULN were considered as elevated cholestatic liver enzyme group that had poor prognosis rate of 52.4%, while in the normal cholestatic liver enzyme group, the poor prognosis rate was 19.5% (p 0.001) (Table 9).
Patients were also divided into 3 groups according to liver transaminase elevation rates: minimal (n=112 patients), mild (n=35 patients) and severe (acute hepatitis) (n=6 patients) which were defined as a liver transaminase elevation <2 times ULN, <5 times ULN, >5 times ULN, respectively. Poor prognosis rate was 33.9% in patients with minimal elevations in the liver transaminases, 28.6% in mild group and 66.7% in the severe (acute hepatitis) group (p 0.001) (Table 9) [13]. We defined aminotransferase levels over 15 times ULN as severe acute liver injury. There were no patients with severe acute liver injury included in our study.
5DiscussionCOVID 19 pneumonia is a critical condition that often occurs at an advanced age and more predominantly in men [16]. In our study, most subjects were male and about 30% of the cases were in patients over 65 years of age. Some degree of liver damage was observed in the vast majority of subjects, especially in patients with severe or critical illness.
Abnormal liver tests were reported for the first time by Chen et al. in patients with COVID-19 [4]. In cases of COVID-19, abnormal liver functions tests (LFTs) have been reported in approximately 15–50% [10,17]. Zhenyu Fan et al. published a study to evaluate the relationship between aminotransferases activity and the clinical outcomes of COVID 19 [10]. Abnormal liver enzyme activity is defined as increased levels of ALT, AST, GGT, ALP and TBILI. Fifty-five patients (37.2%) had abnormal liver function on hospital admission with 14.5% of these patients having high fever, compared with 4.3% of patients with normal liver function (p 0.027) [10].
In another cohort of 1099 patients with COVID-19 from China, they grouped the patients according to their AST and ALT level. 39.4% had AST>40U/L and 28.1% had ALT>40U/L, and most of them occurred in severe and critical cases [18]. In our study, 27.6% of subjects had some degree of increased aminotransferases on admission. However, there were no subjects with liver failure.
The SARS-CoV-2 virus binds to ACE2 receptor, ACE2 can be expressed by different kinds of organs and also detected in intrahepatic bile duct and liver cells [5]. Chai et al. found that both hepatocytes and bile duct cells express ACE2. However, the ACE2 expression of cholangiocytes is much higher than that of hepatocytes [5].
In our study, we have seen elevated markers of AST and ALT most often with 4% (n: 21) of our patients who had elevated cholestatic enzymes. Due to this observation in our study, we have decided to investigate this relationship and to see if a correlation exists between AST–ALT elevations and COVID-19 disease. ACE2 receptor can be one of the many receptors that play a role in liver damage seen in COVID-19. Further studies may show different hepatocyte receptors that play a role in liver damage due to COVID-19. This may also suggest that the systemic hyperinflammatory state is the main responsible mechanism for the elevation in liver enzymes.
However, there is little data on the prognostic importance of liver test abnormalities. Recently, increasing evidence has highlighted the close relationship of abnormal liver biochemistries with severity of COVID-19. In our study, we excluded patients with chronic liver diseases to allow us to confidently attribute acute rises in liver enzymes solely to the SARS-CoV2 virus.
In the report by Zhenyu Fan et al., 148 COVID cases were evaluated. In one third of the cases there were increased aminotransferases levels associated with duration of hospital stay. Patients with abnormal liver functions were more likely to be male, and had higher levels of procalcitonin and CRP [10].
In another cohort of 1099 patients with COVID-19 from China, the mean levels of serum ALT, AST, and bilirubin in severe or critical cases were significantly higher than those in control cases. They noted that patients with severe pneumonia were more likely to develop abnormal aminotransferase levels as compared with those with mild and moderate disease [18]. We found that patients with increased aminotransferases (AST and/or ALT above 40), had higher inflammatory indexes, such as elevated CRP and PCT, ferritin, GGT, LDH, d-dimer and lactate. There was no statistical correlation between fever on admission and increased aminotransferases. But these patients needed more intensive care unit hospitalizations and individualized treatment. These findings are similar to previous studies.
COVID-19 related liver damage can be explained by several different mechanisms. One mechanism includes direct viral attack, in which the virus causes bile duct dysfunction leading to liver injury induced by damage to bile duct cells. This is likely due to the high level of ACE2 receptor expression in the bile duct cells. Another mechanism is a systemic inflammatory reaction due to a cytokine storm. The excessive immune response could likely cause damage to liver. It is important to mention that certain medications are hepatotoxic and can cause liver injury during COVID-19 treatment, especially in critically ill patients [19–21].
The inflammatory reaction that occurs in patients with COVID-19 can result in liver damage. Plasma levels of cytokines such as IL-1, IL-6, and TNF increase, and these cytokines can lead to a systemic cytokine storm that directly causes hepatocyte damage and results in elevation of liver aminotranferases [22].
Likewise, postmortem liver biopsies in Sonzogni et al. revealed the presence of thrombosis in the intraparenchymal bed, sinusoids and portal vein branches. Vascular thrombosis may also be responsible for liver damage [23].
Liver damage seen in COVID-19 could have multiple reasons and to treat it, all other etiologies must be excluded. We also suggest avoiding use of hepatotoxic drugs if possible. Prevention of COVID-19 complications such as sepsis, hypotension, cytokine storm is important to avoid further liver damage. Unfortunately, there's no approved treatment for COVID-19 related liver damage at this time.
Previous studies also reported that AST elevations are more frequent than ALT in severe patients upon admission [18,19]. AST is not a specific marker for liver damage and AST elevations for disease severity suggest immune-mediated inflammation may play a critical role in liver impairment in patients with severe COVID-19. When the AST/ALT ratio is higher than 1, the possibility of its source being cardiac, muscle, or other tissue types should be considered as well [22].
In our study, we stratified subjects into groups based on whether the AST/ALT value was greater or less than 1. In COVID-19 pneumonia, we found that the AST/ALT>1 was the best predictor for requiring hospitalization in the intensive care unit.
In our study, we evaluated the relationship between the R value and subject prognosis. On evaluation of the prognosis according to the R value in the group with increased liver enzymes, the prognosis rate of cholestatic patern (R<2) group was 26.5%; 36% in the mixed injury patern group (R: 2–5) and 30.0% in the hepato-cellular injury group (R>5) (p 0.001). In summary, elevations of aminotransferases correlated with a poorer prognosis. The importance of our study is to establish the relationship between Aminotransferase levels on admission and COVID-19 disease severity by using the AST/ALT ratio to determine prognosis and requirement for hospitalization. We suggest that this novel data be used by clinicans in order to group patients more efficiently.
This study has its limitations. This was a single-centered study without collaboration from other institutions. The number of patients who met our criteria could have been larger. AST–ALT increase and AST/ALT ratio (>1) can be due to COVID-19 or may have been affected by other factors such as; Myositis (AST>ALT), Ischemia/Hypotension or some hepatotoxic drugs patients may have used before being admitted to our hospital [28,29].
In conclusion, abnormal liver tests are common in COVID-19 patients. COVID-19 patients with elevated liver aminotransferases (AST and ALT values above 40U/L) on admission were associated with greater need for hospitalization in the intensive care unit, widespread lung disease and individualized treatment. The R value in each (cholestatic, mixed, hepatocellular) pattern of liver injury is a good indicator of prognosis. The presence of liver test abnormalities on admission can be used as a predictor for the severity of the COVID-19 disease.
AbbreviationsACE2 angiotensin-converting enzyme 2 alkaline phosphatase alanine aminotransferase aspartate aminotransferase active partial thromboplastin time Area Under the Curve C-reactive protein computed tomography European Association for the Study of the Liver gamma-glutamyl transpeptidase hepatitis B virus hepatitis C virus human immunodeficiency virus lactate dehydrogenase liver function tests procalcitonin reverse transcription polymerase chain reaction receiver operating characteristic total bilirubin upper limit of normal World Health Organization
The authors of this research have no conflicts of interest to declare.
Authors contributionsTT, AM, YC designed the research, AO, AM, YC, GY wrote the paper. AM, YC, NS, MK, was responsible for data collection and analysis. TT, SK, FA, AO, BC, AM, YC, GY were responsible for critical revision of the manuscript for important intellectual content. OFB, YC was responsible for the statistical analysis. TT, mentor and primary investigator, was responsible for the study concept and design, critical revision of the manuscript for important intellectual content, and study supervision.
This research received no specific grant from any funding agency in the public, commercial, or not-for-profit sectors. Thanks to Daniel Gauvin for English editing.


