


In 2015 the European Association for the Study of Liver Diseases (EASL) and the Asociación Latinoamericana para el Estudio del Hígado (ALEH) published a guideline for the use of non-invasive markers of liver disease. At that time, this guideline focused on the available data regarding ultrasonic-related elastography methods. Since then, much has been published, including new data about XL probe use in transient elastography, magnetic resonance elastography, and non-invasive liver steatosis evaluation. In order to draw evidence-based guidance concerning the use of elastography for non-invasive assessment of fibrosis and steatosis in different chronic liver diseases, the Brazilian Society of Hepatology (SBH) and the Brazilian College of Radiology (CBR) sponsored a single-topic meeting on October 4th, 2019, at São Paulo, Brazil. The aim was to establish specific recommendations regarding the use of imaging-related non-invasive technology to diagnose liver fibrosis and steatosis based on the discussion of evidence-based topics by an organizing committee of experts. It was submitted online to all SBH and CBR members. The present document is the final version of the manuscript that supports the use of this new technology as an alternative to liver biopsy.
Several tools for assessing fibrosis and steatosis in chronic liver diseases (CLD), particularly hepatitis B and C, non-alcoholic fatty liver disease (NAFLD), and alcoholic liver disease (ALD), have been proposed as non-invasive and cost-effective alternatives to liver biopsy. Due to its overall accuracy, elastography has been viewed as the gold-standard non-invasive method to replace histological evaluation.
1.1Liver biopsy for the assessment of liver fibrosisThe course of liver diseases may vary from self-limited acute hepatitis to decompensated cirrhosis [1]. Those that eventually progress to end-stage liver disease (ESLD) are characterized by liver fibrosis [1]. Liver fibrosis results from the excessive deposition of collagen and other extracellular matrix components in the liver parenchyma [2].
Liver biopsy (LB) is the primary tool to assess fibrosis. The advantages associated with the direct visualization of liver tissue are well established and may eventually define the diagnosis of CLD. Features related to inflammatory activity, fibrosis, and steatosis can be identified by analyzing liver tissue specimens [3].
Despite its importance, LB has limitations due to its invasive nature, cost, and the risk of complications. Besides, its accuracy is related to the liver fragment’s adequate size and analysis to reduce inter and intra-observer variability [4–6]. To mitigate these variations, semi-quantitative scores, as METAVIR, were elaborated [7–10]. Despite better standardization, the disadvantages of LB have led to the search for alternative non-invasive tools [11–17].
1.2Guidance statements- 1)
Liver biopsy is considered the gold standard for assessing fibrosis in CLD despite its limitations.
- 2)
LB is an essential method for diagnosing different liver disease etiologies and may be considered for its initial assessment and follow-up.
- 3)
LB specimens should be obtained by trained personnel, and an experienced pathologist should perform the histopathological analysis.
The use of non-invasive methods is essential for risk stratification and prognosis of CLD, including viral hepatitis [14,17,18] NAFLD [12,16,19] and ALD [20], and allows a point of care evaluation of diverse populations with lower costs and risks.
There are several non-invasive methods for the evaluation of fibrosis. These include direct serum biomarkers like hyaluronic acid, 7S domain of type 4 collagen (7S collagen), and procollagen type III N-terminal peptide (PIIINP), among others and indirect markers like scoring systems that involve routine laboratory parameters such as AST/ALT ratio, FIB-4, APRI, and NAFLD score among others [21]. There are also image-related non-invasive methods for diagnosing fibrosis, like elastography using magnetic resonance (MRE) and ultrasound (US) [22–24]. Compared to scoring systems, ultrasound elastography is more accurate and is usually employed after the initial assessment [22]. Although MRE has a good performance, it is expensive and not widely available [21,23–25].
Ultrasound elastography consists of the measurement of liver stiffness through the speed of shear waves, which can be mechanically produced by an external stimulus (transient pulse controlled by vibrations) such as in the equipment called Fibroscan® or through ultrasonic pulses present in the p-SW and 2D-SW methods [22,26]. External stimuli are also used in MRE [23–25]. It is of utmost importance to point out that confounding bias, such as inflammation reflected by levels of aminotransferases above five times the upper limit of normal, high portal pressure, liver congestion, mechanic cholestasis, heart failure, biliary obstruction, amyloidosis as well as food intake should be permanently excluded due to the misinterpretation of liver stiffness results, mainly when using VCTE and shear wave elastography [27].
The present guidance aims to establish the use of different liver fibrosis and steatosis assessment methods using US-elastography and MRE in chronic hepatitis B and C, NAFLD, and ALD. Although several studies in others chronic liver diseases as PBC, PSC, and AIH are now available, these topics were not in the scope of the discussion held during the 15th Meeting of the Brazilian Society of Hepatology.
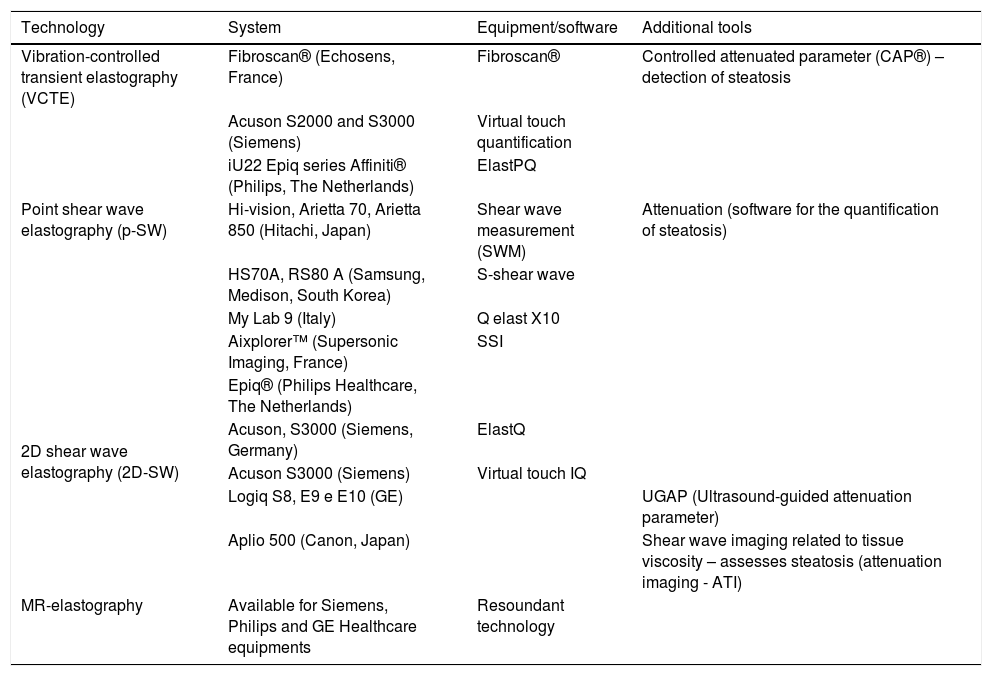
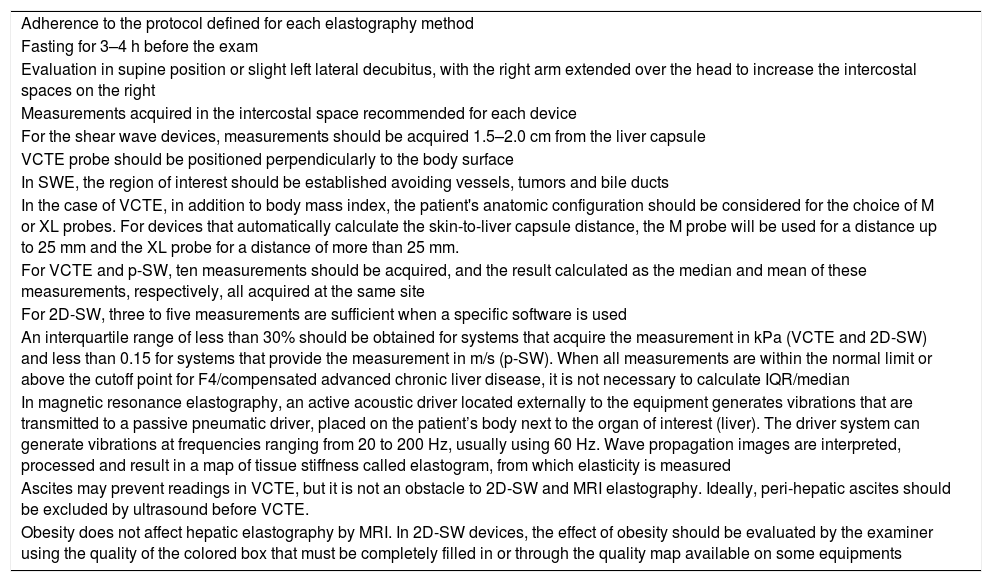
Several US-elastography systems are currently available, each one with its peculiarities (Table 1). Also, elastography’s reliability criteria, independent of CLD disease etiology, were defined (Table 2).
Available elastography systems for the staging of liver fibrosis.
| Technology | System | Equipment/software | Additional tools |
|---|---|---|---|
| Vibration-controlled transient elastography (VCTE) | Fibroscan® (Echosens, France) | Fibroscan® | Controlled attenuated parameter (CAP®) – detection of steatosis |
| Point shear wave elastography (p-SW) | Acuson S2000 and S3000 (Siemens) | Virtual touch quantification | |
| iU22 Epiq series Affiniti® (Philips, The Netherlands) | ElastPQ | ||
| Hi-vision, Arietta 70, Arietta 850 (Hitachi, Japan) | Shear wave measurement (SWM) | Attenuation (software for the quantification of steatosis) | |
| HS70A, RS80 A (Samsung, Medison, South Korea) | S-shear wave | ||
| My Lab 9 (Italy) | Q elast X10 | ||
| 2D shear wave elastography (2D-SW) | Aixplorer™ (Supersonic Imaging, France) | SSI | |
| Epiq® (Philips Healthcare, The Netherlands) | |||
| Acuson, S3000 (Siemens, Germany) | ElastQ | ||
| Acuson S3000 (Siemens) | Virtual touch IQ | ||
| Logiq S8, E9 e E10 (GE) | UGAP (Ultrasound-guided attenuation parameter) | ||
| Aplio 500 (Canon, Japan) | Shear wave imaging related to tissue viscosity – assesses steatosis (attenuation imaging - ATI) | ||
| MR-elastography | Available for Siemens, Philips and GE Healthcare equipments | Resoundant technology |
Adapted from WFUMB [22].
Quality criteria for elastography.
| Adherence to the protocol defined for each elastography method |
| Fasting for 3–4 h before the exam |
| Evaluation in supine position or slight left lateral decubitus, with the right arm extended over the head to increase the intercostal spaces on the right |
| Measurements acquired in the intercostal space recommended for each device |
| For the shear wave devices, measurements should be acquired 1.5–2.0 cm from the liver capsule |
| VCTE probe should be positioned perpendicularly to the body surface |
| In SWE, the region of interest should be established avoiding vessels, tumors and bile ducts |
| In the case of VCTE, in addition to body mass index, the patient's anatomic configuration should be considered for the choice of M or XL probes. For devices that automatically calculate the skin-to-liver capsule distance, the M probe will be used for a distance up to 25 mm and the XL probe for a distance of more than 25 mm. |
| For VCTE and p-SW, ten measurements should be acquired, and the result calculated as the median and mean of these measurements, respectively, all acquired at the same site |
| For 2D-SW, three to five measurements are sufficient when a specific software is used |
| An interquartile range of less than 30% should be obtained for systems that acquire the measurement in kPa (VCTE and 2D-SW) and less than 0.15 for systems that provide the measurement in m/s (p-SW). When all measurements are within the normal limit or above the cutoff point for F4/compensated advanced chronic liver disease, it is not necessary to calculate IQR/median |
| In magnetic resonance elastography, an active acoustic driver located externally to the equipment generates vibrations that are transmitted to a passive pneumatic driver, placed on the patient’s body next to the organ of interest (liver). The driver system can generate vibrations at frequencies ranging from 20 to 200 Hz, usually using 60 Hz. Wave propagation images are interpreted, processed and result in a map of tissue stiffness called elastogram, from which elasticity is measured |
| Ascites may prevent readings in VCTE, but it is not an obstacle to 2D-SW and MRI elastography. Ideally, peri-hepatic ascites should be excluded by ultrasound before VCTE. |
| Obesity does not affect hepatic elastography by MRI. In 2D-SW devices, the effect of obesity should be evaluated by the examiner using the quality of the colored box that must be completely filled in or through the quality map available on some equipments |
SBH, in collaboration with CBR, invited experts to analyze and present the available data on elastography (PubMed database) during the 15th Meeting of the Brazilian Society of Hepatology held in São Paulo in October 2019. The data presented included elastography in chronic hepatitis C, chronic hepatitis B, NAFLD, and ALD were discussed. After the meeting, a draft was submitted to all members of both societies through their homepage. The present manuscript is the final version of the reviewed text organized in topics, followed by joint guidance statements.
3Non-alcoholic fatty liver disease (NAFLD)Patients with metabolic syndrome, diabetes, obesity, and those with NAFLD should initially be investigated by a non-invasive method for risk stratification of liver disease [28–30]. Although abdominal ultrasound is the first step for NAFLD diagnosis, additional non-invasive imaging techniques such as vibration-controlled transient elastography (VCTE) are easy and well validated [30]. Currently, other imaging technologies are available and validated [26]. Contraindications and limitations for each technology must be observed, and the reliability criteria must be met to obtain the best performance and reliable results.
Patients at higher risk of advanced fibrosis or those with discordant non-invasive test results should be considered for histological analysis, while biannual non-invasive assessment at physician discretion can be maintained for low risk patients [21,31].
3.1Diagnostic performance of elastography3.1.1Vibration-controlled transient elastography by Fibroscan®Transient elastography by Fibroscan® is the best-validated method for evaluating liver fibrosis in NAFLD, with the most significant number of published studies [32]. It is a point-of-care method, with easy application and good reproducibility once reliability criteria are met. In NAFLD, VCTE shows the best performance for cirrhosis diagnosis and a high negative predictive value for ruling out advanced fibrosis (F ≥ 3) [33].
Initially, its performance in the population with NAFLD, consisting of a significant number of obese individuals, was limited by the sole availability of the M probe, that can reach a depth of up to 25 mm from the body surface, often insufficient to evaluate liver stiffness in patients with a skin-to-liver capsule distance greater than 25 mm. The XL probe development resulted in significant improvement of VCTE performance in NAFLD since it can reach a depth of 35−75 mm from the body surface. In obese patients, although less evaluated, the XL probe has a performance similar to the M probe for the diagnosis of significant fibrosis [34]. The skin-to-capsule distance and the patient's body mass index (BMI) can be considered to choose the adequate probe. A recent study suggested using the XL probe for a BMI cutoff value of 32–35 kg/m2 when the skin-to-capsule distance cannot be measured [35].
The negative impact of severe steatosis on the performance of VCTE has been discussed [36]. However, recent studies reveal that steatosis does not influence liver stiffness measurement [37,38].
3.1.2Ultrasound elastography by p-SW and 2D-SWP-SW and 2D-SW elastography are two different methods for the non-invasive evaluation of liver fibrosis [21]. P-SW elastography generates shear waves in the liver tissue using radiation force from a focused ultrasound beam. The ultrasound machine monitors the shear wave propagation using a Doppler-like ultrasound technique and measuring its velocity, displayed in meters per second (m/s) or kPa [39].
On the other hand, 2D-SW is a novel technique that allows real-time visualization of shear wave propagation. Shear waves are detected at several lateral locations producing multiple shear wave speed images that are further integrated into one 2D-SW image. The real-time color elastogram is helpful for anatomic and tissue stiffness guidance. Multiple measurements can be acquired from a single image over a large field of view. The measures are displayed in kPa [40].
The quality criteria for the correct interpretation of fibrosis stages determined by p-SW and 2D-SW still need to be better defined, although both methods show good diagnostic performance [32,33,41].
For p-SW, the measurement’s depth should be greater than 6 cm, and ten measurements are recommended, with the mean of these values corresponding to the liver stiffness [22]. In 2D-SW, the evaluation area is more extensive than in p-SW, and the region of interest (ROI) should be positioned in the desired hepatic area for measurement. Additionally, in 2D-SW, the measurement should always be made with the patient in apnea, in the liver’s right lobe, avoiding blood vessels, with an average ROI of 1.5 cm and at a distance of 4–6 cm from the liver capsule. It has not been established how many acquisitions are necessary, but the result should be the median of at least five measurements [22].
The diagnostic performance of the different SW methods for advanced fibrosis and cirrhosis in NAFLD are similar. A recent meta-analysis that included patients with various etiologies of chronic liver disease, studies that used 2D-SW reported 156 patients with NAFLD [42]. The authors obtained an area under the receiver operating characteristic curve (AUROC) of 0.85 and 0.92 and 0.91 to distinguish between fibrosis (F) ≤ 1 vs. ≥ 2, F ≤ 2 vs. ≥ 3, and F ≤ 3 vs. ≥ 4, respectivelly [42].
3.1.3Magnetic resonance with hepatic elastography (MRE)Although MRE accuracy, compared to VCTE, is better in obese patients, a BMI greater than 40 kg/m [2] also impacts MRE performance [43,44]. MRE’s technology is also based on the assessment of shear waves generated by an external “active” acoustic driver that transmits them to the body through a “passive” pneumatic driver, positioned in the patient’s area of interest, next to the right hypochondrium [45]. The technique exhibits excellent reproducibility values in patients with hepatitis B and C with the intra-class correlation coefficient (ICC), both in the intra-observer evaluation, estimated at 0.95, and in the inter-observer evaluation, quantified between 0.83 and 0.90 [46–48]. The guidelines of the Quantitative Imaging Biomarkers Alliance® (QUIBA) recommend that changes more significant than 19% between measurements obtained on the same device and same protocol are real changes [49]. The method's failure rates were estimated at 5.6% in 1377 patients; 71% of these were related to iron in the liver parenchyma [50]. Other reasons related to the increase in MRE failure rate, besides BMI and iron, are massive ascites and the use of 3 Teslas equipment [43,50]. It should be noted that more recent MRE techniques using 2D or 3D Spin-Echo Planar (EPI) pulse sequences have shown markedly superior performance in patients with iron overload [48].
3.1.4Guidance statements- 1)
VCTE is the most validated method for evaluating liver fibrosis in NAFLD; with high diagnostic performance for cirrhosis and high negative predictive value for ruling out advanced fibrosis.
- 2)
VCTE is considered a point-of-care tool.
- 3)
For the best diagnostic performance of VCTE, the M probe should be used in patients with a skin-to-capsule distance of up to 25 mm.
- 4)
XL probe should be used in patients with a skin-to-capsule distance > 25 mm or BMI ≥ 32 kg/m2.
- 5)
If liver stiffness cannot be acquired with the M probe, the XL probe can be used.
- 6)
For p-SW, the measurement depth should be greater than 6 cm, and the final result is the median (m/s) of 10 acquired measurements, provided that the IQR/median is less than 15%.
- 7)
In 2D-SW elastography, the quality criteria consist of a ROI filled by the color map and an ultrasound image without artifacts. The median among five measurements obtained between 15 and 60 mm in depth should be calculated as the final result, with an IQR/median under or equal to 30% for results in kPa and less than 15% for results in m/s.
- 8)
In 2D-SW elastography, the IQR/median does not need to be calculated if all measurements are within normal limits or above the cutoff point for F4/compensated advanced chronic liver disease.
- 9)
MRE has excellent performance for the assessment of liver fibrosis. The presence of iron in the parenchyma is one of the leading causes of failure of the method by the commercially available sequences.
The definition of cutoff values for fibrosis staging depends on the population and prevalence of diverse fibrosis stages in the studied group. The cutoff values for liver fibrosis used to be different for each elastography equipment used, but this concept has been modified recently. From a clinical perspective, it is more important to exclude or rule out the presence of significant/advanced fibrosis than to provide an exact stage of fibrosis.
Due to the possible overlap of the staging of hepatic fibrosis with the METAVIR score, which is greater than the measurement variability between the different devices [22], it has been proposed that specific cutoff values for each device are not necessary [26,40,51].
3.2.1Vibration-controlled transient elastography by Fibroscan®The use of the XL probe reduces the rates of measurement failure, and the performance of VCTE reaches 91% for the two probes [52,53]. The XL probe frequently provides results 1.5–2 kPa lower than those obtained with the M probe. Myers and colleagues observed a good correlation (r = 0.86) between measurements obtained with the M and XL probes; however, the XL probe provided lower values than the M probe [54]. Staugaard and colleagues found lower failure rates for VCTE using the XL probe compared to 2D-SW [55]. In the same study, the authors concluded that, in obese patients, there is probably a no more significant benefit of SW compared to VCTE using the XL probe [55].
A study that exclusively analyzed patients with NAFLD defined cutoff values for the M probe of 5.8 and 9.0 kPa to rule out and diagnose significant fibrosis, respectively, followed by 7.9 and 9.6 kPa to rule out and diagnose advanced fibrosis, and 10.3 and 11.5 kPa to rule out and diagnose cirrhosis [19]. For the XL probe, the cutoff values were 4.8 and 8.2 kPa to rule out and diagnose significant fibrosis, 5.7 and 9.3 kPa to rule out and diagnose advanced fibrosis, and 7.2 and 11.0 to rule out and diagnose cirrhosis [53].
In practical terms, the “rule of five” was the Baveno VI Consensus's recommended strategy, which suggests that elastography values lower than 5 kPa are normal. Values between 5 and 10 kPa would rule out advanced fibrosis, and values >15 kPa would suggest advanced fibrosis. According to the same rule, values >20 kPa would suggest the presence of esophageal varices that require intervention [56].
Despite the recommendation, we emphasize that further validation of this rule is necessary. Besides, the concept of advanced chronic liver disease is clinical and not just equivalent to fibrosis ≥3.
3.2.2Ultrasound elastography by p-SW and 2D-SWResults regarding the use of 2D-SW for fibrosis staging in NAFLD are still limited. The cutoff values depend on the equipment used, and there is still a lack of uniformity of the various systems (Supersonic 2D-SWE.SSI; General Electric – 2D-SWE.GE; Philips – ElastQ; and Canon-Toshiba – 2D-SWE with a propagation map).
A study comparing the performance of VCTE, p-SW, and 2D-SW involving 291 biopsied patients suggested cutoff values with higher sensitivity and specificity for both p-SW and 2D-SW. Clinical factors related to obesity, such as a BMI of 30 kg/m2, a waist circumference of 102 cm, or increased parietal thickness, were associated with failure in liver stiffness measurement by VCTE and 2D-SW and with a more significant number of unreliable p-SW results [57]. In that study, the p-SW and 2D-SW cutoff values with the highest sensitivity and specificity for advanced fibrosis diagnosis (F ≥ 3) were, respectively, 1.15 and 1.53 m/s and 8.3 and 10.7 kPa [57].
A meta-analysis involving 1134 patients with liver diseases of various etiologies published in 2018 analyzed each of the main etiologies [42]. The study included 156 patients with NAFLD whose cutoff values for the various fibrosis stages are described below. The relatively small number of patients with NAFLD included in the study should be highlighted [42].
- •
fibrosis ≥2: 7.1 kPa (sensitivity: 93.8%; 95% confidence interval [CI]: 84.6–99.5%; specificity: 52%; 95% CI: 23–80.4%)
- •
fibrosis ≥3: 9.2 kPa (sensitivity: 93.1%; 95% CI: 84.6–99.5%; specificity: 80.9%; 95% CI: 71.1–89.4%)
- •
fibrosis = 4: 13 kPa (sensitivity: 75.3%; 95% CI: 45.2–97.5%; specificity: 87.8%; 95% CI: 78–95.5%).
A study using the 2D-SW-GE system that involved 331 patients with chronic liver disease of diverse etiologies identified cutoff values of 6.7, 8.2, and 9.3 kPa for F2, F3, and F4, respectively [58].
Recently, the Society of Radiologists in Ultrasound (USA) updated its consensus on ultrasonic elastography proposing the “rule of four”, defining cutoff points at 5, 9, 13, and 17 kPa for the different p-SW and 2D-SW equipment, considering that the differences between them are inferior or super imposable to those found between groups with similar degrees of fibrosis. For viral liver diseases and NAFLD, liver stiffness values equal to or less than 5 kPa (1.3 m/s) suggest a normal result, whereas values less than 9 kPa (1.7 m/s), in the absence of other clinical signs, exclude advanced chronic liver disease. Values between 9 kPa (1.7 m/s) and 13 kPa (2.1 m/s) suggest advanced chronic liver disease, but additional confirmation tests may be necessary. Finally, values over 13 kPa (2.1 m/s) are highly suggestive of advanced chronic liver disease. In some patients with NAFLD, the cutoff points for advanced chronic liver disease may be lower, and additional monitoring with additional tests in those with values between 7 and 9 kPa would be recommended [26]. The consensus suggests abandoning the correlation with histological degrees of fibrosis, preferring to relate liver stiffness to clinical criteria defined in the Baveno Consensus VI [59]. As previously highlighted, this rule still needs further validation.
3.2.3Magnetic resonance with hepatic elastography (MRE)The performance of MRE in assessing the stage of fibrosis is also considered good to excellent, especially in more advanced degrees of fibrosis, as in other elastography techniques [60]. In a recent meta-analysis, MRE was evaluated in 697 patients with various liver disease etiologies, 115 with NAFLD, showing better accuracy for fibrosis ≥3 (sensitivity of 0.89 and specificity of 0.84) with an AUROC of 0.94, and excellent performance for the diagnosis of grade 4 fibrosis with an AUROC of 0.90 (sensitivity of 0.90 and specificity of 0.76) [60].
3.2.4Guidance statements- 1)
In patients with NAFLD, the following cutoff points of VCTE with higher sensitivity and specificity for the diagnosis of the stages of fibrosis when the M probe is used are: a) F >2: 5.8 kPa/d 9.0 kPa; b) F >3: 7.9 kPa/9.6 kPa; c) F = 4: 10.3 kPa/11.5 kPa19.
- 2)
For the XL probe in VCTE, the cutoff points with higher sensitivity and specificity for the diagnosis of the stages of fibrosis are: a) F2: 4.8 kPa/8.2 kPa b) F> 3: 5.7 kPa/ 9.3 kPa; c) F = 4: 7.2 kPa/11.0 kPa.
- 3)
The "rule of five" (BAVENO VI) suggests that results of VCTE < 5 kPa are considered normal. Values between 5 and 10 kPa rule out advanced fibrosis, and those above 15 kPa are suggestive of advanced fibrosis. Still, according to the same rule, results higher than 20 kPa suggest esophageal varices with the need for intervention [25]. It is worth mentioning that these points need further validation in NAFLD.
- 4)
The “rule of 4” for p-SW and 2D-SWE elastography equipment consists of the following cutoff points: values < 5 kPa (1.3 m/s) suggests normal stiffness; <9 kPa (1.7 m/s), in the absence of other clinical signs, excludes compensated advanced chronic liver disease; values between 9 kPa (1.7 m/s) and 13 kPa (2.1 m/s)it is suggestive of compensated advanced chronic liver disease, and additional tests may be necessary to confirm; and finally, >13 kPa (2.1 m/s) is highly suggestive of compensated advanced chronic liver disease. It is worth mentioning that these points need further validation.
- 5)
MRE is entirely accurate, being better for the diagnosis of advanced fibrosis.
Hepatic steatosis can be diagnosed and quantified by different non-invasive methods such as ultrasonography, controlled attenuation parameter (CAP) coupled with Fibroscan® equipment, and magnetic resonance imaging proton density fat fraction (PDFF) measurement or MRI with spectroscopy. The best performance is observed for the two last methods [61].
CAP using M or XL probe allows non-invasive hepatic steatosis assessment, with better performance for mild steatosis diagnosis when the M probe is used [62]. A recent study involving the Brazilian population evaluated the M and XL probes' performance in overweight and obese patients with NAFLD and found a similar diagnostic accuracy of moderate and severe steatosis for both probes [34]. Concerning CAP using the XL probe, more studies are necessary to establish the ideal cutoff values. Pu and colleagues showed that the higher the probability of steatosis, the better the performance of CAP [63].
The meta-analysis by Karlas and colleagues reported the following cutoff values for the diagnosis of steatosis using the M probe: steatosis grade 1 (S1): 248 dB/m (237–261); S2: 268 dB/m (257–284), and S3: 280 dB/m (268–294) [62]. The authors of that study suggested that the cutoff values for CAP should be corrected according to diabetes and BMI between 30 and 40 kg/m2 [62]. The CAP cutoff values using the XL probe have not been clearly established. So far, the same cutoff values are used for both probes.
Castera et al. analyzed two studies that performed a comparison of CAP with ultrasonography, taking liver biopsy as reference. Both studies showed that CAP's performance for detecting and grading liver steatosis was higher than that of ultrasonography, but with a significantly higher overestimation for CAP than for ultrasonography (30.5% vs. 12.4%; p < .05) [32].
The performance of p-SW and 2D-SW in quantifying steatosis is the same as that obtained by conventional ultrasonography, with higher sensitivity for detecting moderate steatosis (at least 33% of the liver parenchyma affected) and depends on examiner experience and the quality of the equipment [64].
Recently, new steatosis quantification technologies have been implemented in ultrasound devices, notably Canon's ATI® (Attenuation Imaging), GE's UGAP® (Ultrasound-guided attenuation parameter), and Hitachi's Attenuation (ATT®), which have shown promising results in comparison with the CAP of Fibroscan® and with MRI-PDFF [25]. According to the published literature, the PDFF technique correlates with liver biopsy and the chemical analysis of tissue [65], with cutoff values in regular patients and those with steatosis ranging from 1.8–9% studies [66,67].
3.3.1Guidance Statements- 1)
CAP is a software that quantifies steatosis in the VCTE equipment.
- 2)
CAP cutoff values may need to be corrected according to diabetes and a BMI between 30 and 40 kg/m2.
- 3)
CAP cutoff values using the XL probe still need to be validated.
- 4)
The non-invasive methods with better precision in identifying and quantifying hepatic steatosis are PDFF and proton spectroscopy by MRI.
Transient elastography is the most validated method for fibrosis staging in chronic hepatitis C. Studies have also used p-SW and 2D-SW to diagnose fibrosis in this population, as described below.
4.1Vibration-controlled transient elastography by Fibroscan®Several articles and some meta-analyses have evaluated the performance of VCTE in diagnosing significant fibrosis and cirrhosis in chronic hepatitis C using LB as the reference method [14,51,68–71]. The AUCs of the separate meta-analyses ranged from 0.83 to 0.89 for significant fibrosis and from 0.94 to 0.96 for cirrhosis. Only one meta-analysis included HIV-coinfected patients, and the performance was similar to that observed in mono-infected patients [69,72–75]. The results obtained led to the unanimous recommendation of VCTE as a non-invasive diagnostic tool for the diagnosis of significant fibrosis and cirrhosis in patients with chronic hepatitis C.
Although studies have identified different cutoff values for the diagnosis of fibrosis, the most widely used are those of Castera et al., who defined 7.1 kPa for F2, 9.5 kPa for F3, and 12.5 kPa for F4 [14].
The clinical contexts, in which VCTE is applied to patients with hepatitis C, with or without HIV coinfection, are fibrosis staging, detection of liver fibrosis, and risk prediction of severe outcomes [76].
4.2Ultrasound elastography by p-SWP-SW is another method that was studied for the diagnosis of fibrosis in chronic hepatitis C. This elastography method shows good performance, with AUROCs of 0.87−0.88 for the diagnosis of significant fibrosis and 0.91−0.93 for cirrhosis diagnosis in different meta-analyses [77–79]. Three devices are currently available: Siemens system (ARFI), which has been the leading technology, the Philips system (ElastPQ), and the one from Samsung.
In 2017, a Brazilian study with 81 patients with chronic hepatitis C recommended the following cutoff values for hepatic elastography by Siemens p-SW: ≥ 1.22 m/s for significant fibrosis (F ≥ 2), ≥1.48 m/s for advanced fibrosis (F ≥ 3), and ≥1.77 m/s for cirrhosis (F = 4) in mono-infection for chronic hepatitis C [77]. However, a meta-analysis published in 2012, which evaluated elastography's performance using the p-SW with a series of 380 patients with chronic hepatitis C, proposes other cutoff values [80].
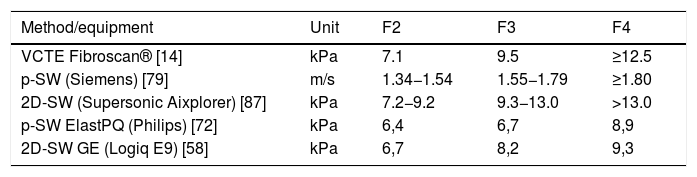
In 2017, Mare et al. evaluated the performance of p-SW Elasto-PQ in a population of patients with chronic hepatitis B and C (74% of patients) and compared the results obtained using VCTE by Fibroscan® as a reference. The cutoff points defined for patients with chronic hepatitis C were F ≥ 2: 6.4 kPa (AUROC 0.96), F ≥ 3: 6.7 kPa (AUROC 0.97), and F = 4: 8, 9 kPa (AUROC 0.83) [81]. In 2018, Fouad et al. evaluated the performance of the p-SW Elasto-PQ in 72 patients with chronic hepatitis C, obtaining in this series AUROC of 0.79, 0.74, and 0.83 for F ≥ 1, F ≥ 2, and F ≥ 3, respectively, and defined the following cutoff values: 4.9 kPa for minimal fibrosis, 6.6 kPa for significant fibrosis and 10.7 kPa for advanced fibrosis and liver cirrhosis (F3/4) in mono-infection by chronic hepatitis C [82]. It should be noted that the definition of cutoff is associated with the prevalence of various stages of fibrosis in the studied sample. Hence, we chose to define the best cutoff values based on studies that had a higher number of patients, which, in general, contributes to a more homogeneous distribution of the different stages of fibrosis. These cutoffs are described in Table 3.
The clinical contexts in which p-SW are applied in chronic hepatitis C with or without HIV coinfection are fibrosis staging and liver cirrhosis detection.
4.3Ultrasound elastography by 2D-SWTwo-dimensional SW shows good performance for liver stiffness measurement in patients with chronic hepatitis C [83]. In individuals without liver disease, the mean elastography value was 5.5 kPa, with the Supersonic Aixplorer system showing good reproducibility [84]. A study on chronic hepatitis C patients evaluated with the same equipment demonstrated excellent performances, with AUROCs of 0.94 for F ≥ 2, 0.96 for F ≥ 3, and 0.96 for F = 4 [85].
A recent meta-analysis conducted by Kim and colleagues, including 6961 patients, evaluated four main parameters: the pooled proportion of technical failures, pooled proportion of unreliable measurements, inter-observer reliability, and intra-observer reliability. The pooled proportion of technical failures was 2.3% (95% confidence interval [CI], 1.3–3.9%) and the pooled proportion of unreliable measurements was 7.5% (95% CI, 4.7–11.7%). The inter and intra-observer reliability was 0.87 (95% CI, 0.82−0.90) and 0.93 (95% CI, 0.89−0.95), respectively, suggesting good to excellent reliability [86].
The staging of liver fibrosis by 2D-SW in hepatitis C shows good performance, equivalent to VCTE and p-SW.
As VCTE, cutoff values are not yet available for the SW technique in patients with hepatitis C during or after treatment with antiviral agents [87].
Regarding the cutoff values recommended for liver fibrosis diagnosis, several systems that use different elastography methods are currently available, each of them with specific cutoff values. Some elastography systems and their respective methods and cutoff values are described in Table 3.
4.4Magnetic resonance with hepatic elastography (MRE)Among the non-invasive methods used for staging hepatic fibrosis in hepatitis C, MRE is the least used in the routine, due to its lower availability, despite its diagnostic accuracy being superior to other non-invasive methods [24]. MRE differentiates a normal liver from a fibrotic one with accuracy of 89%–99%, with sensitivity from 80% to 98% and specificity from 90% to 100%. Early fibrosis can be detected even when anatomical changes are absent [40]. The cutoff values for detecting fibrosis vary from 2.40 to 2.93 kPa in different studies. This variation is probably due to the different populations studied and due to the inclusion of multiple etiologies of chronic liver disease [88,89]. In a meta-analysis including 697 patients with chronic liver diseases of various etiologies, the AUROCs obtained by MRE-2D to detect fibrosis stages ≥1, ≥2, ≥3 and cirrhosis were 0.84 (95% CI: 0.76−0.92), 0.88 (95% CI: 0.84−0.91), 0.93 (95% CI: 0.90−0.95) and 0.92 (95% CI: 0, 90−0.94), respectively [60]. This meta-analysis identified the best cutoff points as 3.45, 3.66, 4.11, and 4.71 kPa for detecting fibrosis stages ≥1, ≥2, ≥3, and 4, respectively [59]. Kim and colleagues [90] found no significant differences between the combined sensitivity and specificity of MRE-2D using GRE vs. SE-EPI sequences. Further studies are needed to establish diagnostic thresholds for MRE-3D. A 2015 study evaluating only patients with viral hepatitis B and C compared the performance of MRE to APRI, with excellent accuracy for MRE [91]. However, only 54 patients with chronic hepatitis C were evaluated. The MRE equipment used was 1.5 T (Avanto, Siemens, Erlangen, Germany) and showed the following cutoff points for staging chronic hepatitis C: 2.47 for ≥ F1 (sensitivity: 98.1%, specificity: 100%); 2.73 for ≥ F2 (sensitivity: 95.7%, specificity: 90.6%); 3.71 for ≥ F3 (sensitivity: 91.7%, specificity: 90.7%); and 3.83 for F4 (sensitivity: 100%, specificity: 88.5%) [91].
4.5Guidance statements- 1)
VCTE, p-SW, and 2D-SW techniques should be used as first-line tools for fibrosis staging in chronic hepatitis C patients.
- 2)
Elastography techniques show the best performance for ruling out or confirming the presence of cirrhosis in patients with chronic hepatitis C.
- 3)
Elastography cutoff values for the follow-up of patients with chronic hepatitis C after antiviral treatment have not been defined.
The initial approach to patients with chronic hepatitis B should include an assessment of the severity of the liver disease to identify patients with treatment indication, in addition to screening for hepatocellular carcinoma. To complement staging, including abdominal ultrasound and laboratory tests, the patient should also be evaluated by LB or non-invasive tests [92,93]. VCTE has been the most studied in patients with chronic hepatitis B and provides the highest diagnostic accuracy for detecting cirrhosis. It should be noted that non-invasive methods are more suitable to rule out rather than to diagnose advanced fibrosis or cirrhosis [93,94].
5.1Vibration-controlled transient elastography by Fibroscan®The performance of any liver elastography method for detecting significant fibrosis in patients with chronic hepatitis B is superior to that of biochemical methods [95,96]. Among the elastography methods, VCTE is the most validated, especially for diagnosing advanced fibrosis and cirrhosis [95]. Intermediate VCTE values have shown lower accuracy, and liver biopsy should be considered [97].
In patients defined as inactive carriers, VCTE values showed fewer follow-up fluctuations than scores as APRI and Fibrotest® [98]. Studies verified that VCTE values and aminotransferase levels, and viral load are significantly lower in inactive carriers than those with HBeAg-negative chronic hepatitis B. Thus, the non-invasive procedure is helpful in inactive carriers for a more selective LB indication before considering antiviral therapy [98,99].
In the case of patients with chronic hepatitis B irrespective of HBeAg profile, patients with flares or elevated transaminases, and patients with acute hepatitis B, the VCTE results must be evaluated with caution because of the possibility of increased measurements that do not reflect liver damage but rather inflammation [90,91,97]. Elastography should not be performed in the presence of liver enzymes higher than five times the upper limit of normal [97,100].
In patients with HBeAg-negative chronic hepatitis B, oscillations in aminotransferases related to the reactivation phase can be associated with a higher risk of advanced fibrosis, and staging is essential. Patients of the same group with persistently normal aminotransferases and undetectable viral load or <20,000 IU/mL should also be submitted to fibrosis staging despite the low risk of advanced fibrosis [101]. In HBeAg-positive patients, particularly those older than 35 years, with normal ALT but close to the upper limit of normal, non-invasive liver fibrosis assessment is useful to differentiate the immune-tolerant phase from the presence of significant fibrosis secondary to clearance [102].
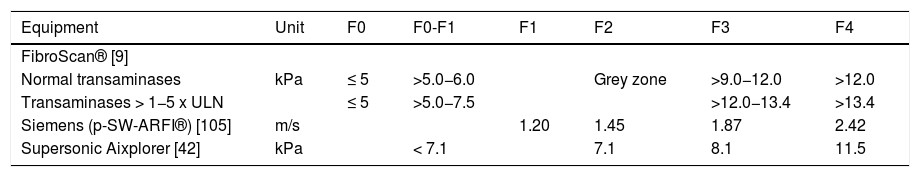
Although studies have identified different cutoff values for fibrosis staging (F), the most used are those defined by Chan and cols [97] in 2009. In that study, patients with values up to 5 kPa did not have fibrosis, and values between 5.1 and 6 kPa were classified as F0/1, between 9.1 and 12 kPa as F3 > 12 kPa as F4. The grey zone was defined as values between 6.1 and 9 kPa, and these patients should undergo, if possible, histological evaluation. Among patients with elevated transaminases (>1–5 times the upper limit of normal), those with values up to 5 kPa did not have fibrosis, and values between 5.1 and 7.5 kPa were classified as F0/1, between 12.1 and 13.4 kPa as F3, and >13.4 kPa as F4. The grey zone was defined as values between 7.6 and 12 kPa, and these patients should undergo histological evaluation if possible [97] (Table 4).
Cutoff values of different elastography systems for chronic hepatitis B.
| Equipment | Unit | F0 | F0-F1 | F1 | F2 | F3 | F4 |
|---|---|---|---|---|---|---|---|
| FibroScan® [9] | |||||||
| Normal transaminases | kPa | ≤ 5 | >5.0−6.0 | Grey zone | >9.0−12.0 | >12.0 | |
| Transaminases > 1−5 x ULN | ≤ 5 | >5.0−7.5 | >12.0−13.4 | >13.4 | |||
| Siemens (p-SW-ARFI®) [105] | m/s | 1.20 | 1.45 | 1.87 | 2.42 | ||
| Supersonic Aixplorer [42] | kPa | < 7.1 | 7.1 | 8.1 | 11.5 |
ULN: upper limit of normal.
Various devices use SW elastography, which can evaluate patients with chronic hepatitis B, each with different cutoff values. The results of ARFI®-p-SW are more validated for chronic hepatitis C than for chronic hepatitis B. This method showed better accuracy for cirrhosis diagnosis than significant fibrosis, and the results were comparable to those obtained by VCTE [77,103,104]. A meta-analysis that evaluated the performance of ARFI®-p-SW in patients with chronic hepatitis B and C demonstrated high diagnostic accuracy for predicting advanced fibrosis and cirrhosis compared to early stages of liver fibrosis [105].
A recently published multicenter study compared 2D-SW with other indirect methods (APRI, FIB-4, and VCTE) to evaluate patients with chronic hepatitis B. The authors observed higher accuracy of 2D-SWE for ruling out and diagnosing cirrhosis [106].
The ARFI®-p-SW cutoff values used for fibrosis staging in chronic hepatitis B virus infection are: 1.20 m/s for ≥F1, 1.45 m/s for ≥F2, 1.87 m/s for ≥F3, and 2.42 m/s for F4 [105].
In 2D-SW, cutoff values for fibrosis staging in chronic hepatitis B virus infection are ≥7.1 kPa for ≥F2, ≥8.1 kPa for ≥F3, and ≥11.5 kPa for F4. Values <8.4 kPa rule out cirrhosis [42] (Table 4).
5.3Guidance statements- 1)
The performance of any hepatic elastography method for detecting significant fibrosis in chronic hepatitis B is superior to that of biochemical methods.
- 2)
VCTE is the most validated method, especially for diagnosing advanced fibrosis and cirrhosis.
- 3)
The different phases of chronic hepatitis B require an individual approach.
- 4)
In chronic hepatitis B, SWE can be performed with various devices, each of them with different cutoff values.
Studies evaluating liver elastography methods in patients with alcoholic liver disease (ALD) are scarce [107,20].
Although the diagnostic cutoff values for early-stage fibrosis (F1 and F2) are similar for all liver diseases [18,20,107], the cutoff for advanced fibrosis (F3) is notably higher in ALD (11.0–11.6 kPa) compared, for example, to chronic hepatitis C virus (HCV) infection (9.0–9.6 kPa) [14,70]. The difference is even higher for cirrhosis (F4), with cutoff values ranging from 19.5 to 22.6 kPa in ALD versus 12.5–14.6 kPa in HCV [14,70].
Another factor that can positively influence elastography is the effect of alcohol abstinence on aminotransferase levels and liver stiffness. Marcellin and cols [18] observed a decrease in the elastography value one week after alcohol withdrawal, affecting fibrosis measurements’ diagnostic reliability during alcohol abuse. Another study confirmed Marcellin's findings, demonstrating that the presence of alcoholic hepatitis can substantially affect liver stiffness, overestimating the diagnosis of fibrosis, especially if bilirubin levels are high [108].
A recent meta-analysis [109] evaluated specific cutoff values for liver fibrosis in patients with ALD and the effect of aspartate aminotransferase (AST) and bilirubin levels. Ten studies that included a total of 1026 patients were analyzed. The cutoff values were 7.0 kPa (AUROC 0.83) for F ≥ 1; 9.0 kPa (AUROC 0.86) for F ≥ 2; 12.1 kPa (AUROC 0.90) for F ≥ 3 and 18.6 kPa (AUROC 0.91) for F4. The AST and bilirubin levels significantly affected liver stiffness, with higher levels being associated with higher elastography values (p < 0.0001) and higher cutoff values for identifying all stages of fibrosis. In ALD, the authors concluded that fibrosis assessment by VCTE should consider AST and bilirubin levels by using specifically adjusted liver stiffness cutoff values.
The guideline of the American Gastroenterological Association (AGA) [110] recommends that cirrhosis can be accurately diagnosed using a cutoff value of 12.5 ± 1.0 kPa. However, the best cutoff value still must be established.
The guidelines of the European Federation of Societies for Ultrasound in Medicine and Biology (EFSUMB) [83] on non-invasive methods recommend the use of VCTE to rule out cirrhosis in patients with ALD when alcoholic hepatitis is not present. Also, there is no evidence to recommend the use of VCTE for monitoring or prognostic evaluation, or to predict the presence of esophageal varices or the result of the hepatic venous pressure gradient. In abstinent patients (0.5–4 weeks), there is an apparent reduction in VCTE values associated with the normalization of aminotransferase levels. The diagnostic performance of VCTE decreases if AST levels are higher than 100–150 IU/L.
6.1Guidance statements1) VCTE can help diagnose cirrhosis in ALD using a cutoff value of 12.5 ± 1.0 kPa, but the best cutoff has yet to be established.
2) VCTE can be used to rule out cirrhosis when alcoholic hepatitis is not present.
3) Fibrosis assessment by VCTE should consider AST and bilirubin levels.
4) Fibrosis assessment by VCTE should consider the period of alcohol abstinence.AbbreviationsEASLEuropean Association for the Study of the LiverALEHAsociación Latinoamericana para el Estudio del HígadoSBHBrazilian Society of HepatologyCBRBrazilian College of RadiologyCLDchronic liver diseasesNAFLDnon-alcoholic fatty liver diseaseALDalcoholic liver diseaseESLDend-stage liver diseaseLBliver biopsyMREmagnetic resonance elastographyUSultrasoundVCTEvibration-controlled transient elastographyBMIbody mass indexp-SWUltrasound elastography by Point-shear wave elastography2D-SWUltrasound elastography by Two-dimensional shear waveROIregion of interestAUROCreceiver operating characteristic curveFfibrosisICCIntraclass correlation coefficientUSASociety of Radiologists in UltrasoundCAPcontrolled attenuation parameterPDFFmagnetic resonance imaging proton density fat fractionAGAAmerican Gastroenterological AssociationEFSUMBEuropean Federation of Societies for Ultrasound in Medicine and Biology
The authors would like to thank all members of the panel of the Brazilian Society of Hepatology and Brazilian College of Radiology: Drs. Ana Claudia de Oliveira, Edison Roberto Parise, Fernando Linhares Pereira, Jorge Elias Junior, José Eymard de Medeiros Filho, Monica Salum Valverde B. Viana, Nathalie Carvalho Leite, Roberto Lemos, Rodrigo Lautert Azambuja, Sandra Tochetto


