


Cow's milk allergy (CMA) is common, especially in children. The treatment is based on the exclusion of milk and dairy products and guidance regarding the exclusion diet. This study aimed to compare the anthropometric measurements and food intake of children with CMA with those of healthy controls, and to evaluate the serum concentrations of Vitamin A and 25(OH)D in children with CMA.
MethodsThis is a cross-sectional study with 27 children in the CMA group and 30 in the control group. z-Scores of body mass index and height, skinfolds, food intake and serum concentrations of retinol, beta-carotene, lycopene, 25(OH)D, parathyroid hormone and high sensitivity C-reactive protein were evaluated.
ResultsMean age was four years (±1.9). The CMA group evidenced a lower height compared to those from the control group (p=0.0043). The CMA group showed a lower intake of calcium (p=0.0033) and lipids (p=0.0123). Low serum concentrations of retinol, beta-carotene, lycopene, 25(OH)D were found in 25.9%, 59.3%, 48.1% and 70.3% of the CMA group, respectively.
ConclusionsChildren with CMA consume smaller amounts of calcium and lipids and have shorter height compared to healthy controls. Insufficient levels of vitamins A and D were frequent in the CMA group, emphasizing the need for nutritional guidance and monitoring.
Cow's milk allergy (CMA) is common in children, with an incidence of 2–7.5% in the first year of life.1 An epidemiological survey of pediatric gastroenterologists in southern and southeastern Brazil showed that the incidence and prevalence of CMA were 2.2% and 5.4%, respectively.2
Individualized nutritional interventions based on the exclusion of milk and dairy products, as well as preparations containing this food, with appropriate guidance regarding the exclusion diet, play a central role in the treatment of CMA.3,4
Children with CMA are at nutritional risk due to their disease, which is accompanied by an inflammatory process that may influence serum micronutrient concentrations or related to the exclusion diet.5,6 Impaired height growth and lower consumption of calcium and vitamin D are described in the literature.7
Few national studies have evaluated the food intake of infants with CMA,8,9 and no studies that evaluated CMA only in preschoolers were found.
Considering the lack of publications evaluating consumption and biomarkers associated with nutritional deficiencies prevalent in the pediatric age group, this study aimed to compare the anthropometric measurements and dietary intake of children with CMA and healthy controls, and evaluate the serum concentrations of retinol, beta-carotene, lycopene and 25(OH)D of children with CMA, and to relate them to variables associated with the disease, dietary intake, body composition and milk substitute used.
MethodsSelection and description of participantsThis cross-sectional and controlled study evaluated 27 patients with CMA (CMA group) mediated by Immunoglobulin E (IgE) as per their clinical history and with a history of sensitivity to cow's milk and its protein fractions or Oral Challenge Test for positive Cow's Milk (CM), attended at the Allergy and Clinical Immunology Outpatient Clinic of the Federal University of São Paulo (UNIFESP) and at the Menino Jesus Child Hospital, São Paulo, Brazil. The control group consisted of healthy volunteers regularly enrolled in a private school in the city of São Paulo, paired by gender and age, and employed to compare the anthropometric and dietary intake variables.
Children with allergies to food other than milk, who were breastfed, used corticosteroids in the three months prior to data collection, and who had disabsorptive diseases, such as celiac disease, cystic fibrosis, and inflammatory bowel diseases were excluded from the survey. Concerning the control group, those with chronic and acute diseases were excluded at the time of data collection.
The Research Ethics Committee of Unifesp approved the study, and the Informed Consent Form and Assent Form were applied to parents or guardians and children, respectively.
The questionnaires allowed the collection of clinical data such as gestational age, birth weight and length, length of exclusive and total breastfeeding, age and symptoms of the first reaction to CM, food allergy-related tests performed, time of sun exposure, CM substitute and use of supplements.
Nutritional statusThe weight and height of both groups were ascertained and assessed according to the World Health Organization, using the anthropometric indicators of BMI-for-age (ZBMI) and height-for-age (ZH).10 Arm circumference and the tricipital and subscapular skinfolds were measured and classified as per Frisancho.11 Abdominal circumference was measured and classified as per McCarthy and Ashwell, considering increased waist-to-height ratio when greater than 0.5.12
Nutrient intakesThe parents completed a non-consecutive three-day dietary recording, two during the week and one at the weekend13 to evaluate dietary intake. Parents received explanatory material containing instructions and photos of home measures to facilitate completion of the diary and measurement for calculation. The dietary record was checked and corrected by an experienced nutritionist with the parents upon delivery.
Dietary intake was calculated using the DietWin® Plus version program, which uses the Brazilian Food Composition Table14 and other Brazilian databases. Food information not recorded in the program was consulted on its respective labels and entered. Consumption data were compared to the control group and to the reference framework proposed by the Institute of Medicine.15
Vitamin D and A statusOnly for the CMA group, 15mL blood aliquots were collected by peripheral venipuncture in a low-light room by a nursing professional. The samples were first sent to UNIFESP's Inborn Errors of Metabolism Laboratory, where they were centrifuged at 3000rpm for 10min. The sera obtained after centrifugation were stored at −80°C and were forwarded to the Clinical Laboratory Analysis for the analysis of retinol, beta-carotene, and lycopene, by means of high-performance liquid chromatography (Chromsystems Instruments & Chemicals GmbH, Germany)16–18; 25(OH)D and parathyroid hormone (PTH) by electrochemiluminescence immunoassays19,20; and high sensitivity C-reactive protein (hsCRP) by immunoturbidimetric assay (Roche®, Brazil).21
The cut-off points adopted for inadequacy were: retinol ≤20μg/dL18; beta carotene <50μg/L,16 lycopene <0.5μmol/L,17 25(OH)D deficient <20μg/dL, and insufficiency between 21 and 29μg/dL.20 Regarding PTH, hyperparathyroidism levels above 65pg/mL19 were considered and, for us-CRP, levels <3mg/L were considered adequate.21
Statistical analysisA similar study carried out in Brazil8 was used for sample power calculation. Considering the gap in calcium intake between the groups, we adopted alpha=0.05 and beta=0.20 and reached a sample size of 27 in each group.
Statistical analysis was performed with the SPSS 25.0 package. The qualitative variables were shown as absolute number and percentage, compared with the Chi-square test and Fisher's exact test. Continuous variables were tested for their normality using the Kolmogorov–Smirnov test. Those within normal distribution were shown as mean±standard deviation and compared with Student's t-test and ANOVA; those outside normal distribution were shown as median (minimum and maximum) and compared with the Mann–Whitney test. We adopted a significance level of 5%.
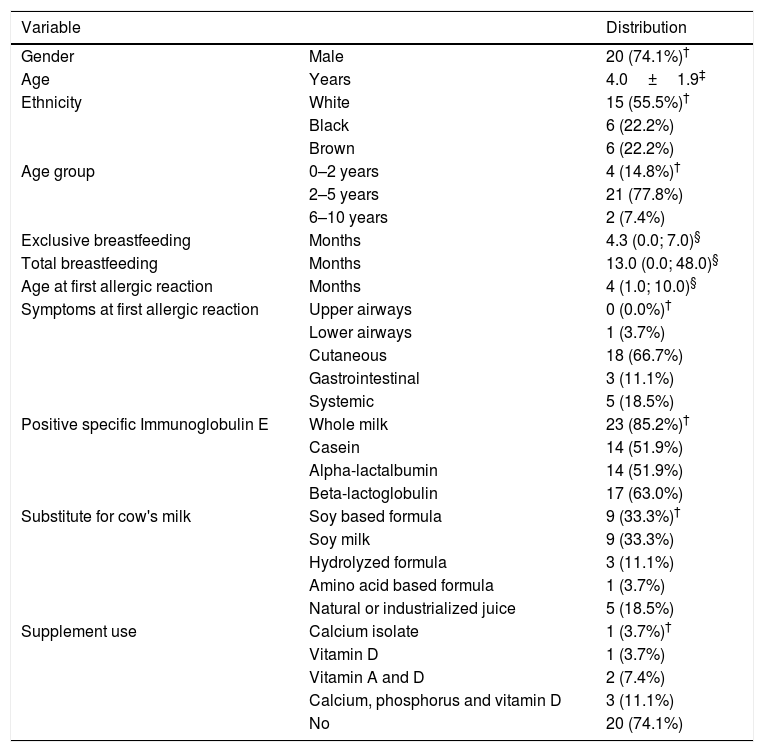
ResultsTable 1 describes the general characteristics of the 27 children in the CMA group. Most were born full-term and with adequate weight for gestational age, and only three were preterm. Regarding food history, only one child (3.7%) was not breastfed.
Characterization of children with cow's milk allergy (N=27).
| Variable | Distribution | |
|---|---|---|
| Gender | Male | 20 (74.1%)† |
| Age | Years | 4.0±1.9‡ |
| Ethnicity | White | 15 (55.5%)† |
| Black | 6 (22.2%) | |
| Brown | 6 (22.2%) | |
| Age group | 0–2 years | 4 (14.8%)† |
| 2–5 years | 21 (77.8%) | |
| 6–10 years | 2 (7.4%) | |
| Exclusive breastfeeding | Months | 4.3 (0.0; 7.0)§ |
| Total breastfeeding | Months | 13.0 (0.0; 48.0)§ |
| Age at first allergic reaction | Months | 4 (1.0; 10.0)§ |
| Symptoms at first allergic reaction | Upper airways | 0 (0.0%)† |
| Lower airways | 1 (3.7%) | |
| Cutaneous | 18 (66.7%) | |
| Gastrointestinal | 3 (11.1%) | |
| Systemic | 5 (18.5%) | |
| Positive specific Immunoglobulin E | Whole milk | 23 (85.2%)† |
| Casein | 14 (51.9%) | |
| Alpha-lactalbumin | 14 (51.9%) | |
| Beta-lactoglobulin | 17 (63.0%) | |
| Substitute for cow's milk | Soy based formula | 9 (33.3%)† |
| Soy milk | 9 (33.3%) | |
| Hydrolyzed formula | 3 (11.1%) | |
| Amino acid based formula | 1 (3.7%) | |
| Natural or industrialized juice | 5 (18.5%) | |
| Supplement use | Calcium isolate | 1 (3.7%)† |
| Vitamin D | 1 (3.7%) | |
| Vitamin A and D | 2 (7.4%) | |
| Calcium, phosphorus and vitamin D | 3 (11.1%) | |
| No | 20 (74.1%) |
The control group did not differ from the CMA group regarding age (p=0.958), gender (p=0.776) and exclusive breastfeeding time (p=0.222). In turn, children in the CMA group had longer total breastfeeding time compared to the control group (13.0 vs. 6.0 months, p=0.001).
Concerning milk substitute, nine children (33.3%, age 3.2±1.5 years) were given soy infant-based formula or soy powder-based product, nine (33.3%, age 4.6±1.7 years) received original soy milk, three children (11.1%, age 2.5±1.2 years) received a hydrolyzed formula, and one (3.7%; age 1.8 years) received an amino acid-based formula. The use of natural or processed fruit juice, replacing CM, was found in five patients (18.5%, age 5.7±1.6 years). Regarding the use of medication supplementation, more than 70% of them did not receive regular vitamin and mineral supplementation (Table 1).
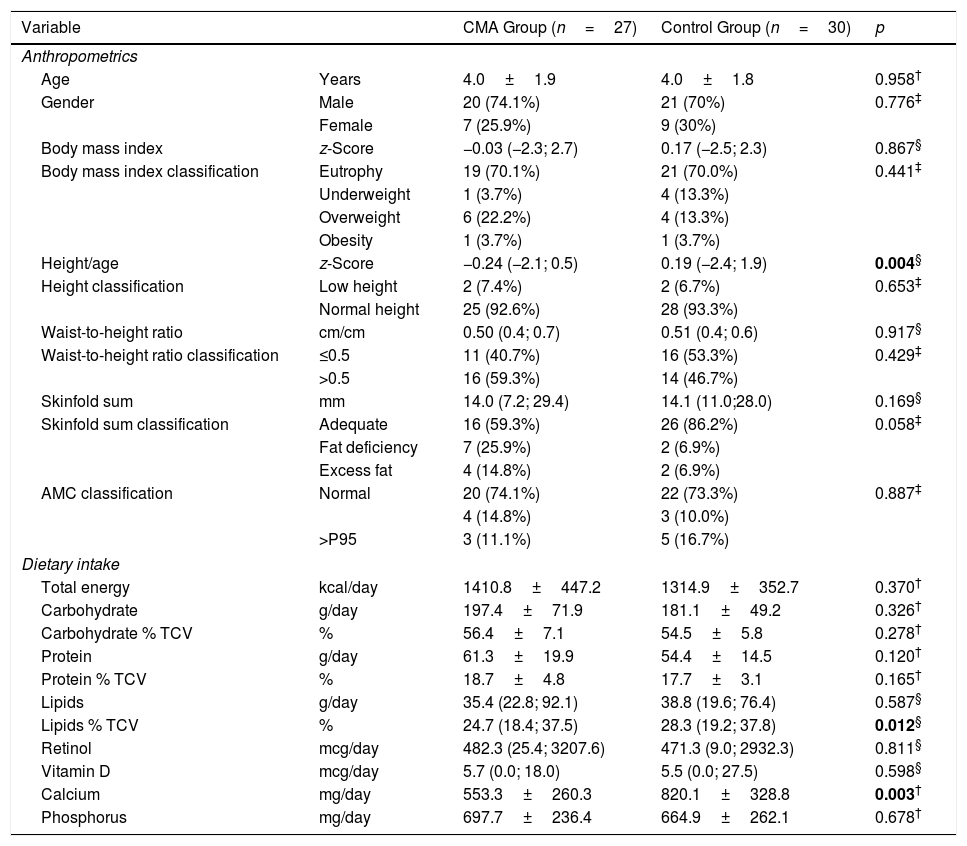
When comparing the groups against the anthropometric and body composition indicators, we observed that children in the CMA group had lower mean values of ZH [−0.24 (−2.1; 0.5) vs. 0.19 (−2.4, 1.9); p=0.0043] (Table 2) compared to the control group.
Comparison of nutritional status and food intake among children with cow's milk allergy (CMA) and non-allergic controls.
| Variable | CMA Group (n=27) | Control Group (n=30) | p | |
|---|---|---|---|---|
| Anthropometrics | ||||
| Age | Years | 4.0±1.9 | 4.0±1.8 | 0.958† |
| Gender | Male | 20 (74.1%) | 21 (70%) | 0.776‡ |
| Female | 7 (25.9%) | 9 (30%) | ||
| Body mass index | z-Score | −0.03 (−2.3; 2.7) | 0.17 (−2.5; 2.3) | 0.867§ |
| Body mass index classification | Eutrophy | 19 (70.1%) | 21 (70.0%) | 0.441‡ |
| Underweight | 1 (3.7%) | 4 (13.3%) | ||
| Overweight | 6 (22.2%) | 4 (13.3%) | ||
| Obesity | 1 (3.7%) | 1 (3.7%) | ||
| Height/age | z-Score | −0.24 (−2.1; 0.5) | 0.19 (−2.4; 1.9) | 0.004§ |
| Height classification | Low height | 2 (7.4%) | 2 (6.7%) | 0.653‡ |
| Normal height | 25 (92.6%) | 28 (93.3%) | ||
| Waist-to-height ratio | cm/cm | 0.50 (0.4; 0.7) | 0.51 (0.4; 0.6) | 0.917§ |
| Waist-to-height ratio classification | ≤0.5 | 11 (40.7%) | 16 (53.3%) | 0.429‡ |
| >0.5 | 16 (59.3%) | 14 (46.7%) | ||
| Skinfold sum | mm | 14.0 (7.2; 29.4) | 14.1 (11.0;28.0) | 0.169§ |
| Skinfold sum classification | Adequate | 16 (59.3%) | 26 (86.2%) | 0.058‡ |
| Fat deficiency | 7 (25.9%) | 2 (6.9%) | ||
| Excess fat | 4 (14.8%) | 2 (6.9%) | ||
| AMC classification | Normal | 20 (74.1%) | 22 (73.3%) | 0.887‡ |
| 4 (14.8%) | 3 (10.0%) | |||
| >P95 | 3 (11.1%) | 5 (16.7%) | ||
| Dietary intake | ||||
| Total energy | kcal/day | 1410.8±447.2 | 1314.9±352.7 | 0.370† |
| Carbohydrate | g/day | 197.4±71.9 | 181.1±49.2 | 0.326† |
| Carbohydrate % TCV | % | 56.4±7.1 | 54.5±5.8 | 0.278† |
| Protein | g/day | 61.3±19.9 | 54.4±14.5 | 0.120† |
| Protein % TCV | % | 18.7±4.8 | 17.7±3.1 | 0.165† |
| Lipids | g/day | 35.4 (22.8; 92.1) | 38.8 (19.6; 76.4) | 0.587§ |
| Lipids % TCV | % | 24.7 (18.4; 37.5) | 28.3 (19.2; 37.8) | 0.012§ |
| Retinol | mcg/day | 482.3 (25.4; 3207.6) | 471.3 (9.0; 2932.3) | 0.811§ |
| Vitamin D | mcg/day | 5.7 (0.0; 18.0) | 5.5 (0.0; 27.5) | 0.598§ |
| Calcium | mg/day | 553.3±260.3 | 820.1±328.8 | 0.003† |
| Phosphorus | mg/day | 697.7±236.4 | 664.9±262.1 | 0.678† |
Bold values indicate p<0,05.
Regarding dietary intake (Table 2), we observed that children in the CMA group had lower calcium intakes (553.3±260.3mg vs. 820.1±328.8mg; p=0.003) and percentage of lipids compared to the control group, considering the total caloric value [24.7% (18.4; 37.5) vs. 28.3% (19.2; 37.8); p=0.0123]. Both groups showed vitamin D intake below recommended values albeit with no significant difference [CMA group 5.7mcg (0.0; 18.0) and control group 5.5mcg (0.0; 27.5); p=0.598].
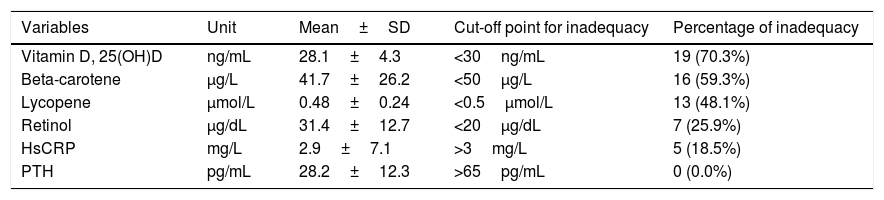
The mean and percentage of serum inadequacy of micronutrients, hsCRP and PTH of the CMA group are shown in Table 3. No children evidenced hyperparathyroidism and 25(OH)D deficiency, nor was there a difference between serum levels of 25(OH)D and the seasons of the year in which collection was performed (p=0.072). HsCRP correlated inversely with serum retinol concentrations (r=−0.462, p=0.015).
Plasma concentrations of vitamin D, beta-carotene, lycopene, retinol, hsCRP and PTH in the group of children with cow's milk allergy (N=27).
| Variables | Unit | Mean±SD | Cut-off point for inadequacy | Percentage of inadequacy |
|---|---|---|---|---|
| Vitamin D, 25(OH)D | ng/mL | 28.1±4.3 | <30ng/mL | 19 (70.3%) |
| Beta-carotene | μg/L | 41.7±26.2 | <50μg/L | 16 (59.3%) |
| Lycopene | μmol/L | 0.48±0.24 | <0.5μmol/L | 13 (48.1%) |
| Retinol | μg/dL | 31.4±12.7 | <20μg/dL | 7 (25.9%) |
| HsCRP | mg/L | 2.9±7.1 | >3mg/L | 5 (18.5%) |
| PTH | pg/mL | 28.2±12.3 | >65pg/mL | 0 (0.0%) |
hsCRP, high sensitivity C-reactive protein; PTH, parathormone.
In the CMA group, there was no statistically significant association between serum concentrations of retinol, beta-carotene, lycopene and 25(OH)D with age, age at onset of symptoms and diagnosis, disease time, sun exposure, anthropometric and body composition indicators. There was also no difference in these concentrations against the main symptoms related to CMA.
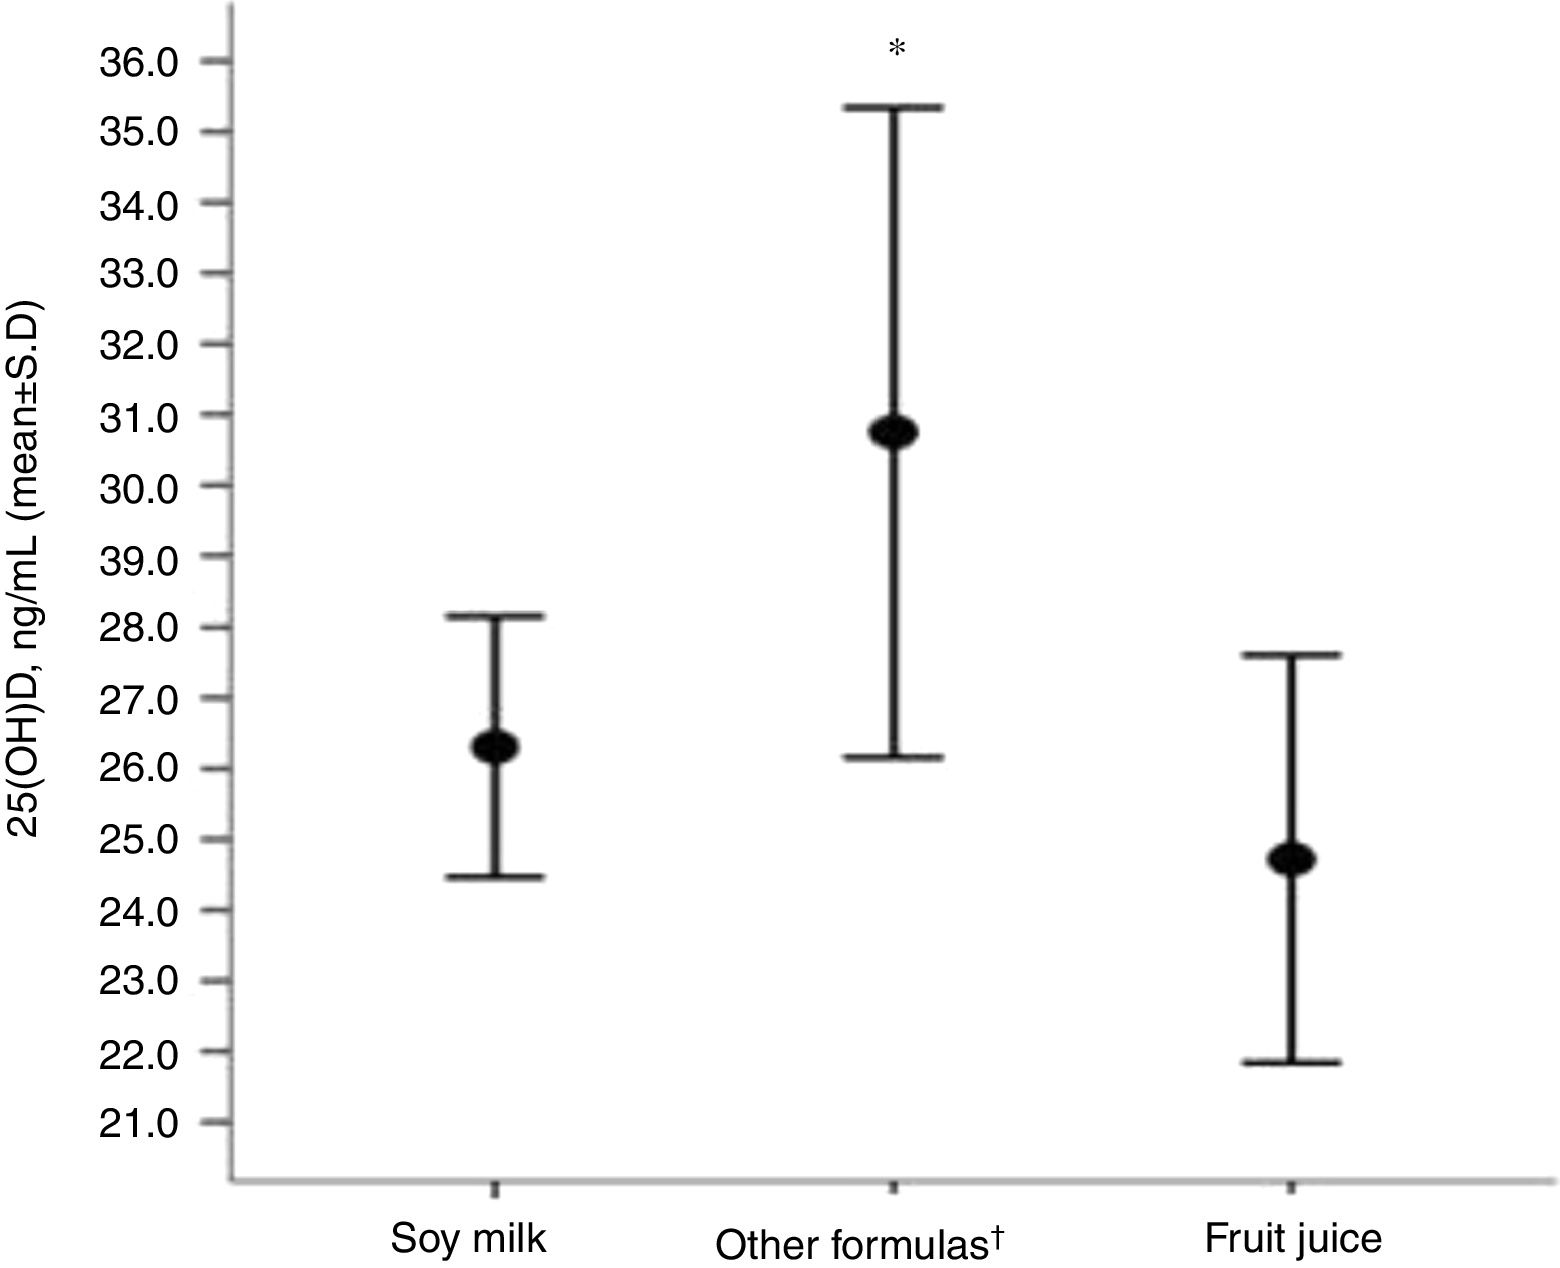
Children receiving original soy milk and fruit juices (natural or processed, replacing CM) had lower serum concentrations of 25(OH)D compared to the group that received other formulas (soy [soy infant based formula or soy powder-based product], hydrolyzed and amino acids) (Fig. 1).
![Distribution of (25(OH)D) concentrations regarding the type of cow's milk substitute used by the group of children with allergies (N=27). *Level of significance of the ANOVA test for three rungs (p=0.005). †Other formulas (soy [soy infant based formula or soy powder-based product], hydrolyzed and amino acids).](https://static.elsevier.es/multimedia/03010546/0000004700000006/v1_201910180738/S0301054619300485/v1_201910180738/en/main.assets/gr1.jpeg?xkr=ue/ImdikoIMrsJoerZ+w997EogCnBdOOD93cPFbanNe5umqYt0zKZP4SYniTZ7+SgZrkCgayp3MRA1ovxa2vU+g1+Wk4Ya+egBXSasB59KyDlZnvAwqc6+sGOH/QezKg8u/pM/4PasCFQGM8znvgCPB5tN2i0hne+SRzkRJRdJ5QAFGBbjFp+HIZb7bb8hlxi3Yt8KZenDMwZs48I7GTRP53T+QyzIRpXmHloYi/F9rjQ5n5sB/jm8pRMBFWnxUuT/MJXhhhOm48cMMDXQbQzDWETaWpyYh7TXjX3iFU8jzGj0UaA+4xxmcdb9odWm8G "Distribution of (25(OH)D) concentrations regarding the type of cow's milk substitute used by the group of children with allergies (N=27). *Level of significance of the ANOVA test for three rungs (p=0.005). †Other formulas (soy [soy infant based formula or soy powder-based product], hydrolyzed and amino acids).")
Distribution of (25(OH)D) concentrations regarding the type of cow's milk substitute used by the group of children with allergies (N=27).
*Level of significance of the ANOVA test for three rungs (p=0.005).
†Other formulas (soy [soy infant based formula or soy powder-based product], hydrolyzed and amino acids).
This study showed that the food intake of children with CMA was similar to that of healthy children concerning energy and macronutrients, except for the percentage of lipids. Calcium intake and height z-score were lower in the CMA group compared to the control group.
A retrospective study that evaluated anthropometry and dietary intake of American schoolchildren with CMA, based on single 24-h recall, showed that children with CMA were smaller and had lower calcium intake compared to healthy controls. Consumption of energy, protein, fat and vitamin D, although lower in the CMA group, did not show a statistically significant difference.7
A non-randomized and controlled intervention study aimed at evaluating the impact of dietary counseling on the dietary intake of children with food allergy in Italy (ages between 6 and 36 months), analyzing food records of three consecutive days, described that allergic children had a lower intake of energy, protein and calcium compared to the control group, in the pre-counseling stage.22
In Brazil, only two studies evaluating the food intake of infants with CMA were performed, both using only a 24-h recall.8,9 One of these studies was conducted before the protocol of the State of São Paulo, which ensures the free distribution of CM substitute formulas for infants with CMA. The CM-free diet group had lower intakes of energy, proteins, lipids, calcium and phosphorus compared to control. The mean z-scores for height and height-for-age were also lower in the CM-free diet group.8
Our study was the first to evaluate the food intake of preschoolers with CMA using a non-consecutive three-day food recording covering one day of the weekend to achieve more reliable information on dietary intake.
Preschoolers have a slower growth rate compared to infants and specific feeding behaviors, such as food selectivity that, together with a failure to receive adequate CM substitutes, puts them at higher nutritional risk.23 However, we did not identify differences in macro and micronutrient consumption between CMA and control groups, save for fat and calcium. It should be noted that the method used for the evaluation of consumption does not provide, for example, for the discrimination of the sources of protein intake (proteins of high biological value vs. other protein sources). It is known that the consumption of proteins of high biological value has an impact on the growth rate of children,24 which may explain our findings of shorter height in the CMA group, also found by Tuokkola et al., who identified a lower growth rate in children with CMA compared to the control group.4
The most commonly used CM substitutes in our study were soy-based products (formulas, powdered products or original beverages). Children above the age of two do not benefit from the free formula distribution program in the State of São Paulo, so there is concern about the consumption of soy milks not enriched with calcium and vitamin D. In our work, of the nine children who consumed original soy milk, four adopted a drink without calcium or vitamin D supplementation, which have a lower cost. Also, the use of fruit juice instead of CM does not ensure, in particular, the recommended amounts of protein and calcium.
Vassallo and Camargo hypothesized that vitamin D deficiency might contribute to increased intestinal permeability at some point in life, such as in the postnatal period, leaving the immune system excessively and inadequately exposed to food allergens.25
Other studies have investigated the relationship between vitamin D concentrations and the occurrence of allergic diseases, associating their deficiency with the risk of sensitization to food allergens.26,27
The 25(OH)D insufficiency was found in about two-thirds of the children with CMA assessed. Regarding the evaluation of serum 25(OH)D levels in food allergy, a controlled study with Brazilian infants and another with Chinese preschoolers found 25(OH)D insufficiency in 25.5% and 51% of children with CMA and 23% and 43% in controls, respectively.28,29
Vitamin A's role in the development of food allergy is uncertain. It is known that it participates in the immune system and cell differentiation; furthermore, it may play a role in tolerance to dietary proteins.32
A study that aimed to evaluate the effect of the exclusion diet in children with food allergy on plasma concentrations of antioxidant vitamins evidenced retinol concentrations higher than the control group.33 In contrast, in our study, beta-carotene and retinol deficiency was observed in around 60% and 25%, respectively. The lack of further studies in the literature on vitamin A and food allergy hinders comparison with our results.
Some hypotheses may be raised to explain our findings regarding vitamin A: prevailing preschooler's age, use of non-vitamin A-enriched CM substitute, and the presence of inflammation. We emphasize that there was a significant inverse correlation between serum retinol levels and hsCRP.
Vitamin A concentrations are reduced in inflammatory processes due to the deviation of protein synthesis, where a high consumption of antioxidants and heightened oxidative stress caused by inflammation and infection can lead to depletion in the stocks of this micronutrient.30,31,34
This study has some limitations, such as being a cross-sectional model and the lack of biochemical analyses in the control group, which prevents us from identifying whether healthy children have less vitamin A and D deficiency or not compared to children with CMA.
In conclusion, our study found that children with CMA were smaller and consumed lower amounts of fat and calcium than healthy controls. There was also a high prevalence of insufficiency or deficiency of micronutrients with a role in the immune system, such as vitamins A and D. These findings emphasize the relevance of individual nutritional monitoring, especially of preschoolers with CMA, in order to ensure adequate nutrient intake and growth.
FundingThis work was self-funded by the researchers.
Authors’ contributionRenata M. Boaventura: data collection, bibliographic review and article elaboration.
Raquel B. Mendonça: bibliographic review and review of the article.
Fernando Affonso Fonseca: laboratory analysis.
Marcia Mallozi: revision of the article.
Fabiola Suano Souza: statistical analysis and revision of the article.
Roseli O.S. Sarni: orientation and revision of the article.
Conflict of interestRenata Magalhães Boaventura, Raquel Bicudo Mendonça, Fernando Affonso Fonseca, Marcia Mallozi, Fabiola Suano Souza and Roseli Oselka Saccardo Sarni, authors of the manuscript entitled “Nutritional status and food intake of children with cow's milk allergy” declare that they do not have any financial, commercial, political, academic and personal conflicts of interest.
We are grateful to the Coordination for the Improvement of Higher Education Personnel (CAPES) for the scholarship granted.
