


The present study aimed to discover more potential genes associated with the pathogenesis of asthma.
MethodsThe microarray data of GSE67940 was downloaded from the Gene Expression Omnibus database. Differentially expressed genes (DEGs) were identified in bronchial alveolar lavage cells from patients with mild-moderate asthma (notSA) and severe asthma (SA) compared with normal controls (NC), respectively. Functional and pathway enrichment analysis, protein–protein interaction (PPI) network analysis were performed upon the identified up- and down-regulated DEGs. Besides, the gene association network based on the common up-regulated and down-regulated genes was generated and transcriptional regulatory pairs of overlapping DEGs in the PPI network were identified.
ResultsA total of 104 DEGs (30 up- and 74 down-regulated genes) were identified in notSA vs. NC. Additionally, 2796 DEGs were screened out in SA vs. NC group, including 320 up-regulated DEGs, and 135 down-regulated DEGs. Specially, 41 overlapping DEGs were screened out in notSA vs. NC and SA vs. NC, including 16 common up-regulated genes and 25 common down-regulated genes. No pathways were enriched by the DEGs in notSA vs. NC. DEGs in SA vs. NC were associated with cytokine–cytokine receptor interaction. VEGFA was a hub protein in both the PPI networks of DEGs in notSA vs. NC and SA vs. NC. Gene association network showed that signalling pathways and cytokine–cytokine receptor interaction were involved in. The overlapping VEGFA, and IFRD1, and ZNF331 were regulated by more TFs.
ConclusionGenes such as VEGFA, and IFRD1, and ZNF331 may be associated with pathogenesis of asthma.
Asthma is a heterogeneous and chronic relapsing lung disease with a broad spectrum of phenotypes ranging from mild to severe disease.1 Asthma is characterised by varying degrees of chronic inflammation, airway hyper-responsiveness, mucus secretion, remodelling and obstruction.2 Severe asthma differs from mild and moderate persistent asthma because it is often characterised by neutrophilic inflammation in the absence or the presence of classical type-2 T-helper (TH2)-induced eosinophilic inflammation.1 Asthma affects 5-10% of the population in many developed countries and more than 300 million people worldwide.3 The symptoms of most patients with asthma can be well controlled with inhaled corticosteroids and long-acting β2-agonists.4 However, these therapies do not treat the underlying cause of asthma and may have serious side effects when used in the long term and in children. Thus, gaining more insights into the molecular mechanisms and the identification of novel and effective treatment for patients with asthma remain a high priority.
The pathogenesis of asthma is complex and varies in different clinical phenotypes and endotypes.5 For instance, Jiang et al. showed that allergic asthma was associated with an increase in endogenous reactive oxygen species (ROS) formation, leading to oxidative stress and finally inducing damage to the respiratory system.6 Recently, there is mounting evidence indicating that asthma is a polygenic disease and the complexity of this disease originates from interaction of an number of genes and environmental factors.7,8 Ober reviewed several important early-life exposures which influenced asthma risk trajectories and suggested that a portion of the genetic risk for asthma was caused by genotype-specific responses to environmental exposures such as lipopolysaccharide (LPS) throughout life.9 Other studies have also reviewed that gene–environment interactions studies help in validating the findings of genome-wide association studies and present great opportunities for better understanding the pathogenesis of asthma.10,11 In recent years, the development of high-throughput microarray technologies offers opportunities to explore the global gene expression profiles of asthma and leads to the identification of new genes and pathways associated with asthma. For instance, researchers have applied microarrays to screen out possible regulators of asthmatic airway inflammation such as ARG1,12ADAM8,13 and SPRR2.14 Recently, Tölgyesi et al. reported that an altered paraoxonase-1 (PON1) activity might be involved in the pathogenesis of asthma.15 However, most asthma-associated genes remain to be elucidated.
Selection of asthma-relevant tissues, such as bronchial alveolar lavage (BAL) and bronchial epithelial cells (BEC), may be required to discover functional genes or pathways underlying asthma risk.16 In this study, we downloaded the microarray data of GSE67940 from a public database, which was initially used for expression quantitative trait loci (eQTL) analysis of asthma genes performed in cells from human BEC and BAL from the Severe Asthma Research Program (SARP) cohort.16 Using the downloaded dataset, we screened the differentially expressed genes (DEGs) in BAL cells from patients with mild-moderate asthma and severe asthma compared with normal controls, respectively. Functional and pathway enrichment analysis, protein–protein interaction (PPI) network analyses were carried out upon the identified up- and down-regulated DEGs. Besides, the gene association network based on the common up-regulated and down-regulated genes was generated and transcriptional regulatory pairs of overlapping DEGs in the PPI network were identified. The objective of the current study was to identify more possible targets associated with the pathogenesis of asthma.
Materials and methodsMicroarray dataThe Gene Expression Omnibus (GEO) repository at the National Center for Biotechnology Information (NCBI) (publicly accessible at http://www.ncbi.nlm.nih.gov/geo/) is the largest fully public database for efficient capture, storage and retrieval of high-throughput molecular abundance data, primarily gene expression data.17 In this study, the microarray profiles of asthma were downloaded from the GEO database under the accession number of GSE67940, which was deposited by Li et al.16 The platform is GPL6480, Agilent-014850 Whole Human Genome Microarray 4x44K G4112F (Probe Name version). As the original studies described,16,18 primary human BAL cells were isolated from patients with mild-moderate asthma (notSA), patients with severe asthma (SA) and normal controls (NC) by bronchoscopy with endobronchial epithelial brushing. More details and information of the patients and controls from the SARP cohort from who BAL cells were obtained could be derived from the study of Li et al.16 Briefly, BAL fluids were spun down on 4000g for 10min and 0.5-1×10⁶ cells were suspended in Qiazol solution. RNA extraction was performed using the QIACube system (Qiagen Inc., Valencia, CA, USA). RNA quality was determined with the Agilent Bioanalyzer 2100 (Agilent Technologies Inc., Santa Clara, CA, USA). Only samples with an RNA integrity number (RIN) higher than 7 were used for microarray experiments. In the present study, the dataset consisting of 43 notSA samples, 30 SA samples, and 31 NC samples, was used in the follow-up analysis.
Data pre-processing and DEGs screeningThe raw data were downloaded and the probe ID was annotated with gene symbol based on the annotation information. In the case, those redundant probes were removed from the analysis. Meanwhile, if there was more than one probe hybridising to the same gene, the expression values of all probes were averaged for the gene and defined as the mRNA expression value. Finally, 19596 gene expression values were achieved.
The DEGs in notSA vs. NC and SA vs. NC were identified using non-paired t-test based on the linear models for microarray data (Limma) package19 in Bioconductor. Only the genes with |log2 of fold change (FC)|>0.5 and P<0.05 were selected as DEGs. VennPlex is a program for comparing lists of genes derived from multiple and highly complex biological data sets, easy to distinguish and specifically filter.20 In special, VennPlex is able to draw multiple circle sets and present the patterns such as commonly or contra-regulated genes in each intersection.20 Contra-regulated genes are those that are up-regulated in one group but down-regulated in another group. In this study, a Venn diagram was constructed using VennPlex for a visual representation of common and uniquely altered genes in notSA vs. NC and SA vs. NC.
Pathway and function enrichment analysisTo analyse the identified DEGs at the functional level, Gene Ontology (GO) and Kyoto Encyclopaedia of Genes and Genomes (KEGG) pathway enrichment analysis was conducted for all the up-regulated and down-regulated genes in notSA vs. NC and SA vs. NC, using the Database for Annotation, Visualization and Integration Discovery (DAVID) online software.21 Significant GO terms or KEGG pathways that were enriched by more than 2 DEGs with P value <0.05 were thus selected.
PPI network constructionThe Search Tool for the Retrieval of Interacting Genes (STRING, http://string-db.org/) database is a precomputed global resource which provides uniquely comprehensive coverage and holds predicted, experimental, and transferred interactions, as well as interactions obtained through text mining.22 In this study, the PPI networks of DEGs in notSA vs. NC and SA vs. NC were constructed using the STRING online tool with a confidence score of 0.400 (considered ‘medium confidence’) and were plotted by using Cytoscape software (available at http://www.cytoscape.org/).23
Gene association network constructionThe GeneMANIA Cytoscape plugin (http://www.genemania.org/) was applied to create gene association networks.24 The GeneMANIA tool uses available evidence from a very large set of functional association data, including physical interactions, genetic interactions, co-expression, predictions, pathways, co-localisation, predicted and shared protein domain, to construct a network of genes related to the genes input into the model.24 In this study, to determine if similar gene set associations were evident for the common DEGs both in notSA vs. NC and SA vs. NC with gene-network model approaches, we input the common up-regulated and down-regulated gene into the online tools GeneMANIA.24 Besides, the pathways that the significantly associated genes were enriched in were identified.
Identification of transcriptional regulatory interactionThe Encyclopedia Of DNA Elements (ENCODE, http://genome.ucsc.edu/ENCODE/) Consortium aims to provide comprehensive annotations of all functional elements in the human genome.25 In this study, the information of the known human transcription factor (TF) binding sites were extracted from the ENCODE project.25 Specially, in order to improve the reliability of the TF binding sites, the repeatability of every TF binding site was analysed, and the TF binding site which appeared in more than two independent samples was chosen for further analysis. Then, all the TFs binding to the gene promoter regions (1.5kb around the transcription start site (TSS) to with 1kb upstream and 0.5kb downstream) were screened out. The TF-gene pairs were then identified. Finally, we extracted the TF-DEGs (those DEGs were confined to the overlapping DEGs identified in the PPI network) pairs from the TF-gene pairs.
ResultsScreening of DEGsA total of 104 genes were found to be differentially expressed in notSA vs. NC, among which 30 were up-regulated and 74 were down-regulated. On the other hand, a total of 2796 DEGs were screened out in SA group compared with NC group, including 320 up-regulated DEGs, and 135 down-regulated DEGs. The Venn diagram comparison of regulated genes between notSA vs. NC and SA vs. NC was shown in Fig. 1. From the results, we found that 41 overlapping DEGs were screened out in notSA vs. NC and SA vs. NC, including 16 common up-regulated genes and 25 common down-regulated genes, which may be significantly associated with the pathogenesis of asthma.
 identified in notSA vs. NC and SA vs. NC are indicated in yellow and blue circles, respectively. The genes regulated in common are represented in the region of interaction between yellow and blue circles.")
Venn diagram comparison of regulated genes between notSA vs. NC and SA vs. NC. Differentially expressed genes (DEGs) identified in notSA vs. NC and SA vs. NC are indicated in yellow and blue circles, respectively. The genes regulated in common are represented in the region of interaction between yellow and blue circles.
GO terms [biological processes (BP), cellular component (CC), molecular function (MF) categories] and KEGG pathways of the significantly up-regulated and down-regulated genes in notSA vs. NC as well as SA vs. NC were summarised in Fig. 2A and B. The results showed that no pathways were enriched by the DEGs in notSA vs. NC. By contrast, the up-regulated DEGs in SA vs. NC were significantly in three pathways, including hsa04060:Cytokine–cytokine receptor interaction, hsa00591:Linoleic acid metabolism, and hsa05200:Pathways in cancer. The down-regulated DEGs in SA vs. NC were significant in three pathways, namely, hsa05212:Pancreatic cancer, hsa04012:ErbB signalling pathway, and hsa04060:Cytokine–cytokine receptor interaction.
 terms and pathways of DEGs. (A) The GO terms and pathways of up-regulated and down-regulated genes in notSA vs. NC. (B) The GO terms and pathways of up-regulated and down-regulated genes in SA vs. NC. BP, biological processes; CC, cellular component; MF, molecular function; KEGG, Kyoto Encyclopedia of Genes and Genomes.")
The enriched Gene Ontology (GO) terms and pathways of DEGs. (A) The GO terms and pathways of up-regulated and down-regulated genes in notSA vs. NC. (B) The GO terms and pathways of up-regulated and down-regulated genes in SA vs. NC. BP, biological processes; CC, cellular component; MF, molecular function; KEGG, Kyoto Encyclopedia of Genes and Genomes.
Based on STRING database, the PPI networks were constructed as shown in Figs. 3 and 4. The PPI network of DEGs in notSA vs. NC consisted of 24 nodes (proteins) and 21 edges (interactions) (Fig. 3). Among these gene nodes, Vascular Endothelial Growth Factor A (VEGFA) had the higher connectivity degrees in the PPI network (n=4). By contrast, the PPI network of DEGs in SA vs. NC comprised 242 nodes and 469 edges (Fig. 4). Thereinto, the top 10 DEGs with higher node degree were VEGFA (degree=24), Early Growth Response 1 (EGR1) (degree=21), V-Kit Hardy-Zuckerman 4 Feline Sarcoma Viral Oncogene Homolog (KIT) (degree=16), Chemokine (C–C Motif) Ligand 19 (CCL19) (degree=16), Interleukin 2 (IL2) (degree=15), Wingless-Type MMTV Integration Site Family, Member 5A (WNT5A) (degree=14), Opioid Receptor, Kappa 1 (OPRK1) (degree=14), CAMP Responsive Element Modulator (CREM) (degree=14), Nitric Oxide Synthase 2, Inducible (NOS2) (degree=14), Chemokine (C-X-C Motif) Receptor 5 (CXCR5) (degree=14), Erb-B2 Receptor Tyrosine Kinase 4 (ERBB4) (degree=13).
 network of DEGs identified in notSA vs. NC. Upper triangular node stands for up-regulated DEGs, while lower triangular node stands for down-regulated DEGs.")

The gene association network based on the common up-regulated and down-regulated genes was presented in Fig. 5. A total of 102 gene pairs with co-expression, 22 gene pairs with physical interactions, 40 gene pairs with genetic interactions, and 13 with co-localisation were identified. In addition, those associated genes were mainly involved in the pathways such as signalling pathways, cytokine–cytokine receptor interaction, generic transcription pathway, IL3-mediated signalling events, Jak-STAT signalling pathway, Jak-STAT signalling pathway.

Protein network analyses based on the common DEGs using GeneMANIA predictions. Upper triangular node and lower triangular node indicate up-regulated DEGs and down-regulated DEGs, respectively. Grey circular node refers to proteins known to physically interact with other proteins but that were not identified to be differentially expressed in the samples. Grey diamond-shaped node represents the pathways that the genes were involved in.
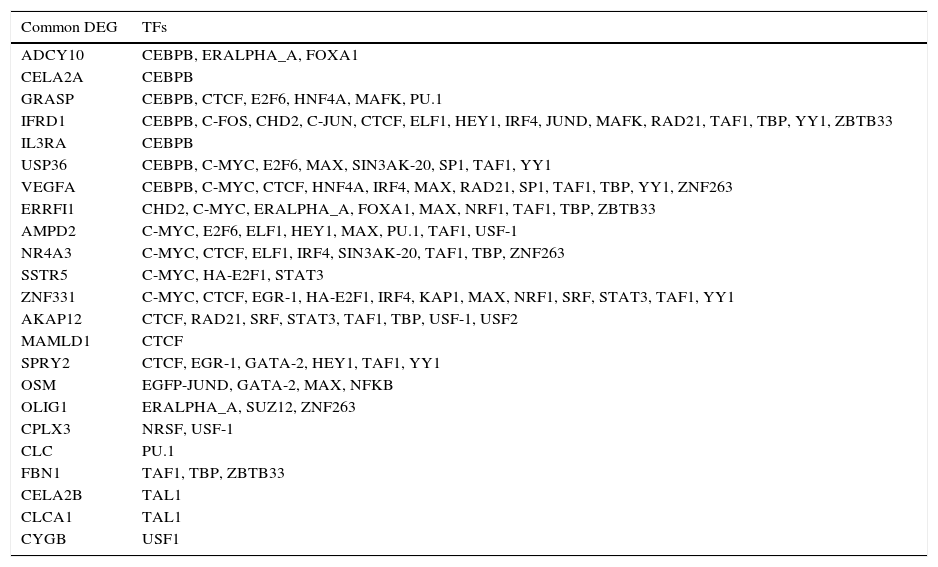
The TFs that could regulate the overlapping DEGs appeared in the PPI network were shown in Table 1. A total of 23 overlapping DEGs were found to be regulated by one or more TFs. Thereinto, Interferon-Related Developmental Regulator 1 (IFRD1) (down-regulated), VEGFA (down-regulated) and Zinc Finger Protein 331 (ZNF331) (down-regulated) were regulated by more TFs.
The overlapping DEGs and the predicted transcription factors.
| Common DEG | TFs |
|---|---|
| ADCY10 | CEBPB, ERALPHA_A, FOXA1 |
| CELA2A | CEBPB |
| GRASP | CEBPB, CTCF, E2F6, HNF4A, MAFK, PU.1 |
| IFRD1 | CEBPB, C-FOS, CHD2, C-JUN, CTCF, ELF1, HEY1, IRF4, JUND, MAFK, RAD21, TAF1, TBP, YY1, ZBTB33 |
| IL3RA | CEBPB |
| USP36 | CEBPB, C-MYC, E2F6, MAX, SIN3AK-20, SP1, TAF1, YY1 |
| VEGFA | CEBPB, C-MYC, CTCF, HNF4A, IRF4, MAX, RAD21, SP1, TAF1, TBP, YY1, ZNF263 |
| ERRFI1 | CHD2, C-MYC, ERALPHA_A, FOXA1, MAX, NRF1, TAF1, TBP, ZBTB33 |
| AMPD2 | C-MYC, E2F6, ELF1, HEY1, MAX, PU.1, TAF1, USF-1 |
| NR4A3 | C-MYC, CTCF, ELF1, IRF4, SIN3AK-20, TAF1, TBP, ZNF263 |
| SSTR5 | C-MYC, HA-E2F1, STAT3 |
| ZNF331 | C-MYC, CTCF, EGR-1, HA-E2F1, IRF4, KAP1, MAX, NRF1, SRF, STAT3, TAF1, YY1 |
| AKAP12 | CTCF, RAD21, SRF, STAT3, TAF1, TBP, USF-1, USF2 |
| MAMLD1 | CTCF |
| SPRY2 | CTCF, EGR-1, GATA-2, HEY1, TAF1, YY1 |
| OSM | EGFP-JUND, GATA-2, MAX, NFKB |
| OLIG1 | ERALPHA_A, SUZ12, ZNF263 |
| CPLX3 | NRSF, USF-1 |
| CLC | PU.1 |
| FBN1 | TAF1, TBP, ZBTB33 |
| CELA2B | TAL1 |
| CLCA1 | TAL1 |
| CYGB | USF1 |
DEG, differentially expressed genes; TFs, transcription factors.
In the current study, a total of 104 DEGs (30 up- and 74 down-regulated genes) were identified in notSA vs. NC. Besides, 2796 DEGs were screened out in SA group compared with NC group, including 320 up-regulated DEGs, and 135 down-regulated DEGs. Specially, 41 overlapping DEGs were screened out in notSA vs. NC and SA vs. NC, including 16 common up-regulated genes and 25 common down-regulated genes. No pathways were enriched by the DEGs in notSA vs. NC. DEGs in SA vs. NC were associated with cytokine–cytokine receptor interaction. VEGFA was a hub protein in both the PPI networks of DEGs in notSA vs. NC and SA vs. NC. Gene association network showed that signalling pathways and cytokine–cytokine receptor interaction were involved. The overlapping VEGFA, and IFRD1, and ZNF331 were regulated by more TFs.
The KEGG pathway enrichment analysis was conducted for all the up-regulated and down-regulated genes in notSA vs. NC and SA vs. NC using DAVID online software. As a result, no pathways were enriched by the DEGs in notSA vs. NC. The up-regulated DEGs and down-regulated genes in SA vs. NC were enriched in different pathways, respectively. On the other hand, the gene association network based on the common (overlapping) up-regulated and down-regulated genes in notSA vs. NC and SA vs. NC using GeneMANIA Cytoscape plugin. As shown in Fig. 5, genes known to physically interact with other genes but that were not identified to be differentially expressed in the samples were also enriched. Thus, pathways in the gene association work was related to both the differentially expressed genes and the non-differentially expressed genes.
In addition, SARP is sponsored by National Heart Lung and Blood Institutes and is a cohort for patients with severe asthma, but also well-balanced with subjects with mild to moderate asthma and healthy controls, including both adults and children.26 In this study, the samples were only obtained from subjects from SARP. Further investigations may be needed to check other subject cohort for determining our findings. The composition of BAL is mixed cell types, including neutrophils, macrophages, lymphocytes and eosinophils, which can reflect the current inflammatory process in the airway.16 Nevertheless, the composition of BAL may vary based on disease status.16 In this study, samples were derived from BAL and we focused on three overlapping DEGs both found in notSA vs. NC and SA vs. NC to exclude the possible effect of the disease status. Undoubtedly, other asthma-relevant tissues could be used to examine whether the genes were tissue-specific.
VEGFA encodes a heparin-binding protein, existing as a disulphide-linked homodimer, and VEGFA can induces proliferation and migration of vascular endothelial cells.27 The findings of Balantic et al. demonstrated that polymorphisms in the VEGFA gene might be associated with asthma treatment outcome.28 Hankinson et al. also showed that variants within the VEGF-A gene were significantly linked with lung function in both children and adults.29 In addition, studies have indicated that VEGF-A play a role in the induction of features of asthma pathogenesis, such as eosinophilic inflammation, airway remodelling, and airway hyper-responsiveness.30 In our study, we found that VEGFA was an overlapping DEG in notSA vs. NC and SA vs. NC. Moreover, VEGFA was a hub protein in the PPI networks and could be regulated by more TFs. From this location, VEGFA may play an essential role associated with the pathogenesis of asthma.
IFRD1 is an immediate early gene which encodes a protein related to interferon-gamma. This protein appears to function as a transcriptional co-activator/repressor which may control the growth as well as differentiation of specific cell types during tissue regeneration and embryonic development.31 The IFRD1 gene, also known as Tis7 (mouse) and PC4 (rat) has been shown as a modified gene for cystic fibrosis lung disease.32 Blanchard et al. used murine and human airway epithelial cell models and suggested that a deficit of Tis7/IFRD1 protein levels in airway cells might play roles in the exaggerated inflammatory airway.33 In line with the previous study, we found that IFRD1 was an overlapping DEG in notSA vs. NC and SA vs. NC. Besides, IFRD1 could be regulated by more TFs. Provisionally, we suggest that the IFRD1 gene might play a key role in the pathogenesis of asthma. However, experimental verifications are needed to check the result.
ZNF331 encodes a zinc finger protein containing a KRAB (Kruppel-associated box) domain found in transcriptional repressors.34ZNF331 was shown to be with the high methylation frequency in colorectal cancer.35 Jiang et al. showed that methylation of ZNF331 could promotes cell invasion and migration in oesophageal cancer.36 However, there are few studies concerning the role of ZNF331 in other diseases. In our study, IFRD1 was an overlapping DEG in notSA vs. NC and SA vs. NC and it could be regulated by more TFs. We suspected that ZNF331 might play a role in the molecular mechanism of asthma, while further investigations are needed to determine its role.
However, our study still had several limitations. Firstly, our study was based on the computational analysis which gives estimated results. This study may be cross-checked by other datasets and practically confirmed using experimental approaches. We intend to perform experimental verification in our further studies. Secondly, further investigations with a larger sample size should be needed.
In conclusion, our study demonstrated several potential key genes (VEGFA, and IFRD1, and ZNF331) associated with the pathogenesis of asthma. We propose that these possible key genes may constitute novel targets for the treatment of asthma, based on their various roles in mucosal permeability to allergens, inflammatory responses and airway remodelling and hyper-responsiveness. Further investigations and experimental verifications with a larger sample size are needed.
Ethical disclosuresConfidentiality of dataThe authors declare that no patient data appears in this article.
Right to privacy and informed consentThe authors declare that no patient data appears in this article.
Protection of human subjects and animalsThe authors declare that no experiments were performed on humans or animals for this investigation.
Conflict of interestAll authors declare that they have no conflict of interests to state.
