


Several pro-inflammatory and anti-inflammatory mediators play a role in the immunopathogenesis of food allergy (FA). The aim of this study was to investigate the utility of serum biomarkers like interleukin (IL)-10, TNF-α, and IL-6 in the diagnosis and/or follow-up of FA.
MethodsSixty (25 females, 41.6%) newly diagnosed FA patients [IgE mediated (group-1, n=37), non-IgE (group-2, n=23)] with a median age of nine (1–33) months were enrolled. Twenty-four healthy children with a median age of eight (1–36) months constituted the control group (CG). In all the subjects, serum TNF-α, IL-6 and IL-10 levels were evaluated at the time of diagnosis and reassessed four weeks after therapeutic elimination diet (TED).
ResultsThe mean white blood cell count and median absolute eosinophile count of the CG were significantly lower than group-1 (p values were 0.019 and 0.006, respectively). The mean absolute neutrophile count and the median IL-6 were significantly higher in group-1 when compared with group-2 (p values were 0.005 and 0.032, respectively. Median TNF-α and IL-6 levels were significantly higher in the pre-TED among all patients (p values were 0.005 and 0.018, respectively). In group-1, median TNF-α and IL-6 levels decreased significantly after TED (p values were 0.01 and 0.029, respectively).
ConclusionsOur findings support the role of inflammation in the pathogenesis of FA. Serum TNF-α and IL-6 levels may be useful markers for follow-up in FA, especially among IgE-mediated FA patients. Evaluation of IL-10 results was not sufficient for an interpretation of clinical tolerance.
Food allergy (FA) represents an important health problem worldwide, and its incidence is increasing, as is that of other atopic diseases.1,2 Although food-related allergies are observed with an incidence of 6% in early childhood, this rate decreases with age, reaching ∼2% in the adult population. Because cow's-milk proteins (CMP) are among the most common proteins that infants encounter, cow's milk allergy (CMA) are quite high in infants.
Immediate reactions following food consumption are mainly IgE dependent and present with cutaneous, intestinal and respiratory symptoms. On the other hand, delayed reactions are mostly related with T-cell dependent mechanisms and can manifest both dermatological and intestinal findings. Food allergies associated with several diseases, such as eosinophilic esophagitis, food protein-induced enterocolitis syndrome, and atopic dermatitis (AD) are not always attributable exclusively to IgE- or non-IgE-mediated mechanisms but may be due to mixed processes.3
The intestinal mucosa, which has a large surface area, plays many roles, such as the passage of antigenic stimulants, the development of tolerance, and the initiation of the immunological response.4 In addition, innate and acquired immune system elements such as natural killer cells, regulatory T cells, and many inflammatory cytokines, including transforming growth factor β1 (TGF β1) and interleukin-10 (IL-10) play important roles in the development of mucosal tolerance.5–7 On the other hand, cytokines such as tumor necrosis factor-α (TNF-α) and prostaglandin E2 initiate the inflammatory process.3 Another important cytokine, IL-6, is a T cell- and macrophage-derived protein with both pro- and anti-inflammatory properties. It plays a significant role in inducing inflammation by increasing the synthesis of acute-phase proteins and neutrophils in bone marrow, while it also aids in the suppression of inflammation by inhibiting TNF-α and IL-1 and by activating IL-10.8 However, the roles of these cytokines in the development of FA remain unclear.
In the suspicion of IgE mediated disorders, laboratory studies such as allergen-spesific IgE and prick/puncture skin test (PST) may be helpful. Hovewer, the absence of reliable testing for non-IgE-mediated food allergy is a matter of concern. Identification of biomarkers that associate with disease pathogenesis and the determination of clinical status is a major point of research in several clinical studies. In order to assess the importance of these inflammatory cytokines in food allergy, and to determine their clinical availability in patients’ diagnosis and clinical follow-up, we evaluated the serum IL-10, TNF-α, IL-6 levels before and after therapeutic elimination diet (TED).
Materials and methodsData sourceSixty patients aged 0–36 months with newly diagnosed FA were enrolled in the study. Thirty-seven were either positive for egg white-specific IgE, cow milk-specific IgE, or both, and were enrolled in the IgE-mediated food allergy group (Group-1). The remaining 23 patients were negative for IgE but had clinical symptoms such as urticaria, vomiting, diarrhea, or bloody stools after consuming certain foods and whose symptoms disappeared after cessation of consumption; these individuals were enrolled in the non-IgE-mediated food allergy group (Group-2).
Diagnostic processDiagnoses were made in accordance with the European Society for Pediatric Gastroenterology Hepatology and Nutrition (ESPGHAN) Gastrointestinal Committee Practical Guidelines (Fig. 1).9 The first step was to perform a thorough review of the medical history of each patient, as well as a physical examination. Family history of atopy, presenting signs and symptoms, physical findings including height and weight measurements were recorded.

We eliminated allergens from the diet of individuals in the patient group who were suffering from anaphylaxis or an immediate (within minutes to 2h) reaction (vomiting, wheezing or stridor, breathing difficulties, urticaria, angioedema, shock-like symptoms with severe metabolic acidosis, vomiting, or diarrhea) after taking food. After amelioration of the symptoms following elimination of the food, the sensitivity of the FA was investigated using specific IgE (cow milk, egg white, codfish, wheat flour, peanut, and soybean). TED was given if the reaction to a specific IgE was positive, and a standardized oral challenge was performed if the test was negative. It was also given if the standardized oral challenge was positive. The diagnosis of FA was excluded in patients in whom the standardized oral challenges were negative.
A diagnostic elimination diet was administered in patients with a history and physical examination findings suggestive of FA but who showed no anaphylaxis or immediate reaction. A standardized oral challenge was performed in patients whose clinical symptoms were improved by the elimination diet. TED was given if the standardized oral challenge was positive. Patients with a negative standardized oral challenge test were not diagnosed with FA and were excluded from the study. Patients were also not diagnosed with FA if they showed no improvement in clinical symptoms during the elimination diet.
During the TED process; allergen foods from the mother's diet were eliminated from those infants who were fed solely with breast milk. As stated in the ESPGHAN guidelines, in patients who were not breast-fed and fed with formula, firstly, hydrolyzate formula was performed, and then, aminoacid-based formula was started in those who did not respond.9
Measuring specific IgE in a blood sample and skin prick tests are useful diagnostic tests during clinical practice in patients of any age; however, the combination of the two tests is not necessary during a routine diagnostic workup.9 Therefore, food sensitivity was investigated using only specific IgE in all patients.
The results were compared with the results for a pediatric group that consisted of 24 healthy children aged between one and 36 months (median, eight months) who had no gastrointestinal complaint and whose cow's milk-specific IgE was found to be negative. Healthy children with no allergic disease, food allergy, or gastrointestinal complaints were selected from the Cerrahpaşa Medical Faculty Well Child Outpatient Clinic and from the children of healthcare workers as the control group.
Laboratory analysisConcentrations of hemoglobin (Hb; g/dL), red blood cell (RBC; 106/mL), white blood cell [(WBC) absolute neutrophile count (ANC), absolute lymphocyte count (ALC) and absolute eosinophile count (AEC); 103/mL)] counts, and hematocrit (%) were measured in the biochemistry laboratory using a Beckman Coulter LH 780 analyzer [Beckman Coulter Inc., Brea, California, USA]. WBC>11×103/mL (leukocytosis), Hb<11g/dl (anemia), AEC>0.45×10³/mL (eosinophilia), ANC<1.5×10³/mL (neutropenia), platelet>400×103/mL (thrombocytosis) limits were accepted.
Specific IgE (cow milk, egg white, codfish, wheat flour, peanut and soybean) was tested using the fluorescent enzyme immunoassay (FEIA) method with a UniCAP device (Phadia Austria GmbH, Vienna, Austria). A specific IgE value>0.35kU/L was considered as positive. Total IgE was measured nephelometrically using a BN2 nephelometer (Siemens, Munich, Germany) and levels were compared with age-based standards. Serum TNF-α, IL-6, and IL-10 levels were measured using an AssayMax Human ELISA kit [Biotech Instruments, Inc. ELX 800, San Francisco, USA].
Complete blood counts, total IgE, serum TNF-α, IL-6, and IL-10 levels were evaluated in both the patients and CG. The same markers were reassessed four weeks after TED in the patient group.
Ethical procedureThis study was performed with the permission of Istanbul University Cerrahpasa Medical Faculty Clinical Research Ethical Committee. Informed consents were taken from both parents of all participants.
Statistical analysisData were analyzed using SPSS 16 software. Categorical data were compared by the χ2 test and Fisher exact test. Normally distributed continuous variables were compared by Student's t test. Mann–Whitney U test was used for continuous variables, which are not normally distributed. Comparison between groups (>2) was analyzed using one-way analysis of variance anova followed by the Tukey HSD post hoc test. Comparison of pre-treatment and post-treatment values were analyzed using Wilcoxon-signed-rank test and Mann–Whitney-U test. A p-value<0.05 was considered to indicate statistical significance.
Receiver operator characteristic (ROC) curve analysis was performed by using the MedCalc 14.8.1 package program to determine the cut-off point of TNF, IL-6, and IL-10 variables in food allergy group estimation.
ResultsPatient characteristicsSixty patients (25 female, 41.6%) [(group-1, n=37; 14 females, 37.8%), (group-2, n=23; 11 females, 47.8%)] with the median age of nine (1–33) months were enrolled in our study. The median age of healthy subjects was eight (1–36) months and nine (37.5%) were male. The median age of patients in group-2 was lower than in group-1 [median four (1–33) months and median 12 (2–33) months, respectively, p=0.01]. The median height for age z score was −0.19 (−3.8 to +2.9) and weight for height z score was −0.26 (−3.08 to +4.6) in all the study cohort. Somatic growth retardation was encountered in seven (11.6%) patients (four patients in group-1, three patients in group-2).
Among all participants, 36 patients had single FA (group-1, n=25 and group-2, n=11) and 24 patients (group-1, n=12 and group-2, n=12) had multiple FAs. In group-1, 22 patients had positive egg-white specific IgE (f1) values, 27 patients had cow's milk specific IgE values (f2), and 12 patients had both positive f1 and f2 values.
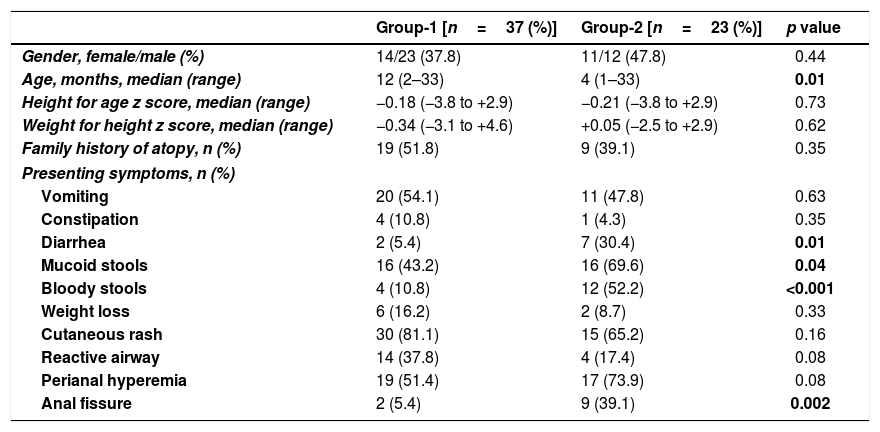
Clinical findingsA history of atopy was present in 46.7% of the patients. The most common presenting symptom was urticarial rash, which was encountered in 45 patients (75%), followed in frequency by perianal hyperemia (n=36, 60%), mucoid stools (n=32, 53.3%), vomiting (n=31, 51.7%), and recurrent wheezing (n=18, 30%). The presence of bloody stools (n=16, 26.7%), diarrhea (n=9, 15%), anal fissure (n=11, 18.3%) weight loss (n=8, 13.3%), and constipation (n=5, 8.3%) were other symptoms. The incidence of diarrhea (n=7, 30.4%), mucoid stools (n=16, 69.6%), bloody stools (n=12, 52.2%), and anal fissure (n=9, 39.1%) in group-2 were all higher than in group-1 (p-values were 0.01, 0.04, <0.001, and 0.002, respectively) (Table 1).
Pre-TED comparison of Group-1 and Group-2.
| Group-1 [n=37 (%)] | Group-2 [n=23 (%)] | p value | |
|---|---|---|---|
| Gender, female/male (%) | 14/23 (37.8) | 11/12 (47.8) | 0.44 |
| Age, months, median (range) | 12 (2–33) | 4 (1–33) | 0.01 |
| Height for age z score, median (range) | −0.18 (−3.8 to +2.9) | −0.21 (−3.8 to +2.9) | 0.73 |
| Weight for height z score, median (range) | −0.34 (−3.1 to +4.6) | +0.05 (−2.5 to +2.9) | 0.62 |
| Family history of atopy, n (%) | 19 (51.8) | 9 (39.1) | 0.35 |
| Presenting symptoms, n (%) | |||
| Vomiting | 20 (54.1) | 11 (47.8) | 0.63 |
| Constipation | 4 (10.8) | 1 (4.3) | 0.35 |
| Diarrhea | 2 (5.4) | 7 (30.4) | 0.01 |
| Mucoid stools | 16 (43.2) | 16 (69.6) | 0.04 |
| Bloody stools | 4 (10.8) | 12 (52.2) | <0.001 |
| Weight loss | 6 (16.2) | 2 (8.7) | 0.33 |
| Cutaneous rash | 30 (81.1) | 15 (65.2) | 0.16 |
| Reactive airway | 14 (37.8) | 4 (17.4) | 0.08 |
| Perianal hyperemia | 19 (51.4) | 17 (73.9) | 0.08 |
| Anal fissure | 2 (5.4) | 9 (39.1) | 0.002 |
TED; therapeutic elimination diet.
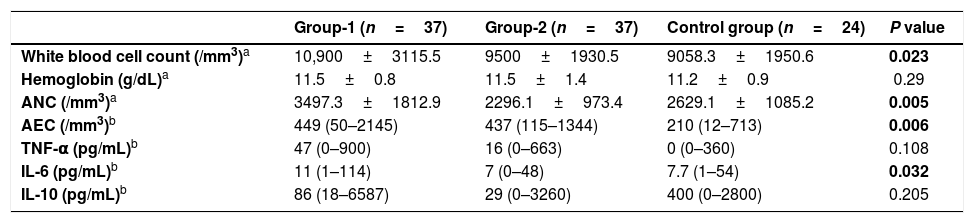
When pre-TED values of all patients and the control group were compared, mean ANC, median AEC and median TNF-α levels were significantly higher in the patients’ group (p values were 0.005, <0.001 and <0.001, respectively).
Comparison of pre-TED values of group-1, group-2 and CG are summarized in Table 2. The mean WBC count of CG was significantly lower than group-1 (p=0.019). The median AEC was significantly lower in the CG when compared with group-1 (p=0.006). The mean ANC and the median IL-6 were significantly higher in group-1 when compared with group-2 (p values were 0.005 and 0.032, respectively).
Comparison of pre-TED values of Group-1 and Group-2 group with control group.
| Group-1 (n=37) | Group-2 (n=37) | Control group (n=24) | P value | |
|---|---|---|---|---|
| White blood cell count (/mm3)a | 10,900±3115.5 | 9500±1930.5 | 9058.3±1950.6 | 0.023 |
| Hemoglobin (g/dL)a | 11.5±0.8 | 11.5±1.4 | 11.2±0.9 | 0.29 |
| ANC (/mm3)a | 3497.3±1812.9 | 2296.1±973.4 | 2629.1±1085.2 | 0.005 |
| AEC (/mm3)b | 449 (50–2145) | 437 (115–1344) | 210 (12–713) | 0.006 |
| TNF-α (pg/mL)b | 47 (0–900) | 16 (0–663) | 0 (0–360) | 0.108 |
| IL-6 (pg/mL)b | 11 (1–114) | 7 (0–48) | 7.7 (1–54) | 0.032 |
| IL-10 (pg/mL)b | 86 (18–6587) | 29 (0–3260) | 400 (0–2800) | 0.205 |
ANC: absolute neutrophil count; AEC: absolute eosinophil count; TED: therapeutic elimination diet; TNF-α: tumor necrosis factor α; IL-6: interleukin 6; IL-10: interleukin 10.
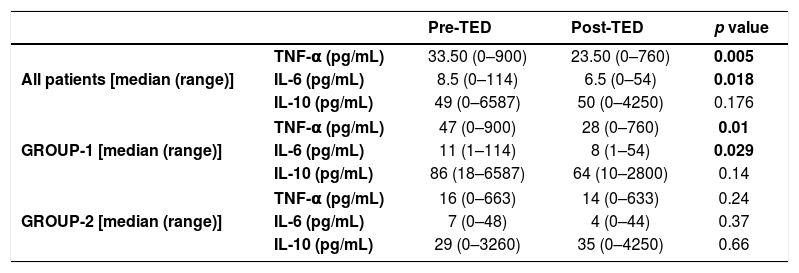
When pre and post-TED values were compared in patients and subgroups (Table 3), separately; median TNF-α and IL-6 levels were significantly higher in the pre-TED among all patients (p values were 0.005 and 0.018, respectively). In group-1, median TNF-α and IL-6 levels decreased significantly afterTED (p values were 0.01 and 0.029, respectively).
Comparison of pre and post-TED values.
| Pre-TED | Post-TED | p value | ||
|---|---|---|---|---|
| All patients [median (range)] | TNF-α (pg/mL) | 33.50 (0–900) | 23.50 (0–760) | 0.005 |
| IL-6 (pg/mL) | 8.5 (0–114) | 6.5 (0–54) | 0.018 | |
| IL-10 (pg/mL) | 49 (0–6587) | 50 (0–4250) | 0.176 | |
| GROUP-1 [median (range)] | TNF-α (pg/mL) | 47 (0–900) | 28 (0–760) | 0.01 |
| IL-6 (pg/mL) | 11 (1–114) | 8 (1–54) | 0.029 | |
| IL-10 (pg/mL) | 86 (18–6587) | 64 (10–2800) | 0.14 | |
| GROUP-2 [median (range)] | TNF-α (pg/mL) | 16 (0–663) | 14 (0–633) | 0.24 |
| IL-6 (pg/mL) | 7 (0–48) | 4 (0–44) | 0.37 | |
| IL-10 (pg/mL) | 29 (0–3260) | 35 (0–4250) | 0.66 | |
TED: therapeutic elimination diet; TNF-α: tumor necrosis factor α; IL-6: interleukin 6; IL-10: interleukin 10.
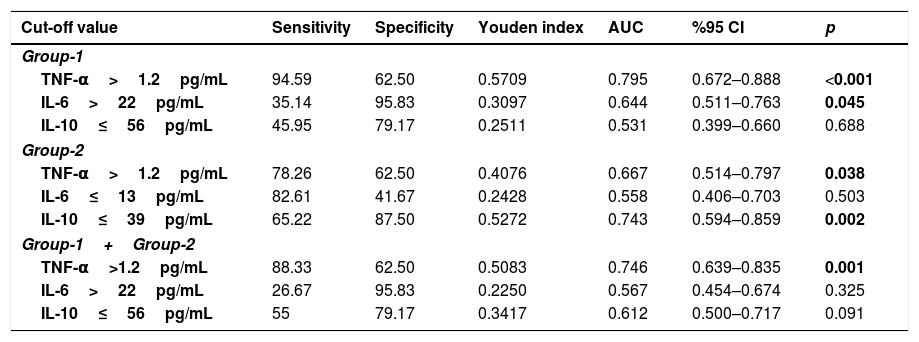
Detailed ROC analysis was given in Table 4. When pre-TED values of TNF-α were evaluated, sensitivity and specificity were 94.59 and 62.5 in group-1, 78.26 and 62.5 in group-2, and 88.33 and 62.5 in all patients for the cut-off value of 1.2pg/mL (p values were <0.001, 0.038 and 0.001, respectively)
The cut-off point values of TNF, IL-6 and IL-10 variables by receiver operator characteristic curve analysis.
| Cut-off value | Sensitivity | Specificity | Youden index | AUC | %95 CI | p |
|---|---|---|---|---|---|---|
| Group-1 | ||||||
| TNF-α>1.2pg/mL | 94.59 | 62.50 | 0.5709 | 0.795 | 0.672–0.888 | <0.001 |
| IL-6>22pg/mL | 35.14 | 95.83 | 0.3097 | 0.644 | 0.511–0.763 | 0.045 |
| IL-10≤56pg/mL | 45.95 | 79.17 | 0.2511 | 0.531 | 0.399–0.660 | 0.688 |
| Group-2 | ||||||
| TNF-α>1.2pg/mL | 78.26 | 62.50 | 0.4076 | 0.667 | 0.514–0.797 | 0.038 |
| IL-6≤13pg/mL | 82.61 | 41.67 | 0.2428 | 0.558 | 0.406–0.703 | 0.503 |
| IL-10≤39pg/mL | 65.22 | 87.50 | 0.5272 | 0.743 | 0.594–0.859 | 0.002 |
| Group-1+Group-2 | ||||||
| TNF-α>1.2pg/mL | 88.33 | 62.50 | 0.5083 | 0.746 | 0.639–0.835 | 0.001 |
| IL-6>22pg/mL | 26.67 | 95.83 | 0.2250 | 0.567 | 0.454–0.674 | 0.325 |
| IL-10≤56pg/mL | 55 | 79.17 | 0.3417 | 0.612 | 0.500–0.717 | 0.091 |
Receiver operator characteristic (ROC) curve analysis was performed using the package program MedCalc 14.8.1 to determine the cut-off point of TNF, IL-6 and IL-10 variables in Group-1 (IgE), Group-2 (non-IgE) and all patients (Group-1+2). p<0.05 was considered statistically significant.
AUC: Area under the ROC curve; CI: Confidence Interval.
Food allergic disorders can be categorized as mediated and not mediated by IgE antibodies (cell-mediated) according to immunopathological mechanisms. While IgE-mediated FA can easily be diagnosed with PST and specific IgE evaluation, the diagnosis of non-IgE disorders is often challenging. Patients with IgE-mediated FA are admitted with a wide spectrum of symptoms including dermatological manifestations, runny nose, recurrent wheezing and anaphylaxis, whereas patients with non-IgE-mediated FA generally present with proctitis or enteropathy in the first months of life.10 Kamer et al.11 in their study on children with IgE-mediated FA, determined that the most common findings belonged to the respiratory tract, followed by skin involvement.
In the study by Meyer et al.12 gastrointestinal symptoms (GIS) such as vomiting, constipation, diarrhea and bloody stools were found to be more frequent in the non-IgE-mediated group. In accordance with these studies, 75% of the patients in our study cohort presented with urticarial rash. The incidences of GIS symptoms such as mucoid stools, bloody stools, diarrhea and anal fissure were found to be higher in the non-IgE-mediated group. Clinical symptoms arose earlier among the patients with non-IgE-mediated FA, similar to the results of the present study.13
Several studies have focused on the effects of cytokines in allergic disorders. For instance, Yesilova et al.14 reported that the cytokines including TNF-α, IL-6, and IL-10 of children with AD was high. They also showed the reducing effect of probiotics on the severity of AD, total serum IGE, and serum IL-6 levels. The same effect was not observed with TNF-α and IL-10. In the present study, the incidence of AD was considerably high. We believe that this may have affected our results.
If we selectively investigate the roles of pre-specified cytokines, TNF-α, released from the mast cells, is an important cytokine for stimulating inflammation in the infectious process and it is also involved in the pathogenesis of allergic inflammation. TNF-α induces the production of T helper-2 (TH2) cytokines and increases the migration of mediators to the inflammatory region.15 Berry et al.16 reported the increased levels of TNF-α in patients with refractory asthma and clinical recovery with etanercept therapy. Similarly, the effect of TNF-α on inflammatory changes in patients with FA has already been described. Semeniuk et al.17 reported increased IL-4 and TNF-α levels in patients with CMA with or without gastroesophageal reflux. Suggesting the presented data, in our study, pre-TED serum TNF-α levels in patients’ group were higher than the control subjects. After four weeks of TED, median values had decreased. This decline was significant among all patients and also in group-1.
In children with CMA, peripheral blood mononuclear cells secrete more TNF-α after a milk challenge test. It was shown that TNF-α together with interferon-γ induces an increase in intestinal permeability.18,19 This phenomenon is especially important in the pathophysiology of non-IgE-mediated FA. Although the pre-TED TNF-α levels in group-2 were not as high as the levels in group-1, they were still higher than in healthy subjects. Moreover, it has been shown that the pattern of TNF-α secretion in response to CMP is different in CMA infants with cutaneous or digestive symptoms.20 Since inflammatory cytokines have generalized effects, systemic manifestations of FA, mainly in the IgE-mediated group, can partially be attributable to those pro-inflammatory cytokines, one being TNF-α. In our study, the systemic presentation was more common in group-1, which was correlated with higher TNF-α levels. Moreover, in the present study, ROC analysis revealed 94.5% sensitivity for TNF-α in the IgE-mediated group, thus supporting the previous results. However, its specificity was 62.5%. This finding is compatible with the presence of many other systemic illnesses affecting TNF-α levels. It has also been postulated that TNF-α release might predict clinical relapse.20 Our findings possess clinical importance since a significant decrease has been observed with TED both in patients’ group and subgroups separately. In this manner, the serum TNF-α level may be used as a marker predicting particularly IgE-mediated FA and it also can be useful in the patients’ follow-up.
Interleukin-6, although its precise role in the immunopathogenesis of FA has not been clearly defined yet, is another critical cytokine with both pro-inflammatory and anti-inflammatory properties. There are scarce data regarding IL-6 levels in patients with FA. In a study by Dang et al.,21 reduced serum IL-6 levels were reported in FA patients similar to IL-10. Dienz et al.22 reported the requirement of IL-6 for IgG1 production of B cells; this may be the reason for decreased IL-6 levels in patients with FA. The same study also claims that reduced IL-6 levels are responsible for ineffective class-switching from IgE to IgG, leading to increased allergic immunoglobulin load. In our study, when the pre-TED period was taken into consideration, serum IL-6 levels were higher in group-1 than in group-2. The more frequent existence of systemic inflammatory response and clinical manifestations in IgE-mediated FA may explain this finding.23 Consistent with this, absolute leukocyte counts were higher in group-1 when compared with group-2 and healthy subjects. Serum IL-6 levels decreased in the patients group and group-1 with four weeks of TED. A similar decline has not been observed among group-2. For this reason, serum IL-6 may especially be helpful for patients with IgE-mediated FA for clinical follow-up.
IL-10 is a multifunctional modulatory cytokine that is mainly involved in the mechanisms of tolerance development.24 It is capable of inhibiting both Th1 and Th2-like cytokine responses, a variety of immune effector mechanisms and expression of inflammatory or autoimmune disorders. It can downregulate the expression of the IgE receptor and its signal molecules and also induce the generation of IgG4 which acts as a stopper antibody.25 Several studies demonstrated gene polymorphisms and decreased expression of IL-10 levels in patients with FA.26,27 Alonso et al.28 propose the use of constitutive serum IL-10 levels as a marker of clinical tolerance in hazelnut allergy. They suggest that serum IL-10 levels greater than 2.28pg/ml were a diagnostic of clinical tolerance, with this approach exhibiting sensitivity of 82% and specificity of 70%. Among healthy subjects, the median serum IL-10 level was 400pg/mL (range, 0–2800pg/mL). Although this level was higher than the patients’ group, group-1 and group-2 separately, the difference was statistically significant for only group-2. Neither of the patient groups presented an increase in serum IL-10 levels after TED.
Although IL-10 is clearly an important component of immune regulation, since the wide variety of innate and adaptive immune cells produce IL-10 and there is an extensive range of environmental stimuli, it is unlikely for IL-10 to discriminate clinical tolerance by itself. It can be used as a supportive finding together with other clinical and laboratory markers. Furthermore, contrary to reported data, several studies found no difference between IL-10 plasma levels in clinically tolerant versus penicillin-allergic subjects and increased, rather than reduced, IL-10 levels were evident amongst patients presenting with acute anaphylaxis.29 This issue also limits the use of IL-10 as a biomarker for patients with FA. Nevertheless, the result of the study by Frossard et al.30 in the past decade provides that bioengineered microorganisms, the Lactococcus lactis strain in that case, which deliver IL-10 to intestinal mucosa can decrease the incidence of food-induced anaphylaxis. This finding can provide a path for therapeutic approach.
The major limitation of the present study was the small number of patients and the limitation of the evaluated cytokines. Food allergy pathogenesis can show variations according to the spesific allergen and the involved organ system. For this reason, a larger number of patients may give the opportunity to divide those patients into subgroups such as milk, egg and meat. Likewise, a broader spectrum of cytokines would provide more information about FA pathogenesis.
In conclusion, the increasing incidence of allergic diseases in recent years has increased the necessity for practical biomarkers which may be helpful, especially for the follow-up of patients with FA. Non/minimally invasive methods, such as the evaluation of serum cytokine levels, are required for small infants in this population. Based on our findings, if they are supported with the future studies involving a larger number of patients, we believe that, although the interpretation of IL-10 among tolerance development is multifactorial, serum TNF-α and IL-6 levels, especially in IMFA, may be used in patients’ clinical follow-up.
Author contributionsFügen Çullu Çokuğraş was primary responsible for the study. She lectured in all study centers and prepared the manuscript with Manolya Kara. She had responsibility for developing ideas and protocol with Ömer Faruk Beşer, Haluk Çokuğraş, Tülay Erkan and Tufan Kutlu. Manolya Kara participated in the development of the protocol and data collection, analyzed data and confirmed statistical analysis, had primary responsibility for the assessment of participants in all study centers with Ömer Faruk Beşer. Dildar Konukoglu participated in the laboratory analysis of the present study and had primary responsibility for laboratory analysis.
FundingDeclaration of all sources of funding for the research reported in the manuscript: this research project was funded by the Turkish Pediatric Association without charge.
We declare that the work described has not been published previously, that it is not under consideration for publication elsewhere, that its publication is approved by all authors and tacitly by the responsible authorities where the work was carried out, and that, if accepted, it will not be published elsewhere in the same form, in English or in any other language, including electronically, without the written consent of the copyright-holder.
Conflict of interestThe authors have no conflict of interest to declare.
This study was funded by the Turkish Pediatric Association without charge. We thank the Turkish Pediatric Association for all their support.
