


Thymus and activation-regulated chemokine (TARC), a member of the CC chemokine family, plays a crucial role in Th2-specific inflammation. We aimed to determine the concentration of sputum TARC in children with asthma and eosinophilic bronchitis (EB) and its relation with eosinophilic inflammation, pulmonary function, and bronchial hyper-responsiveness.
MethodsIn total, 90 children with asthma, 38 with EB, and 45 control subjects were enrolled. TARC levels were measured in sputum supernatants using an ELISA. We performed pulmonary function tests and measured exhaled fractional nitric oxide, eosinophil counts in blood, and sputum and serum levels of total IgE in all children.
ResultsSputum TARC levels were significantly higher in children with asthma than in either children with EB (p=0.004) or the control subjects (p=0.014). Among patients with asthma, sputum TARC concentration was higher in children with sputum eosinophilia than in those without sputum eosinophilia (p=0.035). Sputum TARC levels positively correlated with eosinophil counts in sputum, serum total IgE levels, exhaled fractional nitric, and the bronchodilator response. Negative significant correlations were found between sputum TARC and FEV1/FVC (the ratio of forced expiratory volume in one second and forced expiratory vital capacity) or PC20 (the provocative concentration of methacholine causing a 20% decrease in the FEV1).
ConclusionElevated TARC levels in sputum were detected in children with asthma but not in children with EB. Sputum TARC could be a supportive marker for discrimination of asthma from EB in children showing characteristics of eosinophilic airway inflammation.
Asthma and eosinophilic bronchitis (EB) are considered the most common causes of chronic cough, accounting for ∼25% and 13% of cases, respectively.1,2 Asthma is a chronic inflammatory disorder of the airways characterised by recurrent episodes of airflow obstruction, airway hyper-responsiveness (AHR), and bronchodilator reversibility (BDR).3 Structural alterations of the airway, namely remodelling, can be frequently observed in patients with asthma, even in children.4 EB is defined as chronic cough in patients with no symptoms of objective airflow obstruction, sputum eosinophilia, and without AHR.1 Sputum eosinophilia defined as greater than 3% of all non-squamous cells is always present in EB. Similar to asthma, EB shows eosinophilic infiltration of the epithelium and submucosa and remodelling features on an endobronchial biopsy.5 Thymus and activation-regulated chemokine (TARC or CCL17) is a CC family chemokine that acts as a ligand of Th2-dominant CC chemokine receptor 4 (CCR4).6 It has been proven that the CCR4-TARC interaction plays a role in allergic inflammation. CCR4/TARC expression can be increased by stimulation of Th2 cytokines, and TARC can induce selective migration of Th2 but not Th1 cells by triggering CCR4.7,8 Elevated serum TARC levels have been described in atopic dermatitis and are suggested as a useful clinical biomarker for assessing severity, disease activity, and response to treatment in patients with atopic dermatitis.9–11 TARC has also been studied in asthma, eosinophilic pneumonia, and allergic bronchopulmonary aspergillosis.12,13
In the present study, we hypothesised that TARC expression in induced (see Methods) sputum is elevated in patients with asthma or EB compared to control subjects. We also analysed the possible correlation of sputum TARC concentration with eosinophilic inflammation, pulmonary function, and AHR in children.
Materials and methodsSubjectsA total of 173 children were enrolled in this study; 90 had a diagnosis of asthma in accordance with American Thoracic Society criteria.14 Thirty-eight children had a diagnosis of EB based on the following criteria: chronic cough lasting more than four weeks without any clinical symptoms related to reversible airway obstruction, such as recurrent wheezing or dyspnoea; no reversible airway obstruction that could be demonstrated by a negative response to a short-acting bronchodilator (change in forced expiratory volume in 1s [FEV1]<12%); the absence of bronchial hyper-reactivity in a methacholine challenge test (PC20; the provocative concentration of methacholine causing a 20% decrease in the FEV1>16mg/mL); sputum eosinophilia>3%; and no lung parenchymal aberrations seen on a simple chest radiograph.15,16 Children treated with systemic corticosteroids due to asthma exacerbation in the preceding month were excluded from the study. The control group consisted of 45 children who had visited the hospital for a general health workup or vaccination and had no history of wheezing, recurrent or chronic diseases, or infection in the preceding two weeks, or hyper-responsiveness to methacholine. Total serum immunoglobulin E (IgE) levels and peripheral blood eosinophil counts were determined at the initiation of the analyses. A specific IgE test was performed with six allergens common in Korea: Dermatophagoides pteronyssinus, Dermatophagoides farina, egg white, cow milk, German cockroach, and Alternaria alternata. Atopy was defined as above 0.7 KUa/L specific IgE to more than one allergen, or 150IU/mL total IgE. Atopy was also defined as more than one positive skin test result among 12 common aeroallergens, including two types of house dust mites, cat and dog epithelium, and mould and pollen allergens.17,18 A saline solution was used as a negative control, and a 0.5% histamine HCl solution was used as a positive control. The wheal diameter was measured after 15min, and a positive reaction was defined as a wheal diameter >3mm.19 This study was approved by the Institutional Review Board of Severance Hospital (Seoul, Korea; protocol No. 4-2004-0036). Informed written consent for participation was obtained from parents, with verbal assent from children.
Sputum induction and processingThese procedures were performed as previously described by Yoshikawa et al.20 All children were instructed to wash their mouths thoroughly with water. They then inhaled a 3% saline solution nebulised in an ultrasonic nebuliser (NE-U12; Omron Co., Tokyo, Japan) at maximum output at room temperature. The children were encouraged to cough deeply at 3-min intervals thereafter. After sputum induction, spirometry was repeated. If FEV1 fell, the child was required to wait until FEV1 returned to baseline values. Sputum samples were kept at 4°C for no longer than 2h before further processing. A portion of the samples was diluted with a phosphate-buffered saline solution containing 10mmol/L of dithiothreitol (WAKO Pure Chemical Industries, Ltd., Osaka, Japan) for cell counting and was gently vortexed at room temperature for 20min. After centrifugation at 400×g for 10min, the cell pellet was resuspended. We performed a sputum viability assay with the trypan blue exclusion method to ensure adequate viability. Total cell counts were obtained with a haemocytometer, and slides were prepared with cytospin (Cytospin3; Shandon, Tokyo, Japan) and stained with the May–Grunwald–Giemsa stain) for differential cell counts. The latter were performed by two observers who were blinded to the clinical details and who counted 400 non-squamous cells.
Quantification of blood eosinophils, serum total IgE, and sputum TARCEosinophils were counted automatically (NE-8000 system; Sysmex; Kobe, Japan) in peripheral blood, and the serum total IgE levels were measured (CAP system; Pharmacia-Upjohn; Uppsala, Sweden). Concentration of TARC in induced sputum was individually detected with enzyme-linked immunosorbent assay kits (R&D Systems; Minneapolis, MN, USA). The lower detection limit of the assay was 7.81pg/mL.
Spirometry and the methacholine challenge testSpirometry (VIASYS Healthcare, Inc., Conshohocken, PA, USA) was performed, and the flow-volume curves were constructed according to American Thoracic Society guidelines before and after bronchodilator (BD) inhalation.21 A methacholine challenge test was performed according to standardised procedures.22 Each child inhaled increasing concentrations of methacholine (0.075, 0.15, 0.31, 0.62, 1.25, 2.5, 5, 10, 25, and 50mg/mL) nebulised by a dosimeter (MB3; Mefar, Brescia, Italy) until the FEV1 decreased by 20% from a post-nebulised-saline solution value. The bronchial response was expressed as a provocative concentration of methacholine causing a 20% fall in the FEV1 (PC20; measured in milligrams per millilitre) and was calculated by linear interpolation of the log dose response curve.
FeNO measurementFractional exhaled nitric oxide (FeNO) was measured as previously described18,23 using CLD 88 (Eco Medics, Duernten, Switzerland: measurement at a constant 50mL/s expiratory flow rate). Measurements were performed according to the ATS/ERS guidelines.24 All children refrained from eating nitrate-rich foods for 24h before FeNO measurement because ingestion of nitrate-rich foods can affect the levels of FeNO.25 The mean value for each of the three measurements was calculated.
Statistical analysisNumerical variables were expressed as mean±SD. The normality of a distribution was determined by the Kolmogorov–Smirnov test. Numerical parameters with a non-normal distribution were presented as median and inter-quartile range (IQR). Comparisons among children with asthma and EB and control subjects were evaluated by the Kruskal–Wallis test. Statistical comparison of values between groups was done by the Mann–Whitney test. The correlation between sputum TARC concentrations and numerical parameters was determined using the Spearman rank correlation test. All comparisons were two-sided. Data with a p value <0.05 were considered statistically significant. Statistical software (SPSS, version 20.0; SPSS Inc.; Chicago, IL, USA) was used for all the analyses.
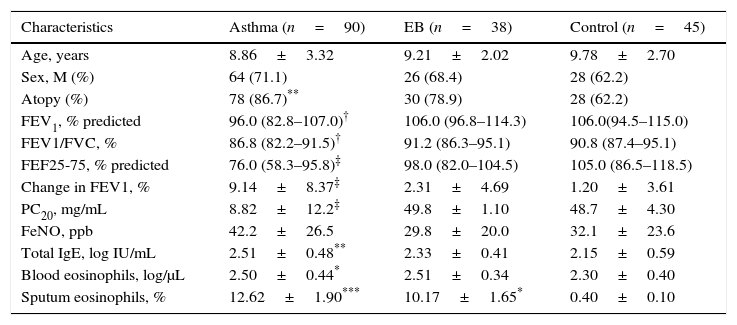
ResultsSubjects’ characteristicsThe clinical characteristics of the study subjects are summarised in Table 1. There were no significant differences in age and gender among the three groups. The percentage of children with atopy was significantly higher in the asthma group than in the control group (p<0.01). There were no differences in atopy between patients with asthma and EB, or between EB and the control group. Pulmonary function variables, including FEV1 (p<0.01), FEV1/FVC (the ratio of forced expiratory volume in 1 second and forced expiratory vital capacity) (p<0.01), forced expiratory flow between 25% and 75% (mid-expiratory phase, FEF25–75) (p<0.001), and PC20 (p<0.001) showed significantly lower values in children with asthma than in those with EB and in control subjects. The percentage change in FEV1 post-BD therapy was significantly higher in asthmatic children (p<0.001). Increased FeNO levels were observed in patients with asthma but there were no statistically significant differences among the groups.
Characteristics of the subjects.
| Characteristics | Asthma (n=90) | EB (n=38) | Control (n=45) |
|---|---|---|---|
| Age, years | 8.86±3.32 | 9.21±2.02 | 9.78±2.70 |
| Sex, M (%) | 64 (71.1) | 26 (68.4) | 28 (62.2) |
| Atopy (%) | 78 (86.7)** | 30 (78.9) | 28 (62.2) |
| FEV1, % predicted | 96.0 (82.8–107.0)† | 106.0 (96.8–114.3) | 106.0(94.5–115.0) |
| FEV1/FVC, % | 86.8 (82.2–91.5)† | 91.2 (86.3–95.1) | 90.8 (87.4–95.1) |
| FEF25-75, % predicted | 76.0 (58.3–95.8)‡ | 98.0 (82.0–104.5) | 105.0 (86.5–118.5) |
| Change in FEV1, % | 9.14±8.37‡ | 2.31±4.69 | 1.20±3.61 |
| PC20, mg/mL | 8.82±12.2‡ | 49.8±1.10 | 48.7±4.30 |
| FeNO, ppb | 42.2±26.5 | 29.8±20.0 | 32.1±23.6 |
| Total IgE, log IU/mL | 2.51±0.48** | 2.33±0.41 | 2.15±0.59 |
| Blood eosinophils, log/μL | 2.50±0.44* | 2.51±0.34 | 2.30±0.40 |
| Sputum eosinophils, % | 12.62±1.90*** | 10.17±1.65* | 0.40±0.10 |
EB, eosinophilic bronchitis; FVC, forced expiratory vital capacity; FEV1, forced expiratory volume in 1 second; FEF25–75, forced expiratory flow between 25% and 75% of forced vital capacity; PC20; a provocative concentration of methacholine causing a 20% fall in the FEV1; FeNO, fractional exhaled nitric oxide; IgE, immunoglobulin E. Values are expressed as a number (percentage), mean±SD, or median (interquartile range).
In serum, the levels of total IgE (p<0.01) and blood eosinophils (p<0.05) were increased in children with asthma compared to control subjects. The percentage of eosinophils in induced sputum was significantly higher in children with asthma or EB than in control subjects (p<0.001 and p<0.05, respectively).
Measurement of TARC levels in sputumAs shown in Fig. 1, sputum TARC concentrations were significantly greater in children with asthma (median 9.34pg/mL; IQR 3.81–24.81pg/mL) than in those with EB (median 4.03pg/mL; IQR 1.04–10.30pg/mL; p=0.004) or control subjects (median 4.37pg/mL; IQR 1.06–10.93pg/mL; p=0.014). No significant differences were found between children with EB and control subjects. Sputum TARC levels did not show any differences between children with atopy and without atopy among all groups (data not shown).
 or control subjects (p=0.014). No significant differences were found between children with EB and control subjects. Box-and whisker plots represent the 25th and 75th percentiles, with the median line and the error bars representing the 10th and 90th percentiles.")
Comparison of sputum TARC levels among the asthma, EB, and control groups. Sputum TARC levels were significantly higher in children with asthma than either children with EB (p=0.004) or control subjects (p=0.014). No significant differences were found between children with EB and control subjects. Box-and whisker plots represent the 25th and 75th percentiles, with the median line and the error bars representing the 10th and 90th percentiles.
In subjects with asthma, sputum TARC concentrations were significantly higher in children with sputum eosinophilia (median 13.51pg/mL; IQR 5.59–30.40pg/mL) compared to those without sputum eosinophilia (median 7.21pg/mL; IQR 1.91–16.29pg/mL; p=0.035; Fig. 2). Furthermore, sputum TARC concentrations positively correlated with sputum eosinophils (r=0.210, p=0.047), blood eosinophils (r=0.279, p=0.012), and serum total IgE (r=0.224, p=0.041). Another biomarker of eosinophilic inflammation, FeNO, also showed a positive correlation with sputum TARC levels (r=0.265, p=0.028; Fig. 3).
. Box-and whisker plots represent the 25th and 75th percentiles, with the median line and the error bars representing the 10th and 90th percentiles.")
Sputum TARC levels versus sputum eosinophilia in asthma patients. Asthmatic children with sputum eosinophilia had significantly higher levels of sputum TARC than those without eosinophilia in sputum (p=0.035). Box-and whisker plots represent the 25th and 75th percentiles, with the median line and the error bars representing the 10th and 90th percentiles.
 was detected in asthma patients.")
Significant positive correlations were also observed between sputum TARC levels and sputum eosinophils (r=0.414, p<0.001), blood eosinophils (r=0.205, p=0.009), serum total IgE (r=0.205, p=0.009), and FeNO (r=0.459, p<0.001) in all children under study (Supplement 1).
Correlation of sputum TARC with pulmonary function and AHRRegarding the pulmonary function parameters, sputum TARC levels in children with asthma showed a significant inverse correlation with FEV1/FVC (r=−0.326, p=0.002; Fig. 4A) and FEF25–75 (r=−0.260, p=0.014; Fig. 4B). In addition, a positive correlation was detected between sputum TARC and the percentage change in FEV1 post-BD therapy (r=0.311, p=0.038; Fig. 4C). There was no relation between sputum TARC levels and FEV1 (data not shown). In the methacholine challenge test, another significant negative correlation was observed: between sputum TARC levels and PC20 (r=−0.454, p<0.001; Fig. 4D). These associations between sputum TARC concentrations and lung function measurements were also observed in all subjects (Supplement 2).
 FEV1/FVC (r=−0.326, p=0.002), (B) FEF25–75 (r=−0.260, p=0.014), and (D) PC20 (r=−0.454, p<0.001). (C) Sputum TARC levels positively correlated with bronchodilator response (r=0.311, p=0.038).")
Correlation of sputum TARC with airflow obstruction, bronchial hyperresponsiveness, and bronchodilator reversibility in asthma patients. Negative significant correlations were found between sputum TARC and (A) FEV1/FVC (r=−0.326, p=0.002), (B) FEF25–75 (r=−0.260, p=0.014), and (D) PC20 (r=−0.454, p<0.001). (C) Sputum TARC levels positively correlated with bronchodilator response (r=0.311, p=0.038).
Since the interaction of CCR4 with TARC was found to serve as a chemoattractant for Th2 cells, TARC has been studied as a clinical biomarker in allergic diseases.26,27 In addition to its well-known role in atopic dermatitis, the relation between TARC and asthma has also been studied. It was demonstrated that TARC is intimately involved in the development of AHR and eosinophilia through the recruitment of Th2 lymphocytes, and a specific antibody against TARC attenuates airway eosinophilia.28 Increased levels of TARC in serum and sputum are observed in adult patients with asthma.29 Plasma TARC concentration is also elevated in children with asthma8 and with asthma exacerbation30; therefore, TARC was suggested as a useful marker of childhood asthma. Furthermore, it was reported that expression of CCR4+CD4+cells and levels of TARC in bronchoalveolar lavage (BAL) fluid are significantly increased in children with asthma.31
Asthma and EB have shown similar immunopathological features such as submucosal eosinophilic inflammation, thickening of the basement membrane, and increased levels of exhaled nitric oxide. Nonetheless, EB differs from asthma in that there is no variable airflow obstruction or AHR15 and mast cell infiltration in airway's smooth muscle is smaller than in asthma.32 In the present study, we tested whether sputum TARC levels are elevated in children with asthma or EB. In comparison with the children with EB or control subjects, children with asthma showed significantly higher levels of TARC in induced sputum, but no significant differences were found between children with EB and control subjects. And TARC levels in sputum were found to be associated with sputum eosinophilia and positively correlated with FeNO, reflecting eosinophilic airway inflammation.33
In addition, sputum TARC levels showed significant negative correlations with the FEV1/FVC ratio, FEF25–75, and PC20 and a positive correlation with BDR in the present study. Increased sputum TARC levels in children with asthma may indicate poor lung function, with decreased values of the FEV1/FVC ratio indicating an airflow limitation.34 Increased concentration of TARC with decreased FEF25–7535,36 and persistent BDR33 may also predict poor asthma control such as persistent asthma symptoms, emergency room visits, or a more frequent need for oral steroids. These findings indicate that sputum TARC may play a role in asthmatic airways including airflow limitation, airway reversibility, and hyperresponsiveness in children.
According to other studies involving BAL, sputum induction is a relatively safer and more convenient procedure. Because BAL analysis is an invasive procedure, especially in children, we suggest sputum induction as an alternative method for quantification of TARC. In addition, asthmatic children treated with an inhaled corticosteroid show higher plasma TARC levels than those without treatment.8 In our study, patients who were treated with an inhaled corticosteroid were excluded.
The mechanism of different TARC levels between asthma and EB patients is not unclear. But Th2 cytokines (IL-4 and IL-13) expression were found to be co-localized to mast cells within the allergic airway smooth muscle37 and to promote TARC release in airway smooth muscle cells.38 In addition, increased CCR 4-expressing mast cells in allergic asthma were observed in bronchial biopsy.39 Therefore, the differences in sputum TARC levels between asthma and EB patients might come from TARC expression on mast cells in the airway smooth muscle. An interaction between CCR4 on mast cells and TARC could contribute to allergic airway inflammation and remodelling.
In summary, we showed that sputum TARC is increased in childhood asthma and associated with the functioning of asthmatic airways and eosinophilic inflammation in children. Our findings suggest that sputum TARC may be a supportive marker reflecting airway eosinophilic inflammation in childhood asthma. Furthermore, these findings also suggest that sputum TARC may differentiate asthma from EB in children.
Ethical disclosuresConfidentiality of dataThe authors declare that they have followed the protocols of their work centre on the publication of patient data and that all the patients included in the study have received sufficient information and have given their informed consent in writing to participate in that study.
Right to privacy and informed consentThe authors have obtained the informed consent of the patients and/or subjects mentioned in the article. The author for correspondence is in possession of this document.
Protection of human subjects and animals in researchThe authors declare that the procedures followed were in accordance with the regulations of the responsible Clinical Research Ethics Committee and in accordance with those of the World Medical Association and the Helsinki Declaration.
Conflict of interestThere are no financial or other issues that might lead to a conflict of interest.
This research was supported by a grant of the Korea Health Technology R&D Project through the Korea Health Industry Development Institute (KHIDI), funded by the Ministry of Health & Welfare, Republic of Korea (grant number: HI14C0234).
The following are the supplementary data to this article:

www.publicationethics.org.