


Food allergy affects around 6% of the European population and its prevalence worldwide has been increasing in the last decades, but studies focused on investigating food allergy epidemiology in Europe are lacking.
ObjectiveThe Cibus project was created to register the main culprit foods and their clinical manifestations in food allergic patients in Catalonia.
MethodsA specific online database was designed. Allergists from eight different Catalan hospitals registered the new diagnoses of food allergy.
Results618 food allergic patients were included. Egg and milk were the main elicitors in the early ages, while fruits and nuts were the most frequent in patients >14 years old. Fish was more frequent in children, while seafood and Anisakis allergy were more frequent in the >14-year-old group. Overall, peach was the most prevalent food eliciting an allergic reaction (10%). Food allergy diagnosis was reached using compatible clinical history and positive skin prick test to the involved food in 98% of cases. Globally, urticaria was the most frequently reported manifestation in our population (48.2%), followed by oral allergy syndrome (25.6%) and anaphylaxis (24.8%).
ConclusionsThe Cibus project gives a full overview of the profile of food allergic patients in Catalonia and reinforces the predominance of plant food allergies in the Mediterranean area.
Food allergy affects around 6% of the European population1 and regarding some recent studies, its prevalence worldwide has increased in the last decades.2,3 It has a great impact upon the patient's quality of life4,5 and represents a high economic burden to public health systems.6
Some risk factors have been identified, such as vitamin D deficiency, increased hygiene, or the age of exposure to foods, but the implication of other environmental factors still remains unclear.7 What seems evident is that the profile of food allergy appears to be different depending on the age and the geographical location, probably due to aeroallergen exposure and food habits.8
The main elicitors of food allergy worldwide are suggested to be cow's milk, egg, wheat, soy, peanut, tree nuts, fish, and shellfish1,9 but we must take into account that studies focused on investigating food allergy epidemiology in Europe are lacking and there is limited information on the prevalence and distribution of sensitisation to foods. Recent studies and reviews of the literature have provided very heterogeneous results.10–12
The number of consultations in Allergy Units in Catalonia for food allergy has increased over the last years. According to data obtained from Alergológica-1992 and 2005, the consultations in Allergy Units in Catalonia and Balearic Islands for food allergy increased from 3.6% in 1992 to 6.05% in 2005.13,14 Thus, the “Cibus project” (Cibus is the Latin word for “food”) was created to register the main culprit foods in our region and their clinical manifestations in order to outline the characteristics of our population.
Material and methodsStudy designA cross-sectional study was carried out in eight allergy outpatient clinics in Catalonia, Spain. Approval from the corresponding Ethics Committees was obtained. The recruitment period was from March 2008 to March 2010.
Patients included were those newly diagnosed of food allergy who agreed and signed the informed consent document (in the case of children the consent was obtained from their representatives). A website was created to report the data. Data collection included demographics, familiar and personal history of atopy (defined as having specific IgE (sIgE) to any common antigen as well as respiratory and/or skin disorders associated with IgE-mediated allergy), presence of other allergic diseases, food allergy manifestations, skin prick test (SPT) to food and respiratory allergens and results of sIgE measurements and/or oral food challenge (OFC) when available.
Diagnosis of food allergyFood allergy diagnosis was established based on a detailed clinical history and a positive SPT and/or sIgE to the food/foods involved in the reaction/s. Clinical symptoms of the reported food allergies were classified as: oral allergy syndrome (OAS, defined as local itching and/or angio-oedema of lips, tongue, palate and/or throat), urticaria and/or angio-oedema, anaphylaxis, dermatitis/eczema and/or gastrointestinal symptoms (GIS, including functional dyspepsia, crampy abdominal pain, nausea, vomiting and/or diarrhoea) occurring minutes to few hours after the food intake. Patients showing positive SPT and/or elevated food sIgE in the absence of any reported adverse reaction to that food were considered asymptomatic sensitisations.
Food allergy classificationFor ease of interpretation of the results, foods reported were grouped as follows: egg, milk, wheat, other cereals (rice, oatmeal, rye, barley, maize), seeds (sesame, mustard, sunflower), legumes (lentil, chickpea, bean, soybean, pea, lupine), peanut, tree nuts (almond, hazelnut, walnut, chestnut, pinion, pistachio), vegetables (celery, onion, asparagus, green bean, lettuce, tomato, carrot, zucchini, spinach), fruits (peach, apple, pear, cherry, plum, pineapple, strawberry, fig, kiwi, avocado, banana, grape, melon, watermelon, orange, tangerine), meat (pork, beef, chicken), Anisakis, fish (hake, monkfish, sole, megrim, cod, tuna, salmon, sardine) and seafood (shrimp, mussel, clam, oyster, cuttlefish, squid).
In vivo and in vitro testsSkin prick tests to standard panels of commercial airborne and food allergens were carried out. The standard airborne allergens panel included Dermatophagoides pteronyssinus, Dermatophagoides farinae, Alternaria alternata, Cladosporium herbarum, Platanus acerifolia, Artemisia vulgaris, Lolium perenne (Laboratorios LETI, Barcelona, Spain), dog and cat dander, Cupressus arizonica, Olea europea, Parietaria Judaica (Bial-Aristegui, Bilbao, Spain), Penicillium sp (Stallergenes, Antony, France). The standard food panel included milk, egg, peanut, hazelnut, walnut, soy, maize, wheat, shrimp, lettuce, tomato, green bean, kiwi, pineapple, banana, peach, mustard, hake, tuna (Laboratorios LETI) and Anisakis simplex (ALK-Abelló, Madrid, Spain). When food allergy was suspected to a food not included in the standard series, commercial extracts and/or fresh foods were used for skin testing. Fresh foods were tested by the prick–prick technique (P×P). All SPT were carried out on the volar side of the forearm using disposable prick lancets. SPT with saline and histamine 10mg/mL were used as negative and positive control. A mean wheal diameter of 3mm or greater obtained 15minutes after puncture was considered a positive response.15
Food hypersensitivity was confirmed by sIgE measurements (UniCAP, Thermofisher, Uppsala, Sweden) in some centres. In these cases, sIgE levels >0.35kU/L were regarded as positive.
Statistical analysisSPSS software (version 18.0; SPSS, Chicago, IL, USA) was used for statistical analysis. For qualitative variables the frequency (percent) and its 95% confidence interval (95% CI) was estimated. For quantitative variables, mean and standard deviation (SD) were calculated. Median, minimum and maximum values are given in those quantitative variables with large dispersion and atypical distribution. Qualitative variables were compared using the χ2 test. Quantitative variables were compared using Student-t test.
P values<0.05 were considered significant.
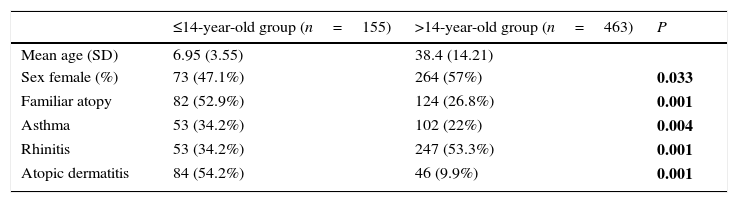
ResultsPatients618 food allergic patients (mean age 30.51 years old (y.o.), SD 18.45) were included. Among them 155 were 14 years old or under. Full demographic data is presented in Table 1. In the population studied, frequency of familiar atopy, atopic dermatitis and asthma was higher in children (≤14 y.o.) compared to the >14y.o. group (P<0.001, P<0.001 and P=0.004, respectively) while rhinitis was significantly higher in the >14 y.o. group (P<0.001). Regarding sensitisation to aeroallergens, the main sensitisers were house dust mites. Frequency of sensitisation to dog and cat dander, grass pollen, mugwort, olive tree and plane tree were significantly higher in the >14 y.o group compared to the ≤14 y.o. group (Fig. 1).
Demographic characteristics.
| ≤14-year-old group (n=155) | >14-year-old group (n=463) | P | |
|---|---|---|---|
| Mean age (SD) | 6.95 (3.55) | 38.4 (14.21) | |
| Sex female (%) | 73 (47.1%) | 264 (57%) | 0.033 |
| Familiar atopy | 82 (52.9%) | 124 (26.8%) | 0.001 |
| Asthma | 53 (34.2%) | 102 (22%) | 0.004 |
| Rhinitis | 53 (34.2%) | 247 (53.3%) | 0.001 |
| Atopic dermatitis | 84 (54.2%) | 46 (9.9%) | 0.001 |
P values correspond to differences between both age groups. Significant differences are marked in bold.
 and **(P<0.01).")
Among the study population, a total of 1517 different food allergies were reported (2.45±2.2 food allergies/patient), without statistical differences between the ≤14 y.o. and >14 y.o. groups.
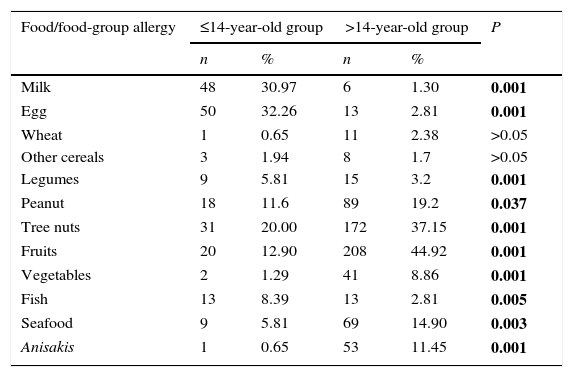
In general, food allergies were markedly different between ≤14 y.o. and >14 y.o. groups. A full list of all food/food-group allergy frequencies is provided in Table 2. Egg and milk were the main elicitors in the younger group, while fruits and tree nuts were the most frequent in the older group. Frequency of fish allergy was higher in the ≤14 y.o. group compared to the >14 y.o. group (P=0.005). On the contrary, frequency of seafood and Anisakis allergy were higher in the >14 y.o. group compared to the ≤14 y.o. group (P=0.003 and P<0.001, respectively).
Food allergy frequency clustered age groups.
| Food/food-group allergy | ≤14-year-old group | >14-year-old group | P | ||
|---|---|---|---|---|---|
| n | % | n | % | ||
| Milk | 48 | 30.97 | 6 | 1.30 | 0.001 |
| Egg | 50 | 32.26 | 13 | 2.81 | 0.001 |
| Wheat | 1 | 0.65 | 11 | 2.38 | >0.05 |
| Other cereals | 3 | 1.94 | 8 | 1.7 | >0.05 |
| Legumes | 9 | 5.81 | 15 | 3.2 | 0.001 |
| Peanut | 18 | 11.6 | 89 | 19.2 | 0.037 |
| Tree nuts | 31 | 20.00 | 172 | 37.15 | 0.001 |
| Fruits | 20 | 12.90 | 208 | 44.92 | 0.001 |
| Vegetables | 2 | 1.29 | 41 | 8.86 | 0.001 |
| Fish | 13 | 8.39 | 13 | 2.81 | 0.005 |
| Seafood | 9 | 5.81 | 69 | 14.90 | 0.003 |
| Anisakis | 1 | 0.65 | 53 | 11.45 | 0.001 |
Data is expressed as number of subjects allergic to a food or allergic to at least one of the foods within the corresponding food group. P values correspond to differences between both age groups: significant differences are marked in bold.
A stratification of the food allergies in the ≤14 y.o. group was carried out, grouping them as shown in Fig. 2. Milk and egg relevance moved from 46% and 38% respectively in the youngest group (≤2 y.o.) to 1.3% and 2.8% in the >14 y.o. group.

On the contrary, fruits, peanut and tree nuts allergies increased progressively over the years. Other foods like seafood or Anisakis also underwent a moderate increase.
Regarding the food groups, the main elicitors were wheat (24%) for cereals, peanut (61%) for legumes, walnut (29%) for tree nuts, peach (35%) for fruits, lettuce (30%) for vegetables, hake (25%) for fish and shrimp (68%) for seafood. Overall, peach was the most prevalent food eliciting an allergic reaction (10%).
A specific analysis of nut allergy prevalence (including peanut, almond, hazelnut, walnut, chestnut, pinion, pistachio) showed that 92 subjects (43%) were allergic to only one nut, 51 (24%) to two different nuts, 34 (16%) to three different nuts and 35 (17%) were allergic to four or more different nuts. Peanut, walnut and hazelnut was the most frequent association.
Diagnostic toolsSPT was the principal diagnostic tool used by the investigators. Food allergy diagnosis was reached using compatible clinical history and positive SPT to the involved food in the 98% of cases. SPT were negative in 24 cases (six milk, six cuttlefish, four clam, three shrimp, two banana, two watermelon, one salmon) and the diagnosis was obtained using other methods (P×P, sIgE and/or OFC).
Also remarkable was that 33% of the positive SPTs were not associated with allergic symptoms. This percentage varied greatly depending on the food: For instance, egg, fish and Anisakis asymptomatic sensitisations were below 15%. On the contrary, cereals and seeds sensitisations had no clinical relevance at the time of the study in 77% and 68% respectively. sIgE was used to complement the diagnosis in 43% of cases, P×P in the 22%.
OFC was used to confirm the food elicitor in 33 allergic reactions (2%), 20 in the ≤14 y.o. group (milk, six; egg, five; lentil, chickpea, bean, pea, hazelnut, walnut, pinion, peach and melon, one) and 13 in the >14 y.o. group (almond and peach, two; egg, milk, soy, peanut, hazelnut, pistachio, onion, pineapple and hake, one).
Clinical manifestationsGlobally, urticaria was the most frequently reported manifestation in our population (48.2%), followed by OAS (25.6%) and anaphylaxis (24.8%). Other symptoms like GIS, respiratory and eczema/dermatitis were scarcely reported (6.6%, 2.4% and 2.2% respectively).
The analysis of the four main symptoms (urticaria, OAS, anaphylaxis, GIS) by age groups (≤14 and >14 y.o.) showed that OAS and anaphylaxis frequency were significantly higher in the >14 y.o. group compared to the ≤14 y.o. group (P=0.016 and P<0.001 respectively). The comparison of symptoms by age groups and food/food-groups showed that the higher frequency of anaphylaxis in the group of age >14 y.o. was because of tree nuts (P<0.001) and fruits (P=0.043). Although frequency of urticaria was not different between age groups, a separate analysis for foods showed that urticaria was more frequent in the ≤14 y.o. group for peanut (P<0.001), tree nuts (P=0.006) and seafood (P=0.029) groups compared to the >14 y.o. group. No differences were detected for egg, milk, Anisakis or fish allergy. The full distribution of symptoms by food/food-group and age group is shown in Fig. 3A and B.
Discussion
Prevalence of food allergies varies worldwide and geographical location is one of the main influencing factors, probably affected by aeroallergen exposure and food habits.11,16 Different sensitisation profiles can be possible even between the north and south regions of the same country.10 In Spain, the most recent epidemiological study in food allergy, Alergológica-2005,14 gives an overview of food allergies across the country, but there is little information about particularities of the different regions. The present study is, to our knowledge, the first epidemiological study on food allergies in Catalonia and the biggest one in terms of recruitment and number of reactions that has ever been described in Spain.
Regarding food/food groups involved in allergic reactions in our study, egg and milk are by far the main elicitors of food allergy in children, while fruits and tree nuts are the most frequent in the group >14 y.o. Other remarkable differences between both age groups are fish, seafood and Anisakis, being the first more frequent in children, unlike the other two. These data are consistent with those obtained from the study Alergológica-200514 and other studies performed in our geographical area17–19 as well as the data on the Spanish population obtained in the European Community Respiratory Health Survey (ECRHS) and Europrevall,11,20 but completely different from the food allergy patterns from the United States or United Kingdom, where peanut is by far the leading food.21 Differences in dietary habits might explain this difference. In fact, the most frequently involved nut in the allergic reactions of the studied population is walnut, which is usually associated with the Mediterranean diet. The individual food that triggered the largest number of reactions in the >14 y.o. group was peach. Peach is described as the main cause of food allergy in the adult population in countries like Spain or Italy, mainly due to its lipid transfer protein (Pru p 3).10,14 This protein is also responsible for multiple plant food-sensitisations and different clinical expressions, conforming the so-called LTP syndrome.22,23 Unfortunately, data about LTP sensitisation was not available in the present study, since at the time it was conducted (2008–2010) this diagnostic tool was not available in our allergy clinics.
The ECRHS study reported an unexpected no-correlation between a high sensitisation to foods and a high sensitisation to aeroallergens.20 In our population, significant differences between aeroallergens sensitisation by age groups were detected for pollens. Grass, mugwort, olive and plane tree pollen sensitisations were more frequent in the older group. This finding correlates with a higher prevalence of allergy to plant foods in adulthood compared to childhood. In fact, mugwort and plane tree pollen sensitisations are clearly related to patients with plant food allergy,24 and specifically to LTP sensitisation and might have a role in the development of plant food allergies.25 Another point to remark is that the presence of mugwort pollen in Catalonia is scarce, so the high proportion of patients sensitised to this pollen might respond to a cross-reactive phenomenon related to LTPs, which does not exclude that they may have symptoms if exposed to higher concentrations of this pollen.26 Even so, the main aeroallergen sensitisers in our population were the house dust mites, regardless of the age.
With regard to clinical manifestations of food allergy, the most frequently described in the literature are cutaneous reactions, followed by OAS, digestive symptoms and anaphylaxis.14 Similar results were found in our population; urticaria was the most frequently reported manifestation, followed by OAS and anaphylaxis. Only significant differences by age groups were detected for OAS and anaphylaxis, both more frequent in the >14 y.o. group. The increased frequency of anaphylaxis depended on peanut, nuts and seafood. These data are similar to those obtained in other epidemiological studies in patients from the Mediterranean area where milk and egg were the main responsible foods for anaphylaxis in children, while peach, vegetables and crustaceans were in adults.27
In the majority of our patients, diagnosis was based on a positive case history and a positive SPT to the involved food. Clinical assessment is mandatory at all times, as positive SPTs alone can overestimate food allergy prevalence. In this study, 1/3 of the positive SPTs were not associated to an allergic reaction. Other methods of diagnosis (PxP, specific IgE and/or OFC) were used when the SPT to the elicitor food was negative or as complementary diagnostic tools. Although OFC is the only conclusive tool in food allergy diagnosis, in the present study it was only carried out in a very low percentage of patients. Double-blind placebo-controlled food challenge, the gold standard in food allergy, is a complex and hardly used technique that was not used by our clinicians. This aspect has already been reported in other studies, reflecting the distance between the usual methods of clinical practice and the general accepted scientific recommendations.28–30 Even so, the lack of OFC in this study should be considered a limitation itself.
In conclusion, the Cibus project provides one of the most extensive collections of newly diagnosed food allergy cases, with a complete evaluation of aeroallergens sensitisation that gives a full overview of the profile of food allergic patients in Catalonia. Given the similarity with other European and Spanish epidemiologic studies, it reinforces the predominance of plant food allergies in the Mediterranean area.
Sources of fundingA grant from SCAIC was obtained for the design and maintenance of the online database.
Conflict of interestNone of the authors have any conflict of interest regarding this paper.
Ethical disclosuresConfidentiality of dataPatients’ data protection. The authors declare that they have followed the protocols of their work centre on the publication of patient data and that all the patients included in the study have received sufficient information and have given their informed consent in writing to participate in that study.
Right to privacy and informed consentThe authors have obtained the informed consent of the patients and/or subjects mentioned in the article. The author for correspondence is in possession of this document.
Protection of human subjects and animals in researchThe authors declare that no experiments were performed on humans or animals for this investigation.
The authors are grateful to SCAIC members who have voluntarily entered new cases of food allergy; we also thank Andrés Hidalgo for designing the online support for the database and the SCAIC Board for trusting in the project and funding the creation of the database.
