


Food allergy refers to abnormal reactions of the body caused by an immune system response to food. This study was conducted aiming to investigate allergy to food allergens in children with food allergies.
Materials and methodsThis study was conducted as a cross-sectional one on 304 children aged six months to seven years with food allergies admitted to the tertiary referral hospital in Kurdistan Province – Iran, during 2014–2015. All the patients were examined for skin prick test using 49 allergens. Finally, the obtained data were analysed using SPSS15 and chi-square and t tests.
ResultsThe highest percentage of occurrence of bump reaction (wheal) and redness (flare) was due to the consumption of fish, eggs, tomatoes, and cocoa. Moreover, the lowest rate of wheal and flare was caused by exposure to allergens like latex, tea, malt, and wheat flour. The reaction most created due to the consumption of foods was flare which was higher among under three-year-olds group (p<0.05), and between the sexes, girls showed the most common allergic reactions (p<0.05).
ConclusionSince food allergy has a high prevalence in children, it should be considered with great interest. Considering that avoiding food allergens is the first step in the treatment of food allergies, the present study may be a useful guide in this regard.
Food allergy refers to abnormal reactions of the body caused by an immune system response to food.1 The symptoms of this type of allergy are caused after consumption of certain foods and cause a change in the function of various organs of the body.2 These symptoms occur within a few minutes, sometimes several hours, and sometimes within 24h or more after eating food.2 Clinical manifestations of this disease are observed in parts such as skin (60%), gastrointestinal system (20%), respiratory tract (20%), and cardiovascular system (15–20%).3 Allergic diseases may occur at any age but the highest incidence is observed in neonates and children of 1–3 years of age, and its prevalence significantly reduces with age.2 Identifying allergy symptoms in children is of special importance because it greatly helps early diagnosis and more effective treatment of this disease.4 Food allergies are most common in childhood, so that the prevalence of food allergy in children is estimated to be up to 10% and in atopic children up to 30%, whereas this amount is less than 2% in adults.1 In children, more than 85% of food allergens are reported to be related to cow's milk, egg, peanut, soy, fish, and wheat.5 Gastrointestinal mucosal surfaces are the principal place of formation of allergic reactions that have the ability to distinguish between safe food, normal flora bacteria, and dangerous pathogens.6,7 Among the risk factors of creating food allergies is the activation of Th2 cells, which secrete interleukins 4 and 13.8 These cytokines stimulate B cells to secrete E immunoglobulins and bind these antibody mast cells in the tissue.9 This leads to the release of substances such as histamine to the blood, and increases fatty acids metabolism such as arachidonic acid to produce leukotrienes and prostaglandins. With repeated reception of antigen, mononuclear cells are stimulated to release histamine releasing factor (HRF) that increases the release of histamine. Histamine and other chemical mediators are in fact responsible for the symptoms observed in allergy.10,11 It seems that in children with incomplete development, different components of the immune system reduce the efficiency of this system against foreign antigens. This could have an important role in more prevalence of food allergies and gastrointestinal infections early in life.12 The outbreak of this disease is varied in different countries and is largely influenced by the food culture of the people.1
Due to the growing prevalence of food allergies and various manifestations of this disease, such as restlessness, lack of proper weight gain, digestive, respiratory, and skin symptoms that can cause many problems for the patients, we intended to evaluate patients with symptoms suspected of food allergies to identify the type of common food allergens in the Kurdistan region in children of six months to seven years.
Materials and methodsSample size and sampling methodThis study was conducted as a cross-sectional one on children aged six months to seven years with food allergies admitted to the tertiary referral hospital in Kurdistan Province, Iran, during 2014–2015. To detect allergy in the patients studied, skin prick test was used. Using the results of previous studies that have determined the most common allergens as peanut with the prevalence of 53%, type I error of 5%, and the power of the study of 95% sample size was calculated as 304 people. They were selected using a convenience sampling method.
Practical testsAll patients of six months to seven years of age, who referred to the paediatric gastroenterology clinic with symptoms of food allergy, such as restlessness, lack of proper weight gain, digestive, respiratory, and skin protests were sent to conduct prick test in the immunology clinic, where the tests were conducted using a standard food kit. According to the global standard protocol, a drop of extract allergens under study was placed on the anterior surface of the forearm, a small skin scratch balance was created, and redness and swelling of skin reactions were recorded after 15min. Three millimetres or more swelling was considered as negative on positive skin reaction. Forty-nine allergens were identified, based on common Iranian diet that included pepper, lemon, orange, kiwi, watermelon, peach, cocoa, garlic, wheat flour, wheat, rice, soy, egg, yolk and egg white, cow's milk, fish, shrimp, barley, maize, sesame, malt, mustard, curry, olives, carrots, cucumbers, spinach, celery, tomatoes, apples potatoes, bananas, apples, strawberries, plums, grapes, beans, pistachios, walnuts, hazelnuts, peanuts, almonds, tea, coffee, onions, latex, cherries and pears.
Statistical analysisAfter entering data into SPSS 15, frequency, percentage, mean and standard deviation were calculated, and the tables were drawn. To compare qualitative variables in different groups, chi-square or Fisher exact test, and to compare quantitative variables, t-tests were used in two groups.
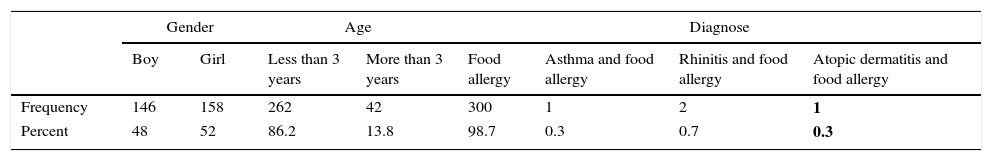
FindingsThree hundred and four subjects were included in the study. Demographic data are presented in Table 1. The results in this table show that most of the subjects are under three years of age (86.2%) and food allergy was the most common types of allergy in these patients (98.7%). In this study, the highest percentage of swelling (wheal) reactions was due to consumption of egg yolk, respectively (34.8%), fish (33.7%), egg white (30.5%), tomatoes (23.1%), cocoa (20.7%), and cattle meat (19.2%). Moreover, the highest percentage of redness (flare) reactions was due to consumption of egg yolk (48.7%), tomatoes (47.7%), egg and sesame (34.8%), cocoa (33.9%), and fish (32.2%). Moreover, the lowest rate of wheal reaction was due to exposure to allergens such as latex, tea, malt, wheat flour with one person and the lowest incidence of redness (flare) was due to latex, tea, malt and wheat with two subjects.
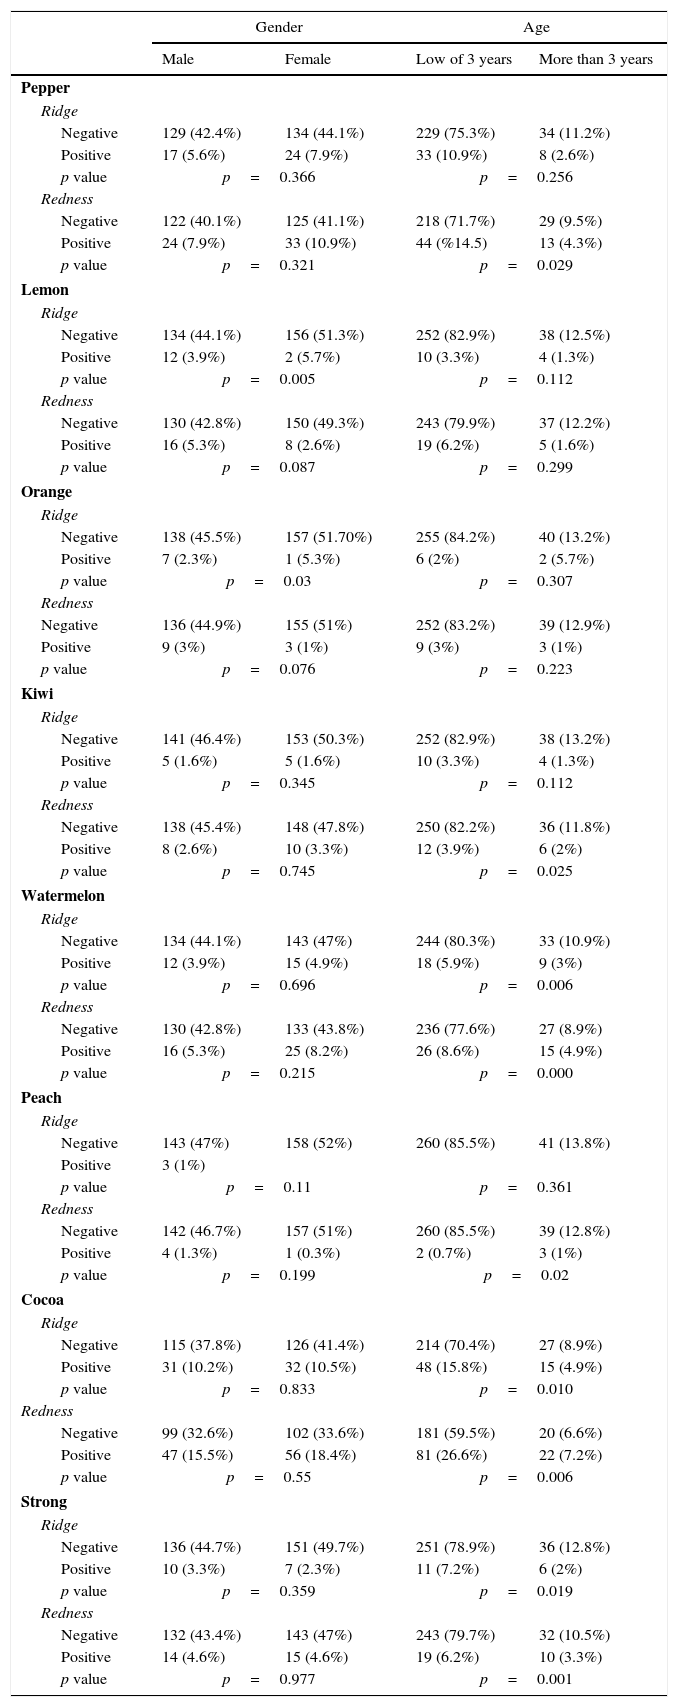
Analysis was conducted based on age and sex for each of the allergens. After consumption of the mentioned allergy food, there was a significant relationship with age and sex (p<0.05) (Table 2). There were significant relationships between sex and consumption of pepper, peach, cocoa, garlic, kiwi age and age with consumption of lemon and orange.
Comparison of flare wheal symptoms due to consumption of different foods in the subjects based on sex and age.
| Gender | Age | |||
|---|---|---|---|---|
| Male | Female | Low of 3 years | More than 3 years | |
| Pepper | ||||
| Ridge | ||||
| Negative | 129 (42.4%) | 134 (44.1%) | 229 (75.3%) | 34 (11.2%) |
| Positive | 17 (5.6%) | 24 (7.9%) | 33 (10.9%) | 8 (2.6%) |
| p value | p=0.366 | p=0.256 | ||
| Redness | ||||
| Negative | 122 (40.1%) | 125 (41.1%) | 218 (71.7%) | 29 (9.5%) |
| Positive | 24 (7.9%) | 33 (10.9%) | 44 (%14.5) | 13 (4.3%) |
| p value | p=0.321 | p=0.029 | ||
| Lemon | ||||
| Ridge | ||||
| Negative | 134 (44.1%) | 156 (51.3%) | 252 (82.9%) | 38 (12.5%) |
| Positive | 12 (3.9%) | 2 (5.7%) | 10 (3.3%) | 4 (1.3%) |
| p value | p=0.005 | p=0.112 | ||
| Redness | ||||
| Negative | 130 (42.8%) | 150 (49.3%) | 243 (79.9%) | 37 (12.2%) |
| Positive | 16 (5.3%) | 8 (2.6%) | 19 (6.2%) | 5 (1.6%) |
| p value | p=0.087 | p=0.299 | ||
| Orange | ||||
| Ridge | ||||
| Negative | 138 (45.5%) | 157 (51.70%) | 255 (84.2%) | 40 (13.2%) |
| Positive | 7 (2.3%) | 1 (5.3%) | 6 (2%) | 2 (5.7%) |
| p value | p=0.03 | p=0.307 | ||
| Redness | ||||
| Negative | 136 (44.9%) | 155 (51%) | 252 (83.2%) | 39 (12.9%) |
| Positive | 9 (3%) | 3 (1%) | 9 (3%) | 3 (1%) |
| p value | p=0.076 | p=0.223 | ||
| Kiwi | ||||
| Ridge | ||||
| Negative | 141 (46.4%) | 153 (50.3%) | 252 (82.9%) | 38 (13.2%) |
| Positive | 5 (1.6%) | 5 (1.6%) | 10 (3.3%) | 4 (1.3%) |
| p value | p=0.345 | p=0.112 | ||
| Redness | ||||
| Negative | 138 (45.4%) | 148 (47.8%) | 250 (82.2%) | 36 (11.8%) |
| Positive | 8 (2.6%) | 10 (3.3%) | 12 (3.9%) | 6 (2%) |
| p value | p=0.745 | p=0.025 | ||
| Watermelon | ||||
| Ridge | ||||
| Negative | 134 (44.1%) | 143 (47%) | 244 (80.3%) | 33 (10.9%) |
| Positive | 12 (3.9%) | 15 (4.9%) | 18 (5.9%) | 9 (3%) |
| p value | p=0.696 | p=0.006 | ||
| Redness | ||||
| Negative | 130 (42.8%) | 133 (43.8%) | 236 (77.6%) | 27 (8.9%) |
| Positive | 16 (5.3%) | 25 (8.2%) | 26 (8.6%) | 15 (4.9%) |
| p value | p=0.215 | p=0.000 | ||
| Peach | ||||
| Ridge | ||||
| Negative | 143 (47%) | 158 (52%) | 260 (85.5%) | 41 (13.8%) |
| Positive | 3 (1%) | |||
| p value | p=0.11 | p=0.361 | ||
| Redness | ||||
| Negative | 142 (46.7%) | 157 (51%) | 260 (85.5%) | 39 (12.8%) |
| Positive | 4 (1.3%) | 1 (0.3%) | 2 (0.7%) | 3 (1%) |
| p value | p=0.199 | p=0.02 | ||
| Cocoa | ||||
| Ridge | ||||
| Negative | 115 (37.8%) | 126 (41.4%) | 214 (70.4%) | 27 (8.9%) |
| Positive | 31 (10.2%) | 32 (10.5%) | 48 (15.8%) | 15 (4.9%) |
| p value | p=0.833 | p=0.010 | ||
| Redness | ||||
| Negative | 99 (32.6%) | 102 (33.6%) | 181 (59.5%) | 20 (6.6%) |
| Positive | 47 (15.5%) | 56 (18.4%) | 81 (26.6%) | 22 (7.2%) |
| p value | p=0.55 | p=0.006 | ||
| Strong | ||||
| Ridge | ||||
| Negative | 136 (44.7%) | 151 (49.7%) | 251 (78.9%) | 36 (12.8%) |
| Positive | 10 (3.3%) | 7 (2.3%) | 11 (7.2%) | 6 (2%) |
| p value | p=0.359 | p=0.019 | ||
| Redness | ||||
| Negative | 132 (43.4%) | 143 (47%) | 243 (79.7%) | 32 (10.5%) |
| Positive | 14 (4.6%) | 15 (4.6%) | 19 (6.2%) | 10 (3.3%) |
| p value | p=0.977 | p=0.001 | ||
Due to consumption of other food studied, there was no significant relationship between creating flare and wheal based on age and sex (p>0.05) (Table 3).
Comparison of flare and wheal symptoms due to the consumption of other foods in the subjects based on sex and age.
| Gender | Age | |||
|---|---|---|---|---|
| Boy | Girl | Low of 3 years | More than 3 years | |
| Flour corn | ||||
| Ridge | ||||
| Negative | 146 (48%) | 158 (52%) | 262 (86.2%) | 42 (13.8%) |
| Positive | 0 (0%) | 0 (0%) | 0 (0%) | 0 (0%) |
| p value | – | – | ||
| Redness | ||||
| Negative | 146 (48%) | 158 (52%) | 262 (86.2%) | 42 (13.8%) |
| Positive | 0 (0%) | 0 (0%) | 0 (0%) | 0 (0%) |
| p value | – | – | ||
| Wheat | ||||
| Ridge | ||||
| Negative | 139 (45.7%) | 148 (48.7%) | 248 (81.6%) | 39 (12.8%) |
| Positive | 7 (2.3%) | 10 (3.3%) | 14 (4.6%) | 3 (1%) |
| p value | p=0.624 | p=0.714 | ||
| Redness | ||||
| Negative | 135 (44.4%) | 145 (47.7%) | 242 (79.6%) | 38 (12.5%) |
| Positive | 11 (3.6%) | 13 (4.3%) | 20 (6.6%) | 4 (1.3%) |
| p value | p=0.835 | p=0.756 | ||
| Rice | ||||
| Ridge | ||||
| Negative | 136 (44.7%) | 146 (48%) | 243 (79.9%) | 39 (12.8%) |
| Positive | 10 (3.3%) | 12 (4%) | 19 (6.2%) | 3 (1%) |
| p value | p=0.829 | p=1.000 | ||
| Redness | ||||
| Negative | 123 (40.5%) | 136 (44.7%) | 224 (79.6%) | 35 (11.5%) |
| Positive | 23 (7.6%) | 22 (7.2%) | 20 (6.6%) | 7 (2.3%) |
| p value | p=0.747 | p=0.647 | ||
| Soya | ||||
| Ridge | ||||
| Negative | 134 (44.1%) | 141 (46.4%) | 237 (78%) | 38 (12.5%) |
| Positive | 12 (3.9%) | 17 (5.6%) | 25 (8.2%) | 4 (1.3%) |
| p value | p=0.559 | p=1.000 | ||
| Redness | ||||
| Negative | 118 (38.8%) | 126 (41.4%) | 208 (68.4%) | 36 (11.8%) |
| Positive | 28 (9.2%) | 32 (10.5%) | 54 (17.8%) | 6 (2%) |
| p value | p=0.886 | p=0.408 | ||
| Chicken | ||||
| Ridge | ||||
| Negative | 123 (40.5%) | 137 (45.1%) | 222 (73%) | 38 (12.5%) |
| Positive | 23 (7.6%) | 21 (6.9%) | 40 (13.2%) | 4 (1.3%) |
| p value | p=0.625 | p=0.478 | ||
| Redness | ||||
| Negative | 105 (34.5%) | 122 (40.1%) | 191 (62.8%) | 36 (11.8%) |
| Positive | 41 (13.5%) | 36 (11.8%) | 71 (23.4%) | 6 (2%) |
| p value | p=0.295 | p=0.087 | ||
| Egg white | ||||
| Ridge | ||||
| Negative | 100 (32.9%) | 108 (35.5%) | 175 (57.6%) | 33 (10.9%) |
| Positive | 46 (15.1%) | 50 (15.4%) | 87 (28.6%) | 9 (3%) |
| p value | p=1.000 | p=0.154 | ||
| Redness | ||||
| Negative | 96 (31.6%) | 102 (33.6%) | 122 (40.1%) | 24 (7.9%) |
| Positive | 50 (16.4%) | 56 (18.4%) | 140 (46.1%) | 18 (5.9%) |
| p value | p=0.647 | p=0.245 | ||
| Yolk | ||||
| Ridge | ||||
| Negative | 96 (31.6%) | 102 (33.4%) | 170 (55.9%) | 28 (9.2%) |
| Positive | 50 (16.4%) | 56 (18.4%) | 92 (30.3%) | 14 (4.6%) |
| p value | p=0.904 | p=0.863 | ||
| Redness | ||||
| Negative | 80 (26.3%) | 76 (25%) | 130 (43.8%) | 23 (7.6%) |
| Positive | 66 (21.7%) | 82 (27%) | 129 (42.4%) | 19 (6.2%) |
| p value | p=0.243 | p=0.74 | ||
| Beef | ||||
| Ridge | ||||
| Negative | 130 (42.8%) | 145 (47.7%) | 239 (78.6%) | 36 (11.8%) |
| Positive | 16 (11%) | 13 (8.2%) | 23 (7.6%) | 6 (2%) |
| p value | p=0.414 | p=0.26 | ||
| Redness | ||||
| Negative | 121 (39.8%) | 137 (45.1%) | 224 (73.7%) | 34 (11.2%) |
| Positive | 25 (8.2%) | 21 (6.9%) | 38 (12.5%) | 8 (2.6%) |
| p value | p=0.424 | p=0.486 | ||
| Milk | ||||
| Ridge | ||||
| Negative | 129 (42.4%) | 142 (46.7%) | 234 (77%) | 37 (12.2%) |
| Positive | 17 (5.6%) | 16 (5.3%) | 28 (9.2%) | 5 (1.6%) |
| p value | p=0.671 | p=0.714 | ||
| Redness | ||||
| Negative | 113 (37.2%) | 131 (43.1%) | 208 (68.4%) | 36 (11.8%) |
| Positive | 33 (10.9%) | 27 (8.9%) | 54 (17.8%) | 6 (2%) |
| p value | p=0.25 | p=0.0339 | ||
| Fish | ||||
| Ridge | ||||
| Negative | 119 (39.1%) | 134 (44.1%) | 214 (79.4%) | 39 (12.8%) |
| Positive | 27 (18.5%) | 24 (15.2%) | 48 (15.8%) | 3 (1%) |
| p value | p=0.448 | p=0.078 | ||
| Redness | ||||
| Negative | 94 (30.9%) | 112 (36.8%) | 171 (56.2%) | 35 (11.5%) |
| Positive | 52 (17.1%) | 46 (15.1%) | 91 (29.9%) | 7 (2.3%) |
| p value | p=0.269 | p=0.02 | ||
| Shirimp | ||||
| Ridge | ||||
| Negative | 143 (47%) | 153 (44.1%) | 257 (84.5) | 39 (12.8%) |
| Positive | 3 (1%) | 5 (1.6%) | 5 (1.6%) | 3 (1%) |
| p value | p=0.725 | p=0.084 | ||
| Redness | ||||
| Negative | 139 (45.7%) | 150 (49.3%) | 251 (82.6%) | 38 (12.5%) |
| Positive | 7 (2.3%) | 8 (2.6%) | 11 (3.6%) | 4 (1.3%) |
| p value | p=0.914 | p=0.137 | ||
| Barley | ||||
| Ridge | ||||
| Negative | 136 (44.7%) | 144 (47.4%) | 240 (78.9%) | 40 (13.2%) |
| Positive | 10 (3.3%) | 14 (4.6%) | 22 (7.2%) | 2 (0.7%) |
| p value | p=0.516 | p=0.55 | ||
| Redness | ||||
| Negative | 129 (42.4%) | 137 (45.1%) | 227 (74.7%) | 39 (12.8%) |
| Positive | 17 (5.6%) | 21 (6.9%) | 35 (11.5%) | 3 (1%) |
| p value | p=0.664 | p=0.323 | ||
| Corn | ||||
| Ridge | ||||
| Negative | 130 (42.8%) | 147 (48.4%) | 240 (78.9%) | 37 (12.2%) |
| Positive | 16 (5.3%) | 11 (3.6%) | 22 (7.2%) | 5 (1.6%) |
| p value | p=0.221 | p=0.396 | ||
| Redness | ||||
| Negative | 120 (39.5%) | 139 (45.7%) | 223 (73.4%) | 36 (11.8%) |
| Positive | 26 (8.6%) | 19 (6.2%) | 39 (12.8%) | 6 (2%) |
| p value | p=0.156 | p=0.919 | ||
| Sesame | ||||
| Ridge | ||||
| Negative | 122 (40.1%) | 130 (43.8%) | 219 (72%) | 36 (11.8%) |
| Positive | 24 (7.9%) | 25 (8.2%) | 43 (14.1%) | 6 (2%) |
| p value | p=0.884 | p=0.728 | ||
| Redness | ||||
| Negative | 100 (32.9%) | 98 (32.2%) | 169 (55.6%) | 29 (9.5%) |
| Positive | 46 (15.1%) | 60 (19.7%) | 93 (30.6%) | 13 (4.3%) |
| p value | p=0.237 | p=0.566 | ||
| Malta | ||||
| Ridge | ||||
| Negative | 146 (48%) | 158 (52%) | 262 (86.2%) | 42 (13.8%) |
| Positive | 0 (0%) | 0 (0%) | 0 (0%) | 0 (0%) |
| p value | – | – | ||
| Redness | ||||
| Negative | 146 (48%) | 158 (52%) | 262 (86.2%) | 42 (13.8%) |
| Positive | 0 (0%) | 0 (0%) | 0 (0%) | 0 (0%) |
| p value | – | – | ||
| Mustard | ||||
| Ridge | ||||
| Negative | 138 (45.4%) | 148 (48.7%) | 245 (80.6%) | 41 (13.5%) |
| Positive | 8 (2.6%) | 10 (3.3%) | 17 (5.6%) | 1 (0.3%) |
| p value | p=812 | p=0.485 | ||
| Redness | ||||
| Negative | 134 (44.1%) | 140 (46.1%) | 236 (77.6%) | 38 (12.5%) |
| Positive | 12 (3.9%) | 18 (5.9%) | 26 (8.6%) | 4 (1.3%) |
| p value | p=0.345 | p=1.000 | ||
| Curry powder | ||||
| Ridge | ||||
| Negative | 137 (45.1%) | 151 (49.7%) | 248 (81.6%) | 40 (13.2%) |
| Positive | 9 (3%) | 7 (2.3%) | 14 (4.6%) | 2 (0.7%) |
| p value | p=0.61 | p=1.000 | ||
| Redness | ||||
| Negative | 131 (43.1%) | 148 (48.7%) | 239 (78.6%) | 40 (13.2%) |
| Positive | 15 (4.9%) | 10 (3.3%) | 23 (7.6%) | 2 (0.7%) |
| p value | p=0.211 | p=0.549 | ||
| Olive | ||||
| Ridge | ||||
| Negative | 144 (47.7%) | 158 (52%) | 260 (85.5%) | 42 (13.8%) |
| Positive | 2 (0.7%) | 0 (0%) | 2 (0.7%) | 0 (0%) |
| p value | p=0.23 | p=1.000 | ||
| Redness | ||||
| Negative | 144 (47.4%) | 158 (52%) | 260 (85.5%) | 42 (13.8%) |
| Positive | 2 (0.7%) | 0 (0%) | 2 (0.7%) | 0 (0%) |
| p value | p=0.23 | p=1.000 | ||
| Carrot | ||||
| Ridge | ||||
| Negative | 144 (47.4%) | 157 (51%) | 261 (85.9%) | 40 (13.2%) |
| Positive | 2 (0.7%) | 1 (0.3%) | 1 (0.3%) | 2 (0.7%) |
| p value | p=0.609 | p=0.051 | ||
| Redness | ||||
| Negative | 144 (47.4%) | 157 (51%) | 261 (85.9%) | 40 (13.2%) |
| Positive | 2 (0.7%) | 1 (0.3%) | 1 (0.3%) | 2 (0.7%) |
| p value | p=0.609 | p=0.051 | ||
| Cucumber | ||||
| Ridge | ||||
| Negative | 144 (47.4%) | 157 (51%) | 261 (85.9%) | 40 (13.2%) |
| Positive | 2 (0.7%) | 1 (0.3%) | 1 (0.3%) | 2 (0.7%) |
| p value | p=0.609 | p=0.361 | ||
| Redness | ||||
| Negative | 142 (46.7%) | 157 (51%) | 259 (85.2%) | 40 (13.2%) |
| Positive | 4 (1.3%) | 1 (0.3%) | 3 (1%) | 2 (0.7%) |
| p value | p=0.199 | p=0.142 | ||
| Spinach | ||||
| Ridge | ||||
| Negative | 145 (47.8%) | 157 (51%) | 261 (85.9%) | 42 (13.8%) |
| Positive | 1 (0.3%) | 0 (0%) | 1 (0.3%) | 0 (0%) |
| p value | p=0.48 | p=1.000 | ||
| Redness | ||||
| Negative | 145 (47.8%) | 157 (51%) | 260 (85.5%) | 42 (13.8%) |
| Positive | 1 (0.3%) | 1 (0.3%) | 2 (0.7%) | 0 (0%) |
| p value | p=1.000 | p=1.000 | ||
| Celery | ||||
| Ridge | ||||
| Negative | 144 (47.4%) | 156 (51.3%) | 258 (85.9%) | 42 (13.8%) |
| Positive | 2 (0.7%) | 2 (0.7%) | 1 (0.3%) | O(0%) |
| p value | p=1.000 | p=1.000 | ||
| Redness | ||||
| Negative | 138 (45.4%) | 150 (49.4%) | 249 (81.9%) | 39 (12.8%) |
| Positive | 8 (2.6%) | 8 (2.6%) | 3 (1%) | 3 (1%) |
| p value | p=1.000 | p=0.471 | ||
| Tomato | ||||
| Ridge | ||||
| Negative | 113 (37.2%) | 121 (39.8%) | 201 (66.1%) | 33 (10.9%) |
| Positive | 33 (10.9%) | 37 (12.2%) | 61 (20.1%) | 9 (3%) |
| p value | p=0.866 | p=0.791 | ||
| Redness | ||||
| Negative | 75 (24.7%) | 84 (27.6%) | 134 (44.1%) | 25 (8.2%) |
| Positive | 71 (23.4%) | 74 (24.3%) | 128 (42.1%) | 17 (5.6%) |
| p value | p=0.754 | p=0.313 | ||
| Potato | ||||
| Ridge | ||||
| Negative | 134 (44.1%) | 144 (47.4%) | 240 (78.9%) | 38 (12.5%) |
| Positive | 12 (3.9%) | 14 (4.6%) | 22 (7.2%) | 4 (1.3%) |
| p value | p=0.814 | p=0.768 | ||
| Redness | ||||
| Negative | 121 (39.8%) | 135 (44.4%) | 221 (72.7%) | 35 (11.5%) |
| Positive | 25 (8.2%) | 23 (7.6%) | 41 (13.5%) | 7 (2.3%) |
| p value | p=0.54 | p=0.867 | ||
| Benana | ||||
| Ridge | ||||
| Negative | 141 (46.4%) | 153 (50.3%) | 255 (83.9%) | 39 (12.8%) |
| Positive | 5 (1.6%) | 5 (1.6%) | 7 (2.3%) | 3 (1%) |
| p value | p=1.000 | p=0.147 | ||
| Redness | ||||
| Negative | 137 (45.1%) | 150 (49.3%) | 249 (81.9%) | 38 (12.5%) |
| Positive | 9 (3%) | 8 (2.6%) | 13 (4.3%) | 4 (1.3%) |
| p value | p=0.804 | p=0.269 | ||
| Apple | ||||
| Ridge | ||||
| Negative | 141 (46.4%) | 152 (50%) | 253 (83.2%) | 40 (13.2%) |
| Positive | 5 (1.6%) | 6 (2%) | 9 (3%) | 2 (0.7%) |
| p value | p=1.000 | p=0.653 | ||
| Redness | ||||
| Negative | 137 (45.1%) | 149 (49%) | 246 (80.9%) | 40 (13.2%) |
| Positive | 9 (3%) | 9 (3%) | 16 (5.3%) | 2 (0.7%) |
| p value | p=0.863 | p=1.000 | ||
| Strawberry | ||||
| Ridge | ||||
| Negative | 123 (40.5%) | 135 (44.4%) | 223 (73.4%) | 35 (11.5%) |
| Positive | 23 (7.6%) | 23 (7.6%) | 39 (12.8%) | 7 (2.3%) |
| p value | p=0.771 | p=0.765 | ||
| Redness | ||||
| Negative | 117 (38.5%) | 126 (41.4%) | 214 (70.4%) | 29 (9.5%) |
| Positive | 29 (9.5%) | 32 (10.5%) | 48 (15.8%) | 13 (4.3%) |
| p value | p=0.932 | p=0.053 | ||
| Plum | ||||
| Ridge | ||||
| Negative | 145 (47.7%) | 157 (51.7%) | 261 (73.4%) | 41 (11.5%) |
| Positive | 1 (0.3%) | 1 (0.3%) | 1 (0.3%) | 1 (0.3%) |
| p value | p=1.000 | p=0.258 | ||
| Redness | ||||
| Negative | 144 (47.4%) | 155 (51%) | 258 (84.9%) | 41 (11.5%) |
| Positive | 2 (0.7%) | 2 (0.7%) | 4 (1.3%) | 1 (0.3%) |
| p value | p=1.000 | p=0.527 | ||
| Grape | ||||
| Ridge | ||||
| Negative | 139 (45.7%) | 153 (50.3%) | 252 (82.9%) | 40 (13.2%) |
| Positive | 7 (2.3%) | 5 (1.6%) | 10 (3.3%) | 2 (0.7%) |
| p value | p=0.466 | p=0.675 | ||
| Redness | ||||
| Negative | 132 (43.4%) | 146 (48%) | 240 (78.9%) | 38 (12.5%) |
| Positive | 14 (4.6%) | 14 (4.6%) | 22 (7.2%) | 4 (1.3%) |
| p value | p=0.535 | p=0.768 | ||
| Been | ||||
| Ridge | ||||
| Negative | 142 (46.7%) | 157 (51.7%) | 259 (85.2%) | 40 (13.2%) |
| Positive | 4 (1.3%) | 1 (0.3%) | 3 (1%) | 2 (0.7%) |
| p value | p=0.199 | p=0.142 | ||
| Redness | ||||
| Negative | 143 (47%) | 155 (51%) | 259 (85.2%) | 41 (13.5%) |
| Positive | 3 (1%) | 3 (1%) | 3 (1%) | 1 (0.3%) |
| p value | p=0.354 | p=0.45 | ||
| Pistachio | ||||
| Ridge | ||||
| Negative | 134 (44.1%) | 145 (47.7%) | 240 (78.9%) | 39 (12.8%) |
| Positive | 12 (3.9%) | 13 (8.2%) | 22 (7.2%) | 3 (1%) |
| p value | p=0.998 | p=1.000 | ||
| Redness | ||||
| Negative | 127 (41.8%) | 138 (45.4%) | 230 (75.7%) | 35 (11.5%) |
| Positive | 19 (6.2%) | 20 (6.4%) | 32 (10.5%) | 7 (2.3%) |
| p value | p=0.926 | p=0.423 | ||
| Walnut | ||||
| Ridge | ||||
| Negative | 138 (45.5%) | 144 (47.7%) | 246 (80.9%) | 36 (11.8%) |
| Positive | 8 (2.6%) | 14 (4.6%) | 16 (5.3%) | 6 (2%) |
| p value | p=0.256 | p=0.058 | ||
| Redness | ||||
| Negative | 134 (44.1%) | 140 (46.1%) | 238 (78.3%) | 36 (11.8%) |
| Positive | 12 (3.9%) | 18 (5.9%) | 24 (7.9%) | 6 (2%) |
| p value | p=0.354 | p=0.301 | ||
| Hazelnut | ||||
| Ridge | ||||
| Negative | 142 (46.7%) | 154 (50.7%) | 257 (84.5%) | 39 (12.8%) |
| Positive | 4 (1.3%) | 4 (1.3%) | 5 (1.6%) | 3 (1%) |
| p value | p=1.000 | p=0.084 | ||
| Redness | ||||
| Negative | 138 (45.5%) | 153 (50.3%) | 253 (83.2%) | 38 (12.5%) |
| Positive | 8 (2.6%) | 5 (1.6%) | 9 (3%) | 4 (1.3%) |
| p value | p=0.319 | p=0.089 | ||
| Peanut | ||||
| Ridge | ||||
| Negative | 123 (40.5%) | 140 (41.6%) | 227 (74.7%) | 36 (11.8%) |
| Positive | 1 (0.3%) | 1 (0.3%) | 1 (0.3%) | 1 (0.3%) |
| p value | p=1.000 | p=0.258 | ||
| Redness | ||||
| Negative | 144 (47.4%) | 155 (51%) | 258 (84.9%) | 41 (11.5%) |
| Positive | 2 (0.7%) | 2 (0.7%) | 4 (1.3%) | 1 (0.3%) |
| p value | p=1.000 | p=0.527 | ||
| Almond | ||||
| Ridge | ||||
| Negative | 130 (42.8%) | 136 (44.7%) | 227 (74.7%) | 39 (12.8%) |
| Positive | 16 (5.3%) | 22 (7.2%) | 35 (11.5%) | 3 (1%) |
| p value | p=0.435 | p=0.323 | ||
| Redness | ||||
| Negative | 123 (40.5%) | 130 (42.8%) | 214 (70.4%) | 39 (12.8%) |
| Positive | 23 (7.6%) | 28 (9.2%) | 48 (15.8%) | 3 (1%) |
| p value | p=0.646 | p=0.078 | ||
| Tea | ||||
| Ridge | ||||
| Negative | 146 (48%) | 158 (52%) | 262 (86.2%) | 42 (13.8%) |
| Positive | 0 (0%) | 0 (0%) | 0 (0%) | 0 (0%) |
| p value | ||||
| Redness | ||||
| Negative | 146 (48%) | 158 (52%) | 262 (86.2%) | 42 (13.8%) |
| Positive | 0 (0%) | 0 (0%) | 0 (0%) | |
| p value | – | – | ||
| Coffee | ||||
| Ridge | ||||
| Negative | 135 (44.4%) | 146 (48%) | 242 (79.6%) | 39 (12.8%) |
| Positive | 11 (3.6%) | 12 (3.9%) | 20 (6.6%) | 3 (1%) |
| p value | p=0.984 | p=1.000 | ||
| Redness | ||||
| Negative | 126 (41.4%) | 140 (46.1%) | 230 (75.7%) | 36 (11.8%) |
| Positive | 20 (6.6%) | 18 (5.9%) | 32 (10.5%) | 6 (2%) |
| p value | p=0.544 | p=0.706 | ||
| Onion | ||||
| Ridge | ||||
| Negative | 135 (44.4%) | 149 (49%) | 245 (80.6%) | 39 (12.8%) |
| Positive | 11 (3.6%) | 9 (3%) | 17 (5.6%) | 3 (1%) |
| p value | p=0.518 | p=0.746 | ||
| Redness | ||||
| Negative | 129 (42.4%) | 143 (47%) | 235 (77.3%) | 37 (12.2%) |
| Positive | 17 (5.6%) | 15 (4.9%) | 27 (8.9%) | 5 (1.6%) |
| p value | p=0.542 | p=0.754 | ||
| Latex | ||||
| Ridge | ||||
| Negative | 146 (48%) | 158 (52%) | 262 (86.2%) | 42 (13.8%) |
| Positive | 0 (0%) | 0 (0%) | 0 (0%) | 0 (0%) |
| p value | – | – | ||
| Redness | ||||
| Negative | 146 (48%) | 158 (52%) | 262 (86.2%) | 42 (13.8%) |
| Positive | 0 (0%) | 0 (0%) | 0 (0%) | 0 (0%) |
| p value | – | – | ||
| Cherry | ||||
| Ridge | ||||
| Negative | 146 (48%) | 156 (51.3%) | 261 (86.2%) | 41 (13.5%) |
| Positive | 0 (0%) | 2 (0.7%) | 1 (0.3%) | 1 (0.3%) |
| p value | p=0.499 | p=0.258 | ||
| Redness | ||||
| Negative | 145 (47.7%) | 153 (50.3%) | 257 (84.5%) | 41 (13.5%) |
| Positive | 1 (0.3%) | 5 (1.6%) | 5 (1.6%) | 1 (0.3%) |
| p value | p=0.216 | p=0.593 | ||
| Pear | ||||
| Ridge | ||||
| Negative | 145 (47.7%) | 158 (52%) | 262 (86.2%) | 41 (13.8%) |
| Positive | 1 (0.3%) | 0 (0%) | 0 (0%) | 1 (0.3%) |
| p value | p=0.48 | p=0.138 | ||
| Redness | ||||
| Negative | 145 (47.7%) | 156 (51.3%) | 260 (85.5%) | 41 (13.5%) |
| Positive | 1 (0.3%) | 2 (0.7%) | 2 (0.7%) | 1 (0.3%) |
| p value | p=1.000 | p=0.361 | ||
The relative prevalence of food allergies in many parts of the world is different and depends on the type of feed and breed. Moreover, it partly reflects the food culture of that country.11 The need to prevent the development of allergies, especially to foods, fruits, and chemicals is considered of the most important approaches of health for all age levels.6 The aim of this study was to determine the prevalence of allergy to food allergens in children six months to seven years old with skin prick test in Kurdistan Province, Iran. For this purpose, reactivity of the studied people based on skin prick test that includes skin wheal and flare based on age and sex was examined.
The results showed that the highest percentage of swelling (wheal) reactions was due to consumption of egg yolk (34.8%), fish (33.7%), egg white (30.5%), tomatoes (23.1%), cocoa (20.7%), and cattle meat (19.2%), respectively. Moreover, the highest percentage of redness (flare) reactions was due to consumption of egg yolk (48.7%), tomatoes (47.7%), egg and sesame (34.8%), cocoa (33.9%), and fish (32.2%). This finding is similar to the conclusions in different studies. In the study by Rance et al., common food allergens were eggs (36%), cow's milk (8%), mustard (6%), and fish (4%).13 In the study by Bever et al. conducted on children with atopic dermatitis, the most common allergens were egg (%70.8), wheat (50%), milk and soy (33.3%), which is consistent with our study.14 However, the percentage of occurrence of allergy in this study has been high, which might be due to differences in sample size and population. Moreover, food culture and nutrition differences in communities can also be effective. In the study by Barzgar et al. in Tehran, the most common causes of anaphylaxis are milk (49.3%), wheat (26.1%), eggs (8.7%), nuts (2.8%), and spices (2.8%) that is inconsistent with our study.15 Moreover, in the study by Mesaghi in 98 children with suspected food allergy, the most common allergens were cow's milk (5.27%) and tomatoes (4.21%).16 In the study by Hajavi et al., the most common allergies compared to grains and nuts, soy 8%, pistachios 3.8%, peanuts 3.5%, walnuts 2.9%, sesame 2.1%, and hazelnuts 1.5%.17 This is while, in our study, the highest frequency was for sesame 34.8%, soy 19.7%, and peanuts 19.4%. Living style and dietary habits of people in different regions may explain some differences in the prevalence of food allergy. In all food allergens of the present study the flare and wheal reactions were higher among girls than boys. In the study by Hajavi et al., it was found that allergy to foods in women is more than in men, which is consistent with our study.17 On the other hand, in the study by Fooladseresht et al. the sensitivity to allergens among men was more than in women whereas between the sexes the prevalence of food allergens like egg white, egg yolk, chicken, and tomato were significantly higher in men than in women.18 In the study by Pourreza et al., the prevalence of allergies was similar in both sexes, which does not match with our study.19 More and more of the severe allergy rate among female sex is due to hormones such as oestrogen. This hormone increases the activity of an enzyme in the brain blood vessels and this enzyme, in turn, raises the allergic reactions.
The results of this study show that the incidence of swelling and redness reactions among those under three years is more than people older than three years, so that the swelling reactions due to consumption of watermelon, milk and cocoa, and red reaction due to consumption of peppers, kiwi, peach, watermelon, cocoa and garlic have a significant relationship between the two age groups, where most reactions due to consumption of these products are in children under three years. In the study by Pourreza et al., 50 percent of patients were under one year of age.19 In the study by Nabavi et al., children younger than five years were more sensitive to egg white, egg yolk, and cow's milk cattle compared to children over five years.5 In the study by Ahanchian et al. that was conducted in Mashhad on 207 children from three months to 14 years, the prevalence of food allergens at younger ages was more common, and the most common ones were egg yolk, egg white and cow's milk and the results from these studies are consistent with our study regarding age.20 This is while in the study by Rance et al., peanut has been the most common allergen, especially in children over two years.13 In the early years of life, faults in the development of various components of the immune system reduce the efficiency of this system against various antigens. This could play a more important role in the prevalence of food allergies at an early age.
ConclusionAvoiding contact with allergens again and considering safety issues in dealing with them is necessary. As food allergy in children is one of the major health problems in different societies, accurate identification and determining of the frequency of allergy-inducing foods and avoiding them are the first steps in treatment of food allergy, so the results of this study can be a useful guide in this regard.
Ethical disclosuresConfidentiality of dataThe authors declare that they have followed the protocols of their work centre on the publication of patient data and that all the patients included in the study have received sufficient information and have given their informed consent in writing to participate in that study.
Right to privacy and informed consentThe authors have obtained the informed consent of the patients and/or subjects mentioned in the article. The author for correspondence is in possession of this document.
Protection of human subjects and animals in researchThe authors declare that the procedures followed were in accordance with the regulations of the responsible Clinical Research Ethics Committee and in accordance with those of the World Medical Association and the Helsinki Declaration.
Conflict of interestThe authors have no conflict of interest to declare.
This study was the result of a thesis approved by the Research deputy of Kurdistan University of Medical Sciences and it was conducted under its financial support. We would like to appreciate those who paid special attention to this project.
