


Associations found in time-series studies on hospital emergency room (ER) visits due to asthma and chronic obstructive pulmonary disease (COPD) with single air pollutants show some lack of consistency. The respiratory effects of aeroallergens in the air pollution mix are not well established. Non-linear relationships of different airborne pollen types with certain respiratory diseases have also been described. We aim to study the short-term effects of major air pollutants and aeroallergen pollen on asthma and COPD hospital ER visits in the industrial and Mediterranean Spanish city of Cartagena during 1995–1998.
MethodsThe association of asthma and COPD to ER visits with mean levels of sulphur and nitrogen dioxides (SO2 and NO2), total suspended particles (TSP), ozone (O3), and the main allergenic airborne pollen types were analysed using Poisson regression with Generalised Additive Models, taking into account delayed effects and adjusting for long-term trends, seasonality, weather conditions, holidays and flu notifications.
ResultsMultipollutant models showed a similar relative risk (RR) increase (in %), of around 5% in asthma and COPD ER visits per 10μg/m3 SO2increments. The risk of an ER visit for the same NO2 increment was 2.6% for asthma and 3.3% for COPD. Visits to the ER due to asthma showed a positive increase with both Urticaceae and Poaceae levels, but did not substantially modify the previous percentages.
ConclusionsAir levels of SO2 and NO2 were associated with a substantial increased risk in ER visits due to asthma and COPD. The inclusion of Poaceae and Urticaceae pollen did not alter that association.
The influence of individual ambient air pollutants on hospital emergency room (ER) visits for asthma and COPD in epidemiological time-series studies has been shown to be inconsistent.1–7 Airborne pollen effects on asthma have been shown at the population level on their own8,9 or combined to an air pollutant mix.10 However, few papers have been published on the effect of aeroallergens on COPD exacerbations.11 Furthermore, there is some controversy on the independent relationship that pollen types may have with asthma and COPD because the atmospheric pollutants included in the models did not affect pollen estimators.12,13 While some authors have found additive effects of air pollutants and airborne pollen on asthma,14 others have not.15 On the other hand, some studies have shown that in some cases the relationship between certain pollen types and respiratory diseases is not linear.8,10
Various studies have been conducted in the Spanish Mediterranean cities of Barcelona and Valencia during different periods using similar methodology. In Barcelona, an independent relationship was found between sulphur dioxide (SO2) and black smoke (BS) levels with ER visits due to COPD exacerbations; and of NO2 and BS concentrations with asthma ER visits.2 In Valencia, ER visits for asthma were related to daily averages and maximum hourly concentrations of NO24; and the maximum hourly levels of ozone (O3) and carbon monoxide (CO) increased the risk of ER visits due to COPD.5
The aim the present study was to establish the short-term effects of the major air pollutants and aeroallergen pollen types on hospital ER visits for asthma and COPD in an industrial and Mediterranean Spanish city, during the period 1995–1998.
MethodsThe city of Cartagena is located on the Mediterranean coast in southeast Spain. Its population in the 2001 census was 185,799 (332inhabitants/km2 in 558km2), concentrated in the city centre of an extensive municipality. Unplanned urban development led to large chemical and non-ferrous metallurgical factories being located close to residential areas. Cartagena has a semiarid Mediterranean climate. Weak or calm wind regimes prevail: the south-southeast wind, weak and lacking in humidity, and the north-northeast (40% of the winds) capable of producing rain (annual maximum 136–400mL) caused by storms in the Gulf of Cadiz. Sunny days abound with a mean temperature range of 15–24°C from cold to hot semesters with no very cold season. This zone is almost barren of trees; bushes and weeds are the characteristic vegetation. These bioclimatic conditions make flowering possible throughout the entire year. However, very stable anticyclones accumulate air masses above the city centre increasing atmospheric pollution due to slow dispersion via its port. The sea breeze additionally increases atmospheric pollution due to a very weak pressure gradient in the anticyclonic conditions. Steep mountains and a valley towards the sea surround Cartagena.16
Asthma and COPD hospital emergency room visits dataFollowing a standardised procedure based on previous experience, two trained nurses identified asthma and COPD cases among city residents from the ER registries of the two public general hospitals, those most frequently used for emergencies. In the event of doubt, a physician made the final assignation. The study period was between 1 January 1995 and 31 December 1998. Access to hospital emergency room departments of the Spanish National Health System is free and available to all citizens.
Air pollution and airborne pollen dataAir pollution data came from three urban automatic monitoring stations (Lo Campano, Bastarreche and San Ginés) and one suburban (Alumbres) from the municipal network. The three urban stations measured daily levels of total suspended particles (TSP) and SO2, and two of them (Bastarreche and San Ginés) also collected data on NO2. The suburban station (Alumbres) registered daily O3 levels. Only those pollutants with data for more than 75% of the whole study period were considered. Completeness criteria for O3 started on July 11 of the first year. Air pollution indicators were the daily (0–24h) mean levels (μg/m3) of TSP, SO2 and NO2 and the 9-h O3 maximum.
For pollen counts, the well-known Hirst method sampler VPPS 2000 (Bologna, Italy) developed by Lanzoni™ was used. The sampler was located on the roof (10m above ground level) of the central railway station (37°36′N/0°58′W), and Hirst's capture method and analysis were applied following the quality standards of the Spanish Aerobiological Network and European Allergy Networks. Pollens were identified by microscopic morphology and taxa grouped according to class and genus. Daily levels (grains/m3) of the pollen types with the highest concentration with the major allergenic capacity were selected17: Poaceae (grass) and Urticaceae (including Urtica and Parietaria). Details of the pollen calendar have been previously reported.18
Weather and other dataDaily hour values of minimum and maximum temperature (°C), relative humidity (percentage) and air pressure (hPa), registered at the old quarter of the city were obtained from the Spanish National Agency of Meteorology (AENET). The number of weekly influenza cases was collected from the regional registry of communicable diseases.
Statistical analysisTo estimate the short-term effects of air pollution and grains of different pollen types on asthma and COPD hospital ER visits, the Spanish adaptation of the APHEA-2 protocol was followed19,20 using Poisson regression with Generalised Additive Models. A core model was fit, including the smoothing functions to remove long-term trends and seasonality with a period range of 90–210 days. Afterwards, weather indicators, influenza cases notification, day of the week, and public holidays (the last two factors as dummy variables), were added. The choice of degrees of freedom (df) for the smoothing cubic splines of any weather variables and influenza cases was made by minimisation of the Akaike Information Criterion, using between 2 and 4 df and on minimisation of the partial autocorrelation residuals. Once the core model was fit, the effects of the current day and individual lags of up to 4 days for air pollutants and pollen types were assessed using single-pollutant models. Furthermore, considering that simultaneous exposure to other pollutants might be a potential source of variation, multipollutant models were also considered in order to adjust for TSP, SO2 and, NO2 and O3, respectively in pairs. Finally, pollen types were included in both multipollutant models. Possible non-linearity of air pollutants and pollen types were tested.
Because of the large number of pollen and lag tests, this paper emphasizes the consistency of associations across lags and measures and discusses only the more highly significant findings (p<0.01). Analyses were carried out using S-Plus statistical software (Insightful Corporation, Seattle, WA, USA) using restrictive convergence parameters to avoid any bias in the iterative process,21 and GAM exact estimations to avoid concurvity.22
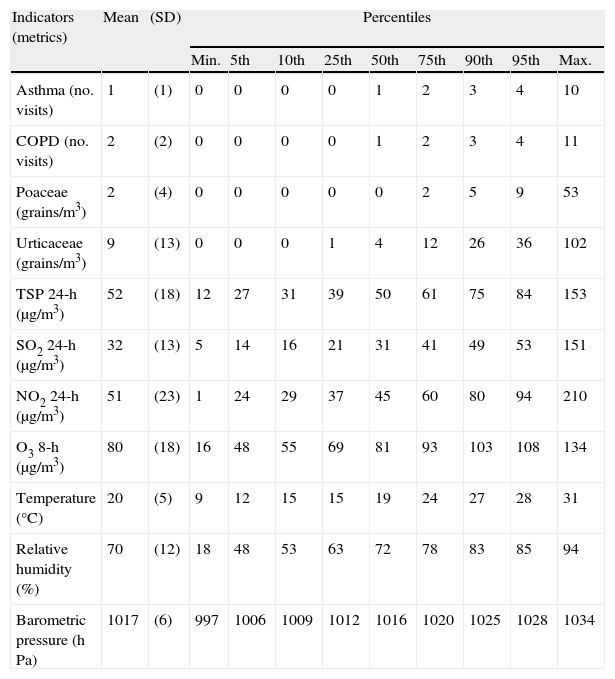
ResultsDuring the 4-year period, a total of 1617 asthma and 2322 COPD hospital ER visits were recorded, meaning a daily range from 0 to 10 and 0 to 11 ER, respectively (Table 1). No asthma or COPD epidemics were observed (Fig. 1).
Daily emergency room visits for asthma and COPD, aeroallergen pollen types and air pollutants concentrations, and weather conditions indicators.
| Indicators (metrics) | Mean | (SD) | Percentiles | ||||||||
| Min. | 5th | 10th | 25th | 50th | 75th | 90th | 95th | Max. | |||
| Asthma (no. visits) | 1 | (1) | 0 | 0 | 0 | 0 | 1 | 2 | 3 | 4 | 10 |
| COPD (no. visits) | 2 | (2) | 0 | 0 | 0 | 0 | 1 | 2 | 3 | 4 | 11 |
| Poaceae (grains/m3) | 2 | (4) | 0 | 0 | 0 | 0 | 0 | 2 | 5 | 9 | 53 |
| Urticaceae (grains/m3) | 9 | (13) | 0 | 0 | 0 | 1 | 4 | 12 | 26 | 36 | 102 |
| TSP 24-h (μg/m3) | 52 | (18) | 12 | 27 | 31 | 39 | 50 | 61 | 75 | 84 | 153 |
| SO2 24-h (μg/m3) | 32 | (13) | 5 | 14 | 16 | 21 | 31 | 41 | 49 | 53 | 151 |
| NO2 24-h (μg/m3) | 51 | (23) | 1 | 24 | 29 | 37 | 45 | 60 | 80 | 94 | 210 |
| O3 8-h (μg/m3) | 80 | (18) | 16 | 48 | 55 | 69 | 81 | 93 | 103 | 108 | 134 |
| Temperature (°C) | 20 | (5) | 9 | 12 | 15 | 15 | 19 | 24 | 27 | 28 | 31 |
| Relative humidity (%) | 70 | (12) | 18 | 48 | 53 | 63 | 72 | 78 | 83 | 85 | 94 |
| Barometric pressure (hPa) | 1017 | (6) | 997 | 1006 | 1009 | 1012 | 1016 | 1020 | 1025 | 1028 | 1034 |
 and aeroallergen pollen types (grains/m3) concentrations.")
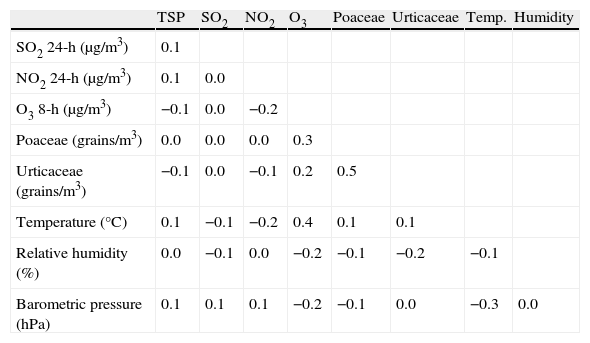
Total suspended particles showed a more predominant cold-season pattern, while ambient air SO2 and NO2 pollutants were distributed more homogeneously. Ozone showed a seasonal peak during the summer months. Poaceae (grass) levels had a seasonal distribution with higher concentrations between May and June, whereas Urticaceae flowered throughout the year, especially between March and June. Correlations between air pollutants, pollen counts and weather conditions are shown in Table 2.
Correlation coefficientsa among daily air pollutants aeroallergen and pollen types concentrations, and weather conditions indicators.
| TSP | SO2 | NO2 | O3 | Poaceae | Urticaceae | Temp. | Humidity | |
| SO2 24-h (μg/m3) | 0.1 | |||||||
| NO2 24-h (μg/m3) | 0.1 | 0.0 | ||||||
| O3 8-h (μg/m3) | −0.1 | 0.0 | −0.2 | |||||
| Poaceae (grains/m3) | 0.0 | 0.0 | 0.0 | 0.3 | ||||
| Urticaceae (grains/m3) | −0.1 | 0.0 | −0.1 | 0.2 | 0.5 | |||
| Temperature (°C) | 0.1 | −0.1 | −0.2 | 0.4 | 0.1 | 0.1 | ||
| Relative humidity (%) | 0.0 | −0.1 | 0.0 | −0.2 | −0.1 | −0.2 | −0.1 | |
| Barometric pressure (hPa) | 0.1 | 0.1 | 0.1 | −0.2 | −0.1 | 0.0 | −0.3 | 0.0 |
The baseline GAM model finally selected used smoothing cubic splines function adjustments for long-term trends and seasonality with a frame window of 210 days for asthma and 150 days for COPD; for the temperature on the current day it was with 2 df and 3 df for influenza cases on the current day. Dummy variables for the days of the week and public holidays were included. The models did not show residual autocorrelation, overdispersion, or concurvity, after GAM exact estimations.
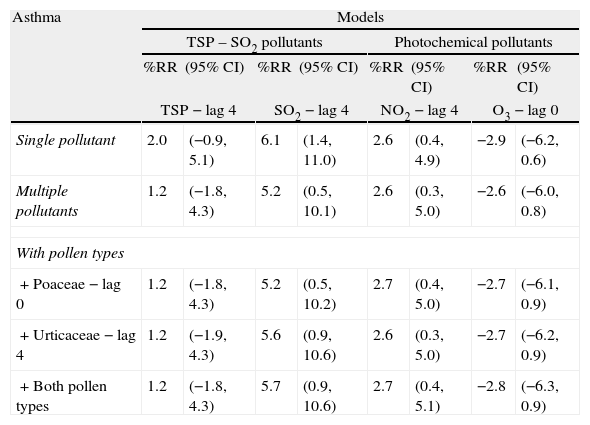
Table 3 shows the daily percentage of relative risks (%RR) and a 95% confidence interval (95% CI) on asthma and COPD hospital ER visit variations for a 10μg/m3 increase in each air pollutant for both the single and multiple pollutant models. The lag describing the strongest association with asthma was the fourth day for all pollutants except O3, which was related to the current day. For COPD, the greatest risk occurred on the same day as the contaminants except for O3, which was at the fourth lag. Furthermore, SO2 and NO2 were the pollutants revealing a positive statistically significant association with asthma and COPD emergency visits. A 10μg/m3 rise in each pollutant was associated with a risk increase slightly less than 7% for both outcomes and SO2; the increases for NO2 were 2.6% and 3.8%, respectively.
Relative risks and 95% confidence interval of asthma and COPD hospital emergency room visits for an increase of 10μg/m3 of air pollutant and of 1grain/m3 of aeroallergen pollen types.
| Asthma | Models | |||||||
| TSP – SO2 pollutants | Photochemical pollutants | |||||||
| %RR | (95% CI) | %RR | (95% CI) | %RR | (95% CI) | %RR | (95% CI) | |
| TSP − lag 4 | SO2 − lag 4 | NO2 − lag 4 | O3 − lag 0 | |||||
| Single pollutant | 2.0 | (−0.9, 5.1) | 6.1 | (1.4, 11.0) | 2.6 | (0.4, 4.9) | −2.9 | (−6.2, 0.6) |
| Multiple pollutants | 1.2 | (−1.8, 4.3) | 5.2 | (0.5, 10.1) | 2.6 | (0.3, 5.0) | −2.6 | (−6.0, 0.8) |
| With pollen types | ||||||||
| + Poaceae − lag 0 | 1.2 | (−1.8, 4.3) | 5.2 | (0.5, 10.2) | 2.7 | (0.4, 5.0) | −2.7 | (−6.1, 0.9) |
| + Urticaceae − lag 4 | 1.2 | (−1.9, 4.3) | 5.6 | (0.9, 10.6) | 2.6 | (0.3, 5.0) | −2.7 | (−6.2, 0.9) |
| + Both pollen types | 1.2 | (−1.8, 4.3) | 5.7 | (0.9, 10.6) | 2.7 | (0.4, 5.1) | −2.8 | (−6.3, 0.9) |
| COPD | Models | |||||||
| TSP – SO2 pollutants | Photochemical pollutants | |||||||
| %RR | (95% CI) | %RR | (95% CI) | %RR | (95% CI) | %RR | (95% CI) | |
| TSP − lag 0 | SO2 − lag 0 | NO2 − lag 0 | O3 − lag 4 | |||||
| Single pollutant | 3.2 | (0.8, 5.7) | 6.9 | (3.3, 10.7) | 3.8 | (2.0, 5.6) | 7.7 | (1.9, 13.7) |
| Multiple pollutants | 2.3 | (−0.2, 4.8) | 5.2 | (1.5, 8.9) | 3.3 | (1.4, 5.3) | 4.1 | (−0.8, 9.2) |
| With pollen types | ||||||||
| + Poaceae − lag 0 | 2.4 | (−0.1, 4.9) | 5.1 | (1.5, 8.9) | 3.3 | (1.4, 5.3) | 4.0 | (−0.9, 9.1) |
| + Urticaceae − lag 4 | 2.3 | (−0.2, 4.8) | 5.0 | (1.3, 8.7) | 3.2 | (1.3, 5.2) | 4.0 | (−0.9, 9.2) |
| + Both pollen types | 2.4 | (−0.1, 4.9) | 5.0 | (1.3, 8.7) | 3.2 | (1.3, 5.2) | 4.0 | (−0.9, 9.2) |
Relative risks in %: %RR, 95% confidence interval: 95%CI. 95% CI values from negative to positive indicates no statistical significance.
The inclusion of TSP in the model with two pollutants reduces the SO2 effect by 5.2%, whereas the insertion of O3 in the model with two photochemical pollutants practically did not markedly affect the NO2 estimation. Lastly, the models with two pollutants incorporated the pollen types with individual and combined inclusion of the current day Poaceae levels and the Urticaceae 4-day lag, as these evidenced the best adjustment in the models. The inclusion of pollen types and their interactions did not markedly change the magnitude of the estimated effect of SO2 on asthma or COPD hospital ER visits.
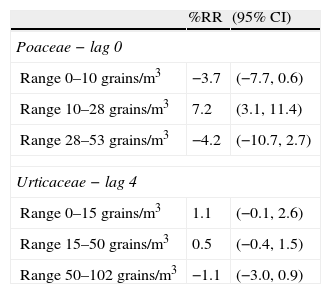
A GAM model was used to assess possible non-linear effects of pollen types, adjusting simultaneously for all air pollutants and including both pollen types with natural cubic spline functions, with 3 df for Poaceae and 4 df for Urticaceae. Fig. 2 illustrates the non-parametric adjustment of the relationship between pollen types and asthma emergency room visits, revealing a clear non-linear relationship of asthma, with inflection points at levels of 10 and 28grains of Poaceae and 15 and 50grains of Urticaceae. Table 4 shows the RR of emergency room visits for asthma associated with a pollen rise of 1grain/m3 for both pollen types in three linear ranges, defined from the inflection points observed in Fig. 1. A statistically significant increased risk of 7.2% was observed for a rise of 1grain/m3 in the 10–28grain range. For Urticaceae, a quantitative 1.1% increase in risk was obtained in the 0–15grain range.
 on asthma hospital emergency room visits.")
Relative risks and 95% confidence intervals of asthma hospital emergency room visits for an increase of 1grain/m3 in the aeroallergen pollen type.
| %RR | (95% CI) | |
| Poaceae − lag 0 | ||
| Range 0–10grains/m3 | −3.7 | (−7.7, 0.6) |
| Range 10–28grains/m3 | 7.2 | (3.1, 11.4) |
| Range 28–53grains/m3 | −4.2 | (−10.7, 2.7) |
| Urticaceae − lag 4 | ||
| Range 0–15grains/m3 | 1.1 | (−0.1, 2.6) |
| Range 15–50grains/m3 | 0.5 | (−0.4, 1.5) |
| Range 50–102grains/m3 | −1.1 | (−3.0, 0.9) |
Day lag showed the strongest association from actual to last day lags. Relative risks: %RR, 95% confidence interval: 95%CI. 95% CI of %RR from negative to positive indicates no statistical significance.
Ambient air levels of SO2 and NO2 related positively and significantly with a substantial increase in asthma and COPD emergency room visits in the present study. The multipollutant and multipollen model did not modify these associations. Pollen types did not demonstrate an adverse effect on COPD hospital ER visits. However, the risk of asthma showed a positive increase with Urticaceae (0–50grains/m3) and significance with mild (10 and 28grains/m3) levels of Poaceae.
Mucociliar epithelial mucus, as a rich source of antioxidants, plays a major role in protecting bronchial airways against inhaled particles and SO2. Its overproduction is a pathogenetic feature of asthma and COPD and mediated by some cytokines.23 Both diseases show systemic inflammation with common and disease-specific markers.24 The distinction between asthma and COPD is blurred in severe asthma, asthmatic smokers, and in exacerbations.25 Some authors have argued that PM10 toxicity is higher with decreasing particle size, does not depend much upon chemical composition, and damages airway epithelium through oxidative stress in the susceptible population.26 However, in a study in Barcelona of mortality effects of Saharan dust outbreaks, found risk associated to coarse particles (PM10 to >2.5) but not to PM2.5, showing that particulate matter differences in chemical composition did not explain these results.27 It is unlikely that pollutants could convert a non-atopic individual into an atopic one; yet with a genetic predisposition and enough exposure, someone could become sensitised to allergens.28
The SO2 was the gas least often associated to asthma emergencies. A study in Tel-Aviv (Israel) reported a significant association to current or previous-day SO2 levels.29 Other studies found no such effects on asthma.10,30 Moreover, a lack of association was reported in Spain, in cities including Barcelona,2 Valencia4 and Madrid.6 Contrary to this, ER visits for COPD in Barcelona2 and Saint John (Canada)10 increased significantly along with increases in SO2 levels. Longer term exposure to extremely high and steady levels of industrial SO2 in Cartagena in the past decades – a mean yearly range between 200 and 300μg/m3 in the 1980s,31 might have caused or exacerbated chronic bronchitis or COPD, while increasing airway inflammation and hyperresponsiveness in asthmatics.
Particulate matter less than 10μm in aerodynamic diameter (PM10) has been the most-used air pollutant in time-series studies of short-term effects. Some studies have shown that particles exert a significant adverse effect on asthma emergency room visits.1,6,32 Moreover, a review paper on COPD and air pollution referred to a certain consistent association of BS and PM10 in hospital emergencies, being particulates the second trigger for COPD.11 However, population studies using TSP or BS failed to find significant association with asthma2,4 or COPD.3 An explanation on the lack of deleterious effects from the mix of total particles (PM10 and BS) in Cartagena suggests that this mix is probably composed mainly of industrial white fumes (bicalcic phosphate), local soil erosion and African intrusion dust, but not from engine combustion pollutants.16,33
The photochemical pollutant most frequently studied in European cities has been NO2, but the APHEA framework did not detect that association in Barcelona using hospital emergency admissions as the main outcome.34 Conversely, in Valencia an increase of the risk of asthma ER visits of 7.6% (2.0–13.4%) for a 10μg/m3 pollutant increase at lag 0 was observed.4 A similar risk was found in Madrid for asthma (3.3%, 1.3–5.4%) associated to the pollutant level of the third-day lag,6 which is similar to that obtained in our study for lag 4. In Atlanta (USA), four million ER visits at 31 hospitals showed that the maximum 1-h daily level of NO2 was positively and significantly associated with asthma ER visits at 5- and 8-day lags. Furthermore, the levels of that pollutant were even more strongly associated with COPD ER visits at the current and 1-day lag.7
Ozone has been the pollutant most often related to hospital emergencies for asthma in North America10,35 and Europe.4,6 While the magnitude of the relationship varied considerably, so did the lag for the best association. Ozone is the atmospheric pollutant posing the most consistent risk for COPD emergency room visits.11 In Spain, O3 1h-max ambient air levels were significantly higher on days with larger numbers of COPD ER visits in Barcelona2 and Valencia, which was positively related to asthma.5 Photochemical multipollutant models in Cartagena established the association with COPD on the current day for NO2 and the fourth for O3. In our case, O3 was always associated positively with asthma ER (generating at least a 4% risk excess), but it lost significance with NO2 addition of O3. Furthermore, the NO2 1h-max was over 140μg/m3 during more than 18 days, all years; while O3 8-h did not exceed 120μg/m3 in more than 25 days per year during the 3 years studied.36 Although the O3 8h-max levels were higher than in Barcelona or Valencia, the NO2 24h was lower than in these cities.19 Thus, the levels recorded at the NO2 stations were not the only precursors of O3, probably due to the winds and hills which are perpendicular to the sea shore.
Asthma ER visits in Cartagena showed a non-linear association with Urticaceae and Poaceae pollens. This non-linear relationship has already been reported in other Spanish cities.8,9 An increased risk for low-to-medium levels of both pollen types was observed, possibly revealing the induction of non-epidemic asthma outside the period of maximum pollination. This phenomenon was reported earlier for the same pollen types and asthma ER visits in Madrid.8 Our results were consistent with the literature using ER outcomes.8,10,13,15 These studies described an effect for grass pollen levels on asthma morbidity between lags of to 4 days. The delayed effect may be consistent with the biological action mechanism of aeroallergens through a so-called priming effect,37 which shows a higher clinical impact as the pollen season advances. In our study, 10grains/m3 was the threshold for a grass pollen effect, which was limited to 50grains/m3 in another study.15 Other authors found asthma morbidity not associated to some pollen types.7 This lack of consistency might be due to allergen types and pollination calendars in different geographical and climate patterns14 as well as atopy prevalence.38
Several authors in metropolitan areas (Madrid, London, Paris, and Atlanta) included different pollen types in their analyses6,7,10,14 observing an independent relationship of air pollutant effects on asthma of pollen types. Doubts exist about the presence of a modifier effect in the relationship between pollen and asthma indicators,14,39 but this was not found in our data, nor so in another recent one in the metropolitan area of Paris.40
Our study suffers from the typical limitations of time-series studies concerning ambient air exposure accuracy and the small magnitude of associations, which must be interpreted with caution, although it is relevant in public health from the community general exposition. Furthermore, only major and classical cold-season (TSP-SO2) and photochemical air pollutants were considered. Based on our study, Mediterranean cities should implement monitoring programs for pollen types with higher allergenicity power, preferably in combination with air pollutants network. Both kinds of pollutants, atmospherical and biological, represent a risk factor for patients suffering from asthma or COPD.
Conflict of interestThe authors have no conflict of interest to declare.
We would like to thank partial funding from CIBER Epidemiología y Salud Pública (CIBERESP), Spain. Also thanks go to José Medrano and Mª Aurelia Martínez-Victoria for data collection; Drs. María Jesús Avilés and Soledad Zamarro for clinical advice; Juan Carlos Casado for his comments on air pollution legislation; and to Agustín Vidal, on behalf of the former Air Pollution Centre Control of the Cartagena City Council, for providing data of pollutants.
