


In 2005 the Althaia Foundation Allergy Department performed its daily activity in the Hospital Sant Joan de Deu of Manresa. Given the increasing demand for allergy care, the department's performance was analysed and a strategic plan (SP) for 2005–2010 was designed.
The main objective of the study was to assess the impact of the application of the SP on the department's operations and organisational level in terms of profitability, productivity and quality of care.
Material and methodsDescriptive, retrospective study which evaluated the operation of the allergy department. The baseline situation was analysed and the SP was designed. Indicators were set to perform a comparative analysis after application of the SP.
ResultsThe indicators showed an increase in medical care activity (first visits, 34%; successive visits, 29%; day hospital treatments, 51%), high rates of resolution, reduced waiting lists. Economic analysis indicated an increase in direct costs justified by increased activity and territory attended. Cost optimisation was explained by improved patient accessibility, minimised absenteeism in the workplace and improved cost per visit.
ConclusionsAfter application of the SP a networking system was established for the allergy speciality that has expanded the territory for which it provides care, increased total activity and the ability to resolve patients, optimised human resources, improved quality of care and streamlined medical costs.
The Althaia Foundation is a healthcare referral network for 188,000 inhabitants of regions of Central Catalonia. It has a number of centres: Hospital Sant Joan de Deu (HSJD/public medicine), Centre Hospitalari (CH/public medicine), Clinic Sant Josep (CSJ/private and sports medicine), CESAM (Mental Health) and two primary care centres. In the 2005 health care model, allergists were located in HSJD, and patients had to travel to receive their treatment.
The primary objective of the study is to analyse the value of measures designed and subsequently implemented under the strategic plan (SP) for service 2005–2010, which are:
- •
To validate whether the measures applied in the SP are appropriate. To assess the impact of the implementation of the SP.
- •
To compare our care model with other allergy departments in the same setting (benchmarking).
- •
To improve the department's performance by adapting the most appropriate cost possible: Profitability and Productivity.
- •
To maintain and/or improve the quality standard.
- •
Adaptation to all new demands for care in our referral area and to proposals and objectives established by the health authorities.
- •
Strengthening the department's organisational model. Implementation of the organisational model in medical visits, day hospital (DH) and hospitalisation.
- •
Promote coordination with primary care (PC).
In this study it was important to assess the environment and adjust performance accordingly before study initiation:
- •
gradual increase in demand for allergy care;
- •
difficulty in finding professionals;
- •
inability to minimise the prevalence of allergic disease; and
- •
need to respond to demand, without cost overruns, optimising existing resources (human and financial) with quality practices.
Thus it was necessary to:
- •
Analyse the allergy department situation in 2005.
- •
Define reliable/appropriate indicators enabling a comparative analysis between the situation in 2005 and the following years.
- •
Establish a specific SP.
Descriptive, retrospective study that assessed the operation of the Althaia Foundation allergy department.
In order to provide data to allow performing the assessment of measures resulting from SP, analysis time was partitioned into two distinct periods (before processing the SP and after the application of corrective measures, whose origin was the SP itself).
In the first period (2005), an analysis of service performance was conducted.
- 1.
External analysis: Social/demographic setting, Political/economic/technological setting.
- 2.
Internal analysis: Architectural resources, Human resources, Activities conducted, Work flows, Quality control.
Subsequently:
- -
Identification of problems/threats and proposal of improvement strategies.
- -
Benchmarking.
- -
Design and implementation of SP (2005–2010).
The development of an SP according to traditional methodology was made based on data obtained from various sources: population of the record of the Statistical Institute of Catalonia (Idescat), economic information of Althaia's Management Control Unit, hospital activity and functional plan from allergy department's own activity logs and Management Control Unit, and analytic data of Althaia's Department of Biological Diagnosis.
Finally indicators were designed to enable a comparison before and after the application of the SP:
- •
Waiting time for first visit.
- •
Number of first visits (FV).
- •
Number of successive visits (SV).
- •
FV/SV ratio.
- •
Number of DH.
- •
Index specific IgE determinations/patient.
- •
Expenditure per pathology (case-mix groups).
- •
Allergist/no. inhabitants ratio.
In 2005 the HSJD of Manresa was the only centre in Central Catalonia with an allergy department. In 2005 private alternative medical care was very limited and was provided by allergists unrelated to HSJD. In the Pla de Salut de Catalunya during this period there was no clear specification for the speciality of allergology.
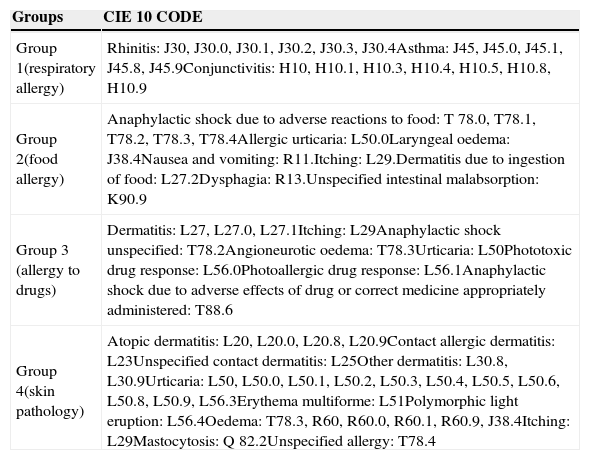
Some of the tests included in the portfolio of services cannot be performed immediately and are scheduled on different days (patch tests, drug studies, etc.). Depending on the patients’ pathology they were divided into four case-mix groups (Table 1). Table 2 shows the activity data in 2005.
Division by pathologies according to code CIE 1.
| Groups | CIE 10 CODE |
|---|---|
| Group 1(respiratory allergy) | Rhinitis: J30, J30.0, J30.1, J30.2, J30.3, J30.4Asthma: J45, J45.0, J45.1, J45.8, J45.9Conjunctivitis: H10, H10.1, H10.3, H10.4, H10.5, H10.8, H10.9 |
| Group 2(food allergy) | Anaphylactic shock due to adverse reactions to food: T 78.0, T78.1, T78.2, T78.3, T78.4Allergic urticaria: L50.0Laryngeal oedema: J38.4Nausea and vomiting: R11.Itching: L29.Dermatitis due to ingestion of food: L27.2Dysphagia: R13.Unspecified intestinal malabsorption: K90.9 |
| Group 3 (allergy to drugs) | Dermatitis: L27, L27.0, L27.1Itching: L29Anaphylactic shock unspecified: T78.2Angioneurotic oedema: T78.3Urticaria: L50Phototoxic drug response: L56.0Photoallergic drug response: L56.1Anaphylactic shock due to adverse effects of drug or correct medicine appropriately administered: T88.6 |
| Group 4(skin pathology) | Atopic dermatitis: L20, L20.0, L20.8, L20.9Contact allergic dermatitis: L23Unspecified contact dermatitis: L25Other dermatitis: L30.8, L30.9Urticaria: L50, L50.0, L50.1, L50.2, L50.3, L50.4, L50.5, L50.6, L50.8, L50.9, L56.3Erythema multiforme: L51Polymorphic light eruption: L56.4Oedema: T78.3, R60, R60.0, R60.1, R60.9, J38.4Itching: L29Mastocytosis: Q 82.2Unspecified allergy: T78.4 |
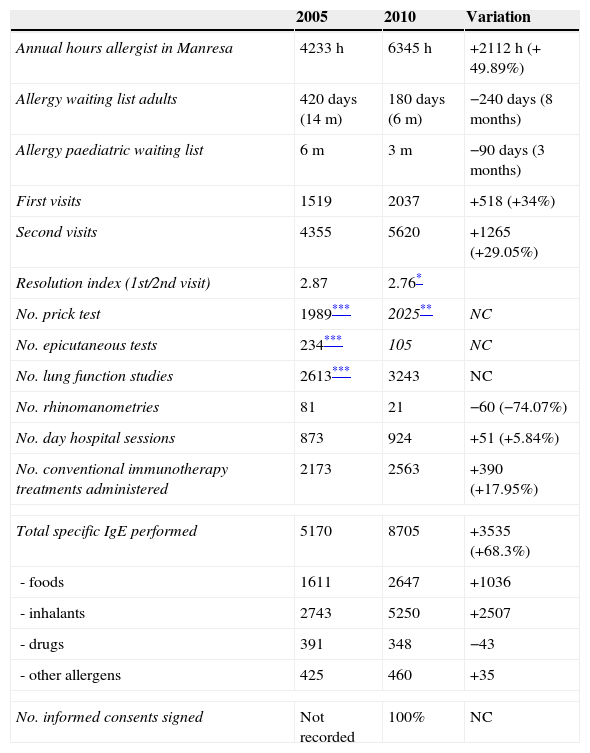
Comparative analysis years 2005–2010 (activity in Manresa).
| 2005 | 2010 | Variation | |
|---|---|---|---|
| Annual hours allergist in Manresa | 4233h | 6345h | +2112h (+ 49.89%) |
| Allergy waiting list adults | 420 days (14m) | 180 days (6m) | −240 days (8 months) |
| Allergy paediatric waiting list | 6m | 3m | −90 days (3 months) |
| First visits | 1519 | 2037 | +518 (+34%) |
| Second visits | 4355 | 5620 | +1265 (+29.05%) |
| Resolution index (1st/2nd visit) | 2.87 | 2.76* | |
| No. prick test | 1989*** | 2025** | NC |
| No. epicutaneous tests | 234*** | 105 | NC |
| No. lung function studies | 2613*** | 3243 | NC |
| No. rhinomanometries | 81 | 21 | −60 (−74.07%) |
| No. day hospital sessions | 873 | 924 | +51 (+5.84%) |
| No. conventional immunotherapy treatments administered | 2173 | 2563 | +390 (+17.95%) |
| Total specific IgE performed | 5170 | 8705 | +3535 (+68.3%) |
| -foods | 1611 | 2647 | +1036 |
| -inhalants | 2743 | 5250 | +2507 |
| -drugs | 391 | 348 | −43 |
| -other allergens | 425 | 460 | +35 |
| No. informed consents signed | Not recorded | 100% | NC |
NC: not calculable.
The initial situation analysis allowed to describe the strengths and weaknesses of the department as well as the threats and opportunities (SWOT matrix), basis of the SP:
- •
Strengths: 1. Institutional positioning (Althaia Foundation). Willingness to work in network and to be a reference in the territory. 2. Head of service: visionary and credible. 3. Allergy service: reference in Central Catalonia. 4. Participation in cooperative research projects. 5. Teaching: participation in courses, publications, request allergy MIR accreditation. 6. Service depends on the Department of Pediatrics.
- •
Weaknesses: 1. Unstable staff. 2. Inadequate resources human/activity to develop. 3. Lack of control on waiting list. Poor communication with primary care. 4. Absence of own computer activity logs. 5. Absence of internal/external action protocols agreed upon according to each pathology. 6. Location of day hospital.7. Need for improvements in diagnostic techniques and treatments. 8. Excessive waiting time for specific paediatric studies.
- •
Opportunities: 1. Population pyramid 2. Increasing immigration. 3. Complete management of the waiting list. 4 Allergological needs not covered in other territories. 5. Small number of allergists. 6. Lack of activity in private paediatric allergology. 7. Expansion of the Hospital.
- •
Threats: 1. Regressive population pyramid 2. Increased immigration. 3. Lack of control of waiting list. 4. External competitors: area Metropolitana, Berga Hospital. 5. Internal competitors: pulmonology, otolaryngology, dermatology. 6. Few Allergists. 7. Vagueness in the Pla de Salut.
As a consequence of the SP, specific measures were implemented which resulted in improved system performance, patient care and improvements in the department itself.
- 1.
Increase in the territory for which the Althaia Foundation provides care through movement of the allergist to other centres (Igualada, Andorra, CSJ) and creation of a networking system.
- 2.
To provide private medical care in paediatric allergology, as part of this network.
- 3.
To establish a pilot programme to reduce the waiting list:
- •
Development and implementation of specific referral protocols.
- •
Conducting initial visits screening in PC.
- •
To improve communication with PC: regular meetings, specific e-mail account.
- •
To obtain DH nursing support.
- •
To reorganise the scheduling of paediatric allergy DH.
- •
- 4.
Innovation/improvement in diagnosis and treatment. Improvement in quality of care.
- •
Establishment of determination of exhaled nitric oxide technique and bronchial challenge tests.
- •
Diagnosis using recombinant allergens.
- •
Application of cluster patterns in immunotherapy.
- •
Desensitisation treatments for food and drugs.
- •
- 5.
To perform weekly clinical sessions with the whole team.
- 6.
Increase allergist hours to develop all these changes.
- 1.
In 2010 the Althaia Foundation allergy department expanded its territory for providing medical care: Hospital de Igualada (Consorci Sanitari Anoia) and Hospital Nostra Senyora de Meritxell (Andorra). Private medical care activity was begun in the CSJ.
- 2.
Increase in allergist hours and work areas available.
- 3.
Creation of an allergy network for Central Catalonia.
- 4.
Implementation of the pilot scheme to reduce the waiting list has reduced the time to first hospital visit by several months (Table 2). The plan was carried out for 10 months. The allergist performed visits and tests (prick/spirometry) in PC centres without nursing assistance. The maximum waiting time was 30 days, the patient avoided travelling to the hospital, the level of absenteeism was lower than in the hospital (3.4% vs. 29.5% hospital), the degree of patient satisfaction was high and the relationship with primary care physicians improved (developing agreed-upon referral protocols and creation of a specific e-mail account).1,2
The number of first visits increased mainly due to the increase in the total number of hours dedicated to medical care and, to a lesser extent, by the addition of a nurse in the DH that has allowed the attending physician to conduct his/her activities while monitoring challenge tests (Table 2). Thus in 2010, there were a total of 3018 first visits and 7359 successive visits (Fig. 1).
If the activity in Igualada and Andorra is included, the 1st/2nd visit ratio is significantly reduced from 2.87 in 2005 to 2.44 in 2010 (Fig. 1). There is also a clear increase in day hospital visits.
- 5.
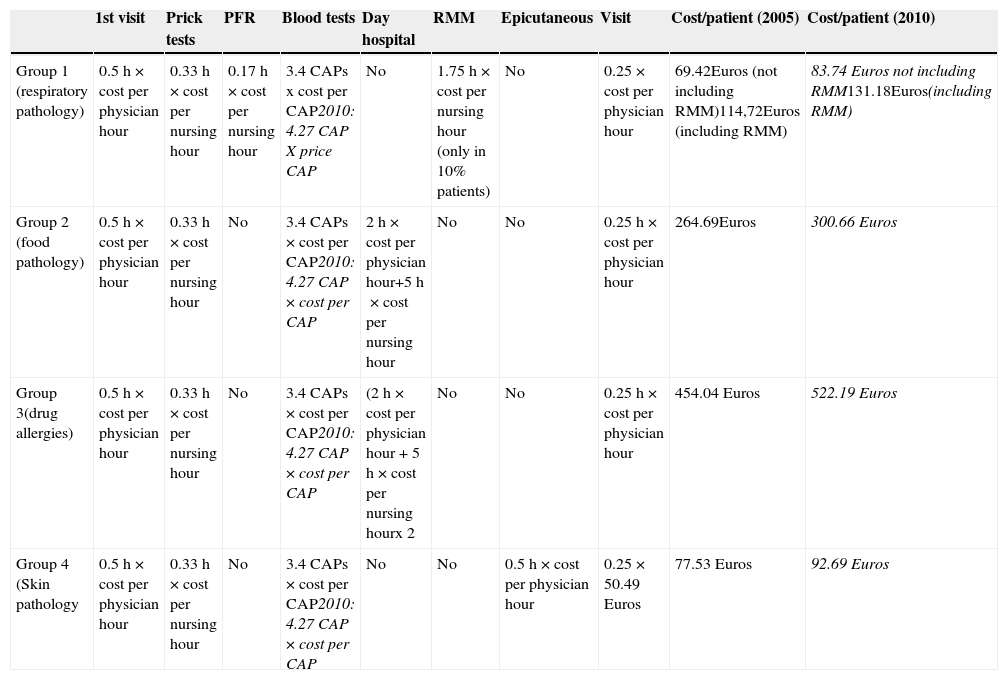
An estimate was made of the expense of an allergy study. An exact economic analysis cannot be performed because there are no computerised records of activity in 2005. Patients were classified into four case-mix groups and a complete cost approximation was performed according to usual study protocols (Tables 1 and 3). Cost per visit or examination was calculated based on the time spent by the professional. Calculation of analytical determination costs was made by multiplying the average cost per allergen by the average number of allergens requested per patient.
Table 3.Approximate full costs per patient for consultation.
1st visit Prick tests PFR Blood tests Day hospital RMM Epicutaneous Visit Cost/patient (2005) Cost/patient (2010) Group 1 (respiratory pathology) 0.5h×cost per physician hour 0.33h×cost per nursing hour 0.17h×cost per nursing hour 3.4 CAPs x cost per CAP2010: 4.27 CAP X price CAP No 1.75h×cost per nursing hour (only in 10% patients) No 0.25×cost per physician hour 69.42Euros (not including RMM)114,72Euros (including RMM) 83.74 Euros not including RMM131.18Euros(including RMM) Group 2 (food pathology) 0.5h×cost per physician hour 0.33h×cost per nursing hour No 3.4 CAPs×cost per CAP2010: 4.27 CAP×cost per CAP 2h×cost per physician hour+5h×cost per nursing hour No No 0.25h×cost per physician hour 264.69Euros 300.66 Euros Group 3(drug allergies) 0.5h×cost per physician hour 0.33h×cost per nursing hour No 3.4 CAPs×cost per CAP2010: 4.27 CAP×cost per CAP (2h×cost per physician hour+5h×cost per nursing hourx 2 No No 0.25h×cost per physician hour 454.04 Euros 522.19 Euros Group 4 (Skin pathology 0.5h×cost per physician hour 0.33h×cost per nursing hour No 3.4 CAPs×cost per CAP2010: 4.27 CAP×cost per CAP No No 0.5h×cost per physician hour 0.25×50.49 Euros 77.53 Euros 92.69 Euros Cost per physician/hour (2010): 50.64 Euros, nursing cost/hour: 27.11 Euros.* Mean CAP cost 2005: 6.81 Euros, mean CAP cost 2010: 7.57 Euros. PFR: lung function tests, RMM: rhinomanometry.

It should be kept in mind as potential biases that a patient could have multiple reasons for the consultation, and therefore belong to several groups at once. In addition, some patients do not complete the study and there is no accounting of consumables used in the examination.
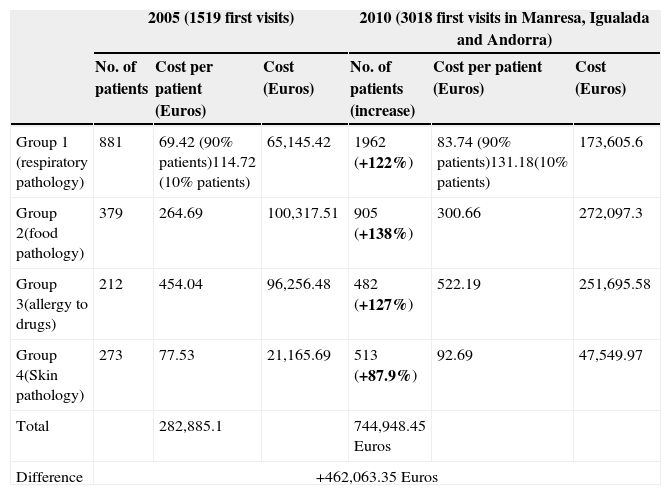
Table 4 shows a comparison of the costs before and after the application of the SP.
Comparative costs according to pathologies between 2005 and 2010.
| 2005 (1519 first visits) | 2010 (3018 first visits in Manresa, Igualada and Andorra) | |||||
|---|---|---|---|---|---|---|
| No. of patients | Cost per patient (Euros) | Cost (Euros) | No. of patients (increase) | Cost per patient (Euros) | Cost (Euros) | |
| Group 1 (respiratory pathology) | 881 | 69.42 (90% patients)114.72 (10% patients) | 65,145.42 | 1962 (+122%) | 83.74 (90% patients)131.18(10% patients) | 173,605.6 |
| Group 2(food pathology) | 379 | 264.69 | 100,317.51 | 905 (+138%) | 300.66 | 272,097.3 |
| Group 3(allergy to drugs) | 212 | 454.04 | 96,256.48 | 482 (+127%) | 522.19 | 251,695.58 |
| Group 4(Skin pathology) | 273 | 77.53 | 21,165.69 | 513 (+87.9%) | 92.69 | 47,549.97 |
| Total | 282,885.1 | 744,948.45 Euros | ||||
| Difference | +462,063.35 Euros | |||||
In recent years, the population in our country has been increasing due to longer life expectancy and migration.3 The WHO has warned about the health impact of the progressive ageing of the population, estimating that overall spending on health care will increase by 41% between 2000 and 2050.4
In recent decades there is an increase in the prevalence of allergic diseases and consequently an increased demand for allergy care.5,6 This fact is clearly related to the characteristics of the occidental lifestyle, which encompasses factors such as dietary habits, exposure to allergens, environmental pollution and ease of access to health care, among others.7,8 The increase in the immigrant population, mostly young and with children, has led to increased respiratory disease and longer life expectancy, resulting in more studies on skin drug-related pathologies. Increased demand forces us to rethink the current care model more focused on hospital care, aiming for another model based on a coordinated network of services that provide continuity between levels of care.
In the work presented PC participation has been positive and has helped establish a basis for collaboration with PC.1,2
In our setting, the increased territory for which allergy care is provided through the creation of strategic alliances (under the SP)9 has diversified the allergy study as awareness profiles obviously vary depending on the geographical area. According to WHO an allergist is required for every 50,000 inhabitants.10
After application of the SP the Althaia Foundation allergy department strengthened its role as a referral allergy service in Central Catalonia. The increase in physician hours (97h/week in 2005 to 122h in 2010) and the addition of two professionals to the team has enhanced the care activity. The allergist/inhabitants ratio in our current coverage area (383,082 inhabitants) is still far from WHO recommendations (1:50,000 population); 7.67 allergists are still needed. Even with these data the current relationship of an allergist for every 63,847 inhabitants is better than the Catalan average in 2010 (1/140,000 inhabitants).
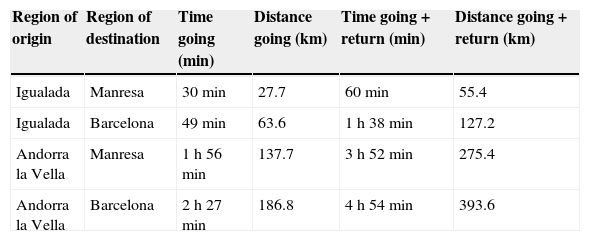
This reorganisation into a healthcare network reinforces teamwork and prevents the existence of one-person services that otherwise might exist in Igualada and Andorra. The number of patient journeys was reduced. Reducing indirect socioeconomic costs (time lost from work by patients) justifies the time spent in allergist travel (Table 5). There are studies that refer to improving the accessibility of the patient which evaluate the minimum values of distance travelled and time spent on journeys of users from their place of residence to the nearest health service based on private road transport. No studies have been found on accessibility to health centres that have allergy care nor are there studies about work conducted in allergy speciality medical care networks.11,12
Distance and time involved in travelling from Igualada and Andorra.
| Region of origin | Region of destination | Time going (min) | Distance going (km) | Time going+return (min) | Distance going+return (km) |
|---|---|---|---|---|---|
| Igualada | Manresa | 30min | 27.7 | 60min | 55.4 |
| Igualada | Barcelona | 49min | 63.6 | 1h 38min | 127.2 |
| Andorra la Vella | Manresa | 1h 56min | 137.7 | 3h 52min | 275.4 |
| Andorra la Vella | Barcelona | 2h 27min | 186.8 | 4h 54min | 393.6 |
The lack of specialists in allergology in Igualada, Andorra and CSJ would have affected 1236 first visits (40.95% of total). If we analyse the data including first visits, successive and DH, in 2010 there were a total of 3115 visits in Igualada and Andorra in which the patient did not have to travel, which represents 26.63% of total visits during this period (Fig. 1).
In recent years there have been different models for managing patients with chronic diseases such as the Chronic Care Model of Wagner, Expanded Chronic Care Model, the WHO Framework for Innovative Care of Chronic Diseases, among others. They emphasise the importance of prevention and health promotion, the need to optimise resources and formulation of health policy.13
Another model of interest is the stratification of patients according to their level based on the Kaiser Permanent pyramid (KP). The KP model identifies three levels of intervention according to the degree of complexity of the case in order to optimise human resources and organisation of care while avoiding unnecessary costs. Patients who are at the top of the pyramid represent 3–5% of cases, are the most complex and consume the highest proportion of resources.14–16
The Pla de Salut (Healthcare Plan) of the Catalan Government presented in December 2012 included protocols in allergic disease and referral criteria from primary care to specialised care consistent with the actions taken under the SP presented in this paper.17
The working model of a network of centres (hospital care, primary care, private care) applied in this project is novel in Catalan allergology and to date there was no allergy department to implement this type of care. This model, which was implemented within the Althaia Foundation in other medical specialities, could also be valid for other specialities and may be the network of choice to provide future benefits for both the patient and the healthcare system.18,19
Recently, the Department of Health of the Catalan Government through the Department of Regulation and Health Resource Planning included in its care framework a possible alternative to the current model, which is very similar to that created in our service after application of the SP.17
The reduction in the waiting list is relevant data of this study. In 2005 a pilot project was initiated in which the allergist moved to primary care so as to perform screening visits, reducing hospital referrals by 39.1%, with low absenteeism visits (3.4%) and a high rate of satisfaction among users. Avoiding patient travels and reduction in waiting time for the first visit were the aspects most valued by patients. In a study published by Negro et al. in 2004 on the degree of the failure of scheduled visits, after implementation of an improvement plan there was a 15.72% improvement.20–22 The selection of these visits was made after evaluating referrals differentiating patient groups according to severity/complexity establishing complexity groups based on the KP care model. This work has enabled the development of specific referral criteria for allergic pathologies in consensus with PC and the creation of a specific email account to improve communication between the two levels of care.23
Increasing care activity leads to an increase in costs, which is offset, among other factors, by a higher rate of resolution in the study of patients with the objective of significant reduction in the 1st/2nd visit ratio. The improvement in the 1st/2nd visit ratio (2.87 in 2005, 2.44 in 2010) can be explained primarily by the screening done in the first few visits based on stratification by complexity; in this way less complex pathologies can be controlled in PC and specialised hospital care can focus on patients with more complex or difficult to manage conditions.14,15 Time of diagnostic resolution was reduced and the complexity of the patients treated in hospitals increased.
The cost analysis per pathology shows that the drug allergy group is the group that generates more spending, so this brought up the need for a more detailed analysis, which will be the subject of another publication. One limitation of the analysis by case-mix groups is that not all patients are subjected to the same number of tests and the same patient may have several pathologies.24–27
The increase in the total number of visits implies an increase in the number of additional examinations conducted and the full costs (Tables 2–4). The department's performance analysis has highlighted the need for computerised records since the data of the tests performed by nurses in 2005 were recorded manually. For this reason analysis of the real increase in the number of tests may not be accurate. It must be kept in mind that in screening visits for the waiting list reduction plan it is the doctor himself who makes the prick test or spirometry and these tests were not recorded in the registers. At the economic level we must mention the savings of not having to provide nursing support for conducting such tests in these patients.
The reduction in the number of rhinomanometries (RMM) performed in the study period is because in 2005 the allergy department performed, in addition to its own RMMs, those requested by the otolaryngologists (ENT) from PC.
The number of determinations of specific IgE (CAP) also increased substantially due to increasing care activity. Not included in the results of this work were CAPs performed at Igualada hospital or Andorra. It must be taken into account that the total number includes those determinations requested by pulmonology, PC and paediatrics. This bias is found in the 2005 data as well as 2010 but it is assumed since the largest volume of determinations comes from the allergy department.1
In 2005 there were 5170 specific IgE determinations representing 3.4 CAPs/first visit. In 2010 there was an increase in this ratio to 4.27 from CAPs/first visit. Probably this increase in the proportion of requests per patient is due to an increase in the variety of allergens on the market (e.g. recombinant allergens), as well as greater complexity of the patients studied. In many cases it involves the existence of polysensitisations and therefore a greater number of determinations per patient.
The increase is due primarily to determinations for airborne allergens due to the incorporation of recombinant pollen allergens and increased respiratory disease prevalence. Secondly, there is an increased number of requests for food specific IgE, explained among other reasons, by plant food allergy found in many patients (cross-reactivity).28,29
Importantly, although there were more studies of allergies to drugs in 2010 than in 2005, there was a slight decrease in CAP determinations for drugs. There is probably a better selection of patients studied although this is discussed in more detail in another publication.
Diagnosis by recombinant allergens is more sensitive but less cheap than that done with the natural allergen (average price of natural allergen determination is 5.31 Euros, vs. 10.63 Euros for recombinant), so currently only the most prevalent allergens in the area study are included in the routine study.
The observed increase in the number of patients treated in day hospitals is not only quantitative but also has increased the complexity and risk of testing.
In 2005, the waiting list for a challenge test in children DH was longer than 10 months. After application of the SP the waiting list is down to four months. Of the 873 DH sessions in 2005, 214 correspond to challenge tests in adults (24.5%) and 133 in children (15.23%). In 2010, a total of 924 DH sessions were performed (of which 227 adults (24.5%) and 225 in children (24.35%)).
The number of treatments with allergen-specific immunotherapy to aeroallergens increased by 19.99% (2005: 2173 standard+48 clusters; 2010: 2563 standard+102 clusters). The largest increase was in the number of administrations in cluster pattern (+112.5%), which must always be performed in DH or in an immunotherapy unit. Administration in cluster or rush patterns leads directly to a reduction in the total number of doses administered to the patient, reducing the number of reactions and the number of visits by the patient, with the consequent savings that this represents at all levels.30,31
With these changes the allergy department currently has a greater number of patients with highly complex diseases (severe asthma, multiple food allergy, etc.) that require a greater number of studies and more complex treatment.
Other improvements after application of SP were: monoclonal drug therapy, desensitisation, exhaled nitric oxide levels and modelling of comprehensive specific informed consent in the computerised medical record.
After analysing the results following application of the SP the model of allergy care used so far would have to be reconsidered and opt for a new organisational model based on risk stratification of patients and on the system of networking between centres and levels of care.
ConclusionsApplying a SP in the allergology department has allowed to:
- 1.
Create a healthcare network in allergy, a new care model in Catalonia, matching available resources to the growing demand, rationalising expenditure and improving the quality of care.
- 2.
Improve the quality of care, increase the diversity of services and expand the territory for which the service is provided (strategic alliances).
- 3.
Implement specific referral criteria for each pathology as agreed upon with PC, reducing waiting lists and avoiding unnecessary studies. Another work will deal with specific analysis of diagnostic yield of drug allergy studies.
- 4.
Adjust the pathology treated in hospital to what is really necessary due to its complexity and improve the diagnostic resolution time.
- 5.
Obtain an increase in absolute costs secondary to increased activity is justified by the expansion of the territory, the number of patients seen, the improvement in diagnostic resolution and reducing indirect socioeconomic costs. So even though overall spending increases, spending per patient successfully treated is reduced.
The authors declare that no experiments were performed on human or animals for this investigation.
Patient's data protectionThe authors declare that no patient data appear in this article.
Right to privacy and informed consentThe authors declare that no patient data appear in this article.
Conflict of interestThere is no conflict of interest with regard to the article.
To the tireless promoter of this project, Dr Santi Nevot, without whom this work would not have been possible.
