


Respiratory allergy is characterised by an IgE-mediated reaction. The immune system functions, including IgE production, progressively decline over time with growing up and ageing. Molecular-based allergy diagnostic defines sensitisation profile. This study aimed to evaluate the impact of age on serum allergen-specific IgE to molecular component levels in a large sample of subjects.
MethodsSerum IgE to: rCor a11, rPru p3, nJug r3, rAra h8, rGly m4, rCor a8, nPen m1, nAct d8, Bos d 8, and nGal d2 were assessed by ISAC method. Sera from 2795 patients, 1234 males (44.1%) and 1561 females (55.9%), median age 23 years (1st and 3rd quartiles: 9.7–43.7 years; age range: 1 month-103 years) were analysed.
ResultsThe number of positive tests (i.e. sensitisation) tended to increase between birth and school-age until young adulthood and then decreased. A similar age-dependent trend was observed considering the levels of each allergen components: the levels of each allergen component tended to increase until early adulthood, but Gal d 2 and Bos d 8 (rapidly diminishing), and then to decrease over time. However, the pattern is significantly dependent on each single tested food.
ConclusionsAllergen-specific IgE production to food molecular components tend to reduce with ageing, but with differences between allergens. This phenomenon should be adequately evaluated managing allergic patients.
Allergic disorders are very common, so much so that the term “Allergy Epidemics” has been coined to underline the striking prevalence: up to 40% of general population.1 Sensitisation, such as the ongoing production of allergen-specific IgE, is the hallmark of allergic reaction, in fact it may be considered the condicio sine qua non for detecting allergy. Sensitisation can be documented in vivo (by skin prick test) or in vitro (by serum IgE measurement). Traditionally, natural allergen extracts from allergenic sources are used in common practice. However, the extract mixtures are usually heterogeneous because they may include not only the major allergens, but also cross-reactive allergens, non-allergenic antigens, and interfering substances.2 To remedy this potential bias, molecular-based allergy diagnostic tests have been recently introduced in the clinical practice, allowing to define and characterise the sensitisation profile exactly.3 This methodology is based on allergen molecular components that are involved in the specific immune response to allergens. Allergen molecules may be natural, recombinant, or synthetic. The use of molecular allergen components has changed the allergy workup, being highly useful in poly-sensitised patients prescribing allergen-specific immunotherapy.4 In fact, the positivity to major allergens excludes false reactivity to pan-allergens. In addition, molecular diagnostics may be useful for predicting a risk for food anaphylaxis, identifying molecular pattern and considering serum level.5
On the other hand, the natural history of allergy is ever-changing and a progressive decline of immune response occurs over time.6 There is shared opinion that allergy prevalence usually tends to increase from infancy to young adulthood and then to decline with ageing. Actually, these stages may be outlined with the concept of “allergy march”.7 Allergic disorders tend to start from atopic dermatitis in infants and progressively may proceed to food allergy, allergic rhinitis, and asthma. Likewise, specific sensitisations characterised the different steps of the allergy march: the first are milk and egg allergy, then changing the diet other food allergies appear.8 Also, molecular diagnostics may be useful to establish patterns for specific molecular components.9 Food allergy has another peculiarity: offending foods may significantly vary depending on location, considering typical foods, dietetic habit, cooking, and poly-allergy linked to pollen allergy.10 So, it is clinically relevant to know the molecular pattern and prevalence of food allergens in a defined area, also considering the impact of age. Very few studies regarding this issue have been conducted in Italy. The first study was performed in Rome and the second in Genoa, but both studies used the old multiplex microarray platform.11,12 Therefore, the present study tested the hypothesis that age could impact on allergen-specific IgE production to the food molecular components. So we evaluated a large cohort of patients, referred to a third level paediatric hospital, hub for IgE assay for the city, measuring serum IgE by the new multiplex microarray.
Materials and methodsPatientsThis retrospective cross-sectional study considered subjects who went to the Laboratory of the IRCCS-Istituto Giannina Gaslini of Genoa, Italy for serologic assessment in order to confirm food allergy between July 2012 and April 2014. We analysed the findings of serum allergen-specific IgE assessed by the ISAC method. We considered the most frequent sensitisation in our sample, such as Cor a11, Pru p3, Jug r3, Ara h8, Gly m4, Cor a8, Pen m1, Act d8, Gal d2, and Bos d8.
The Review Board of the Istituto Giannina Gaslini approved the procedure. The patients gave a written informed consent.
IgE assaySerum IgE were measured by ImmunoCAP solid-phase allergen chip (ISAC) test according to the manufacturer's recommendations (Thermo-Fisher Italy, Milan, Italy) and as previously reported.13 Synthetically, 20μL of the patient's serum was incubated on the microchip containing 112 allergen spots. After 1-h incubation, slides were washed and a monoclonal anti-IgE antiserum labelled with a fluorochrome was added and incubated for 1h. Then, slides were re-washed and the chips were analysed by a Laser Scan Confocal microarray reader (LuxScan 10K/A, CapitalBio, Beijing, China). Analysis of the results was automatically evaluated using a Microarray Image Analyser. All samples were identified using a single barcode, and the results were calculated by the software without any intervention of the technicians. All slides were visually scored to detect the presence of defects (e.g. smears of fluorescence or drops interfering with the reading). Only in these cases, a manual correction (or a refusal of the result) was decided. The ISAC score was reported as ISAC Standardised Units (ISU), which range from 0 to 100. Data were obtained by specific software. Calibration and quality control of the assays were performed as previously defined.13
IgE to rCor a11, rPru p3, nJug r3, rAra h8, rGly m4, rCor a8, nPen m1, nAct d8 and nGal d2 were assessed.
Data and statistical analysisPatients were grouped according to their age as follows: Group 1: from birth to the end of the 1st year (early infancy); Group 2: from the beginning of the 2nd year to the end of the 5th year (preschool age); Group 3: from the beginning of the 6th year to the end of the 12th year (school age); Group 4: from the beginning of the 13th year (first adolescence and secondary school) to the end of the 17th year (end of adolescence); Group 5: 18–20 years; Group 6: 21–30 years; Group 7: 31–40 years; Group 8: 41–50 years; Group 9: 51–60 years; Group 10: 61–70 years; Group 11: 71 years and older.
The percentage of positive tests (i.e. components recognised by specific IgE) in each age group was evaluated for each allergen component.
IgE levels were summarised as means and standard deviations. Comparisons of IgE levels among different age groups were performed using ANOVA test. Categorical variables were compared using the Chi-square test or the Fisher's Exact test in case of expected frequencies less than five. A p value less than 0.05 was considered as statistically significant.
Statistical analysis was performed using the Statistica software package (release 9.0, StatSoft Corp., Tulsa, OK, USA).
ResultsWe analysed sera from 2795 patients, 1234 males (44.1%) and 1561 females (55.9%), median age 23 years (1st and 3rd quartiles: 9.7–43.7 years).
Most subjects were positive to rCor a11 (27.1%). Frequency of positivity to rPru p3, nJug r3, rAra h8 and rGly m4 was between 12% and 10% whereas positivity to other allergen components, i.e. rCor a8, nPen m1 nAct d8 and nGal d2, was below 10% (Fig. 1).

Positivity to rCor a11, rAra h8 and rGly m4 (Fig. 2A, D, and E) is very uncommon in early infancy being 1% for rCor a11 and absent for the other two allergen component; then, frequency of positivity tended to increase reaching peak values in early adulthood (18 to <21 yrs of age) being 38.7% (rCor a11), 21.8% (rAra h8) and 25.2% (rGly m4). Starting from 21 years old, the frequency of positivity tended to decrease, remaining almost stable for the rest of life.
, Pru p3 (panel B), Jug r3 (panel C), Ara h8 (panel D), Gly m4 (panel E), Cor a8 (panel F), Pen m1 (panel G), Act d8 (panel H), Gal d2 (panel I), and Bos d8 (panel J). Patients were grouped according to their age as follows: early infancy (<2 years), preschool age (2 to <6 years), school age (6 to <13 years), adolescence (13 to <18 years), 18–20 years, 21–30 years, 31–40 years, 41–50 years, 51–60 years, 61–70 years, 71 years and older.")
Frequency of positive test for specific IgE for each allergen component according to the age of the patients: Cor a11 (panel A), Pru p3 (panel B), Jug r3 (panel C), Ara h8 (panel D), Gly m4 (panel E), Cor a8 (panel F), Pen m1 (panel G), Act d8 (panel H), Gal d2 (panel I), and Bos d8 (panel J). Patients were grouped according to their age as follows: early infancy (<2 years), preschool age (2 to <6 years), school age (6 to <13 years), adolescence (13 to <18 years), 18–20 years, 21–30 years, 31–40 years, 41–50 years, 51–60 years, 61–70 years, 71 years and older.
For rPru p3, nJug r3, rCor a8 and nPen m1 (Figure 2B, C, F and G) the peak was reached in younger age: at preschool-age for nPen m1 (6.9%), at school age for rPru p3 (16%) and rCor a8 (8.8%) and in adolescence for nJug r3 (14.4%). In early infancy, over 10% of children were positive to rPru p3 whereas, in the same age group, the positivity to other allergen components was detected only in 5.1% for rCor a8, 4.1% for nJug r3 and 1% for nPen m1.
Positivity to nAct d8 (Fig. 2H) became detectable in preschool age and reached two peaks: the first at school-age (4.9%) and the second in middle age (41 to <51 years of age) (4.7%).
Positivity to nGal d2 and to nBos d8 (Fig. 2I and J) showed a similar trend: the highest frequency of positivity was observed in early infancy (15.5% and 14.3%, respectively) and decreased with age, being lower than 1% or undetectable by early adulthood.
The subjects with positive test to each allergen components were analysed separately and the age-dependent distribution of the IgE levels for each allergen component was evaluated.
We found that the IgE levels for rCor a11 (Fig. 3A), nJug r3 (Fig. 3C), rCor a8 (Fig. 3F) and nPen m1 (Fig. 3G) increased from birth to school age, adolescence or early adulthood and then tended to decrease, remaining stable for the rest of life.
, Pru p3 (panel B), Jug r3 (panel C), Ara h8 (panel D), Gly m4 (panel E), Cor a8 (panel F), Pen m1 (panel G), Act d8 (panel H), Gal d2 (panel I), and Bos d8 (panel J). Levels are expressed as ISU-E. Patients were grouped according to their age as follows: early infancy (<2 years), preschool age (2 to <6 years), school age (6 to <13 years), adolescence (13 to <18 years), 18–20 years, 21–30 years, 31–40 years, 41–50 years, 51–60 years, 61–70 years, 71 years and older.")
Levels of each allergen component according to the age of the patients: Cor a11 (panel A), Pru p3 (panel B), Jug r3 (panel C), Ara h8 (panel D), Gly m4 (panel E), Cor a8 (panel F), Pen m1 (panel G), Act d8 (panel H), Gal d2 (panel I), and Bos d8 (panel J). Levels are expressed as ISU-E. Patients were grouped according to their age as follows: early infancy (<2 years), preschool age (2 to <6 years), school age (6 to <13 years), adolescence (13 to <18 years), 18–20 years, 21–30 years, 31–40 years, 41–50 years, 51–60 years, 61–70 years, 71 years and older.
IgE levels for rPru p3 (Fig. 3B) and nAct d8 (Fig. 3H) were almost stable in each age group even though IgE for nAct d8 (Fig. 3H) were undetectable in early infancy. Similarly, IgE levels for rAra h8 (Fig. 3D) and rGly m4 (Fig. 3E) were detectable by preschool age and then tended to decrease.
IgE levels for nGal d2 (Fig. 3I) and nBos d8 (Fig. 3J) increased from birth to adolescence and then decreased till disappearance after early adulthood.
DiscussionThe actual diagnosis of allergy is based on positive specific IgE test results. Allergen-specific IgE immunoassay is a reliable, standardised analytical method offering a better accuracy than skin prick test in recognising allergic patients.14 Serum IgE is commonly considered the typical biomarker for the allergic phenotype, as allergic disorders are paradigmatically characterised by an IgE-mediated inflammation. IgE measuring is therefore a popular way to diagnose allergy.
In addition, the allergen molecular test allows a more accurate diagnosis, focused on the recognition of the true causative allergen; this property leads to a significant increase of test specificity because of the exclusion of false sensitisation due to cross-reactivity. However, in vitro molecular allergy tests are expensive, cannot be performed by any clinical laboratory, and their interpretation requires adequate specialist competence. Despite molecular allergy tests opening encouraging perspectives for the improvement of patient care, results should be evaluated with caution, taking into account the presence and the severity of clinical signs, since sensitisation does not necessarily correspond to true allergy.
On the basis of these assumptions, the present study aimed to investigate the age impact on the allergen-specific IgE production to the most common (in our area) food molecular components, assessed by molecular component analysis.
The present study was conducted on a large sample of subjects referring to serologic assessment for confirming food allergy. The findings confirm the high prevalence of sensitisation to Cor a 1, belonging to PR10 family. This outcome is consistent with the relevance of Bet v 1 sensitisation, which is very high in our area, and is associated with low Bet v2 and Bet v 4 positivity.15 Moreover, Pru p 3 and Jug r 3, markers of LTP sensitisation, are frequent in our sample. The relevance of this result is based on the potential dangerousness of LTP allergy and the possible link with respiratory allergy.16,17 On the other hand, Gal d 2 (ovalbumin) and Bos d 8 (casein) sensitisation are rare in the global population. These findings comply with the pattern of IgE levels over time. In fact, the IgE production pattern depends on two main factor: type of sensitisation and age of the allergic patient.18,19 In fact, both egg and cow milk allergy are very frequent in early childhood, but frequently disappear over time. On the other hand, other food allergies have an onset in late childhood-young adulthood, e.g. peanut allergy, but tend to remain also during adulthood. It is noteworthy that Pen m (tropomyosin) 1 sensitisation and IgE levels tend to diminish over time: this phenomenon is consistent with the pattern of mite allergy, frequent in children and rare in old adults.20,21
Moreover, the present results confirm a recent study conducted on children who experience anaphylaxis, and underline the relevance of local studies about this topic.10 In fact, important variations may be observed between just close geographical areas.
This study had some limitations: it was retrospectively conducted on a selected patient population sample, there was no follow-up, and symptoms were not considered. In addition, this study did not consider possible confounding factors, such as smoking status, parasite infestation, environmental exposures, seasonal variations, and number of sensitising allergens. Therefore, there is a need to conduct cohort studies and long-term follow up trials to confirm these preliminary findings.
In conclusion, allergen-specific IgE production to food molecular components trend to reduce with ageing, but with important differences between allergens. This phenomenon should be adequately evaluated managing allergic patients (Table 1).
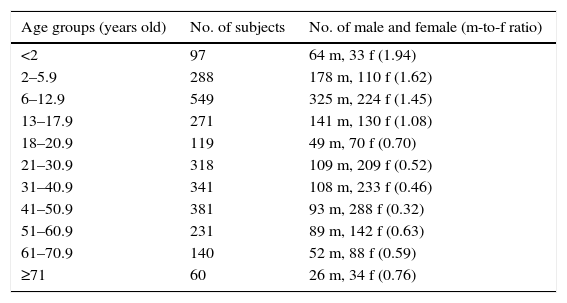
Demographic characteristics of the studied population.
| Age groups (years old) | No. of subjects | No. of male and female (m-to-f ratio) |
|---|---|---|
| <2 | 97 | 64 m, 33 f (1.94) |
| 2–5.9 | 288 | 178 m, 110 f (1.62) |
| 6–12.9 | 549 | 325 m, 224 f (1.45) |
| 13–17.9 | 271 | 141 m, 130 f (1.08) |
| 18–20.9 | 119 | 49 m, 70 f (0.70) |
| 21–30.9 | 318 | 109 m, 209 f (0.52) |
| 31–40.9 | 341 | 108 m, 233 f (0.46) |
| 41–50.9 | 381 | 93 m, 288 f (0.32) |
| 51–60.9 | 231 | 89 m, 142 f (0.63) |
| 61–70.9 | 140 | 52 m, 88 f (0.59) |
| ≥71 | 60 | 26 m, 34 f (0.76) |
No.: number; m: male; f: female.
The authors declare that they have followed the protocols of their work centre on the publication of patient data and that all the patients included in the study have received sufficient information and have given their informed consent in writing to participate in that study.
Right to privacy and informed consentThe authors have obtained the informed consent of the patients and/or subjects mentioned in the article. The author for correspondence is in possession of this document.
Protection of human subjects and animals in researchThe authors declare that the procedures followed were in accordance with the regulations of the responsible Clinical Research Ethics Committee and in accordance with those of the World Medical Association and the Helsinki Declaration.
Conflict of interestThe authors have no conflict of interest to declare.
We wish to thank Giorgio Parodi and Roberto Bologna (Laboratory of Analysis, Istituto Giannina Gaslini) for their skilful cooperation regarding laboratory data elaboration.
