


Active anterior rhinomanometry with a face mask was used to establish the lower age limit for application of the technique, define normality reference standards, and determine the most appropriate pressure for referencing the nasal resistance values.
Material and methodsA total of 409 children of both sexes and aged 5-14 years were studied. The subjects were selected from among healthy children in two primary care centres and one school. The Rhinospir 164 rhinomanometer was used for the tests. Rhinomanometry was performed according to the guidelines of the International Committee on Standardization of Rhinomanometry. The SPSS (Statistical Package for the Social Sciences) was used for the analysis of the results.
ResultsThe study sample was divided into five age groups involving intervals of two years from 5 to 14 years of age, and four body surface groups. The dependent variables studied (resistances and flows at pressure differences of 75 and 100) showed significantly different mean values according to age and body surface. All the mean ratios were over 1.4 units, i.e., the measures of each variable on one side and the other differed between 40% and 44%.
Conclusions1.- The lower age limit for rhinomanometry is five years. 2.- The most appropriate pressures for referencing the resistance and flow values are 75 and 100. 3.- The reference standards are established with respect to total resistance and according to subject age and body surface.
In routine clinical practice it is very complicated to quantify the subjective sensation caused by nasal obstruction. In order to establish a quantitative measure, the determination of nasal air flow resistance can be taken to reflect nasal obstruction. On the other hand, the perception of nasal obstruction varies considerably, and it has not been possible to establish a direct correlation to real nasal air flow resistance.1 Rhinomanometers have been designed and used in this context.
Rhinomanometry measures the difference in transnasal pressure of the air flow through the nasal cavity. In order to physiologically determine nasal air flow resistance, it is necessary to simultaneously measure the pressure gradient and air flow through the nose. The resistance is obtained from these measures by simply dividing pressure gradient by air flow.2
Nasal respiratory function can be measured in an active and dynamic manner while the patient is breathing, or in a passive or static manner by applying a flow at a given pressure through the nasal passages while the patient is in apnoea. The relationships between nasal pressure and flow presently can be measured by anterior, posterior and forced oscillation rhinomanometry. Anterior rhinomanometry may be active or passive, while posterior rhinomanometry is active.
In active anterior rhinomanometry, the air flow and pressure gradients are measured through the right and left nostril during a normal respiratory cycle.
In a consensus document, the International Committee on Standardization of Rhinomanometry established that the most physiological rhinomanometrical technique is active anterior rhinomanometry,3–5 defining this as the method of choice for measuring nasal ventilation.
The main advantages of active anterior rhinomanometry are that it is easy and relatively rapid to perform, requires scant patient cooperation, and is well tolerated.
Rhinomanometry is not routinely used in normal clinical practice in children for the study of rhinitis, mainly because of the variability of the technique, the lack of normality reference values, and the time required to perform the technique. Nevertheless, it is very useful for observing the seasonal variability in symptoms and their allergenic correlations,6 and for studying the presence of nasal hyperresponsiveness.7–9 On the other hand, it is an objective tool for evaluating different intranasal treatments,10,11 and for the follow-up of nasal provocation testing with allergic response mediators,12,13 allergens14 and other substances (methacholine, histamine).15,16 In addition, the measurement of unilateral nasal resistance allows the study of anatomical obstructions and offers objective data on the efficacy of corrective surgery.
Two Japanese studies predating our own work suggested a decrease in nasal resistance in groups of schoolchildren and students in relation to age,17,18 and only one study in Caucasians has reported nasal airflow values at a pressure of 150Pa based on active anterior rhinometry in a large group of healthy children and adolescents. In this case the regression equations were calculated in relation to subject height and age.
Since not all children are able to reach a pressure of 150Pa, further studies are needed to reference nasal airflow values to other lesser pressures. For these reasons we have measured the nasal airflow and nasal airflow resistance values at a pressure of 75 and 100Pa during inspiration by active anterior rhinometry in a large group of healthy children. From the data obtained, we calculated the regression equations at pressures and resistances of 75 and 100Pa pressure difference (TEF-75, TEF-100, TER-75 and TER-100) according to body surface and age.
The present study employs active anterior rhinomanometry using a face mask, with the following objectives:
- 1.
To establish the lower age limit for application of the rhinomanometry technique.
- 2.
To establish a normality reference standard.
- 3.
To assess the most appropriate pressure for referencing the nasal resistance values.
- 4.
To study total resistance and the relationship between both nasal fossae.
We studied a total of 409 children, 220 girls (53.8%) and 189 boys (46.2%), aged between 5 and 14 years.
The subjects were selected from among healthy children in two primary care centres (Centro de Salud Fuensanta in Valencia, and Centro de Salud Paterna) and in one school of the province of Valencia, Spain (Colegio Público Sagrado Corazón, in Alginet).
Voluntary collaboration was requested from the parents, after explaining the characteristics of the study and its non-invasive nature.
MethodInstrumentsThe study was carried out using the Rhinospir 164 computerised rhinomanometer with a face mask.
For sealing of the nostril we used nasal adhesive adaptable to any nasal anatomy, and perforated in the centre to allow communication between the interior of the nasal fossa and the rhinomanometer.15
Study inclusion criteriaThe children were considered healthy on the basis of the findings of a personalised interview and the results of external nasal examination and anterior rhinoscopy, performed in all subjects before rhinomanometry.
We documented the personal data of each child, the personal and family history (fundamentally referred to the respiratory system), surgical operations in the zone, and the existence of good nasal breathing as evaluated by the children and their parents.
Nasal examination in turn comprised evaluation of the morphology and competence of the nasal pyramid, the nasolabial angles and the muscle components in the zone. Palpation was used to assess anatomical irregularities of the pyramid, crests and rigidities, while a nasal speculum was used to evaluate mucosal colour and the morphology of the nasal septum.
The children were considered to be healthy in the presence of normal exploration findings and a questionnaire without evidence of objective or subjective nasal problems.
Rhinomanometric explorationRhinomanometry was performed following the guidelines of the International Committee on Standardization of Rhinomanometry.3
All tests were made between 16:00 p.m. and the 20:00 p.m.
Since physical exercise is known to exert a vasoconstrictive effect,16 the children were kept at rest in the sitting position for approximately 15minutes before starting the test.3,4
All subjects underwent active anterior rhinomanometry with the face mask under baseline conditions. Those who volunteered to participate in turn underwent a second test a few minutes after the first.
Statistical analysisThe SPSS (Statistical Package for the Social Sciences) was used to analyse the data obtained.
The Kolmogorov-Smirnov test was used to determine whether the rhinomanometric variables presented a normal distribution.
Analysis of variance (ANOVA) was used to examine the influence of biological parameters upon each of the rhinomanometric variables. One-way ANOVA was used to independently study the effect of each of the variables, while two-way ANOVA was used to explore the influence of two combined variables.
Linear regression models were developed to relate and explain the rhinomanometric variables as a function of the biological variables found to be significant. Linear relationships were expressed by the Pearson correlation coefficient.
Likewise, the corresponding confidence intervals were determined, along with the common percentiles, based on the standard error of the estimations.
The Student t-test was used to assess the homogeneity – heterogeneity of the two baseline determinations (intraindividual variability or reproducibility of the data based on immediate test repetition).
The accepted level of significance for all the statistical tests was 95% (p=0.05).
Study variablesIndependent- 1.
Sex
The children were divided into two groups according to sex: group 1 (boys) and group 2 (girls).
- 2.
Age
One-way ANOVA showed no differences between distributing patient age on a year-by-year basis or in two-year intervals. Therefore, in order to facilitate the statistical analysis, the children were divided into the following groups by age: group 1 (5 and 6 years of age); group 2 (7 and 8 years); group 3 (9 and 10 years); group 4 (11 and 12 years); and group 5 (13 and 14 years).
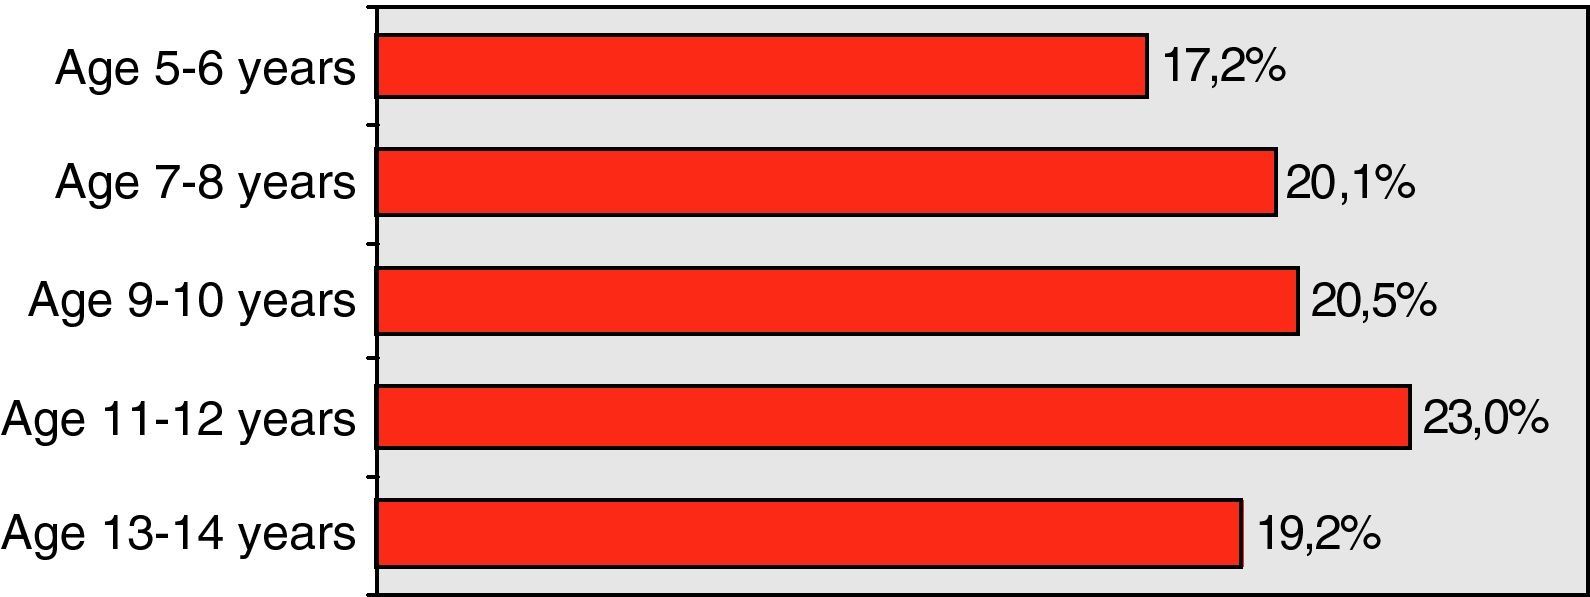
There were 41 children (17.15%) aged 5 or 6 years; 48 (20.08%) aged 7 or 8 years; 49 (20.5%) aged 9 or 10 years; 55 (23.01%) aged 11 or 12 years; and 46 children (19.24%) aged 13 or 14 years (Table 1).
- 3.
Height
Body height was distributed as follows: group 1 (100.00 - 120.00cm); group 2 (120.01 - 130.00cm); group 3 (130.01 - 140.00cm); group 4 (140.01 - 150.00cm); group 5 (150.01 - 160.00cm); and group 6 (160.01 - 180.00cm).
- 4.
Weight
Body weight was distributed as follows: group 1 (17.00 – 25.00kg); group 2 (25.01 – 32.00kg); group 3 (32.01 – 38.00kg); group 4 (38.01 – 45.00kg); group 5 (45.01 – 54.00kg); and group 6 (over 54kg).
- 5.
Body surface
Body surface was distributed as follows: group 1 (0.70 - 1.00 m2); group 2 (1.01 - 1.20. m2), group 3 (1.21 - 1.40 m2), and group 4 (over 1.40 m2).

The different groups corresponding to each of the variables (age, weight, height, and body surface) were established from the mean obtained for each of the independent variables with the corresponding standard deviation (SD), and taking into account the maximum and minimum values.
Dependent- 1.
Total flow in the expiratory phase at a pressure difference of 75 and 100 (TEF-75 and TEF-100).
- 2.
Total resistance in the expiratory phase at a pressure difference of 75 and 100 (TER-75 and TER-100).
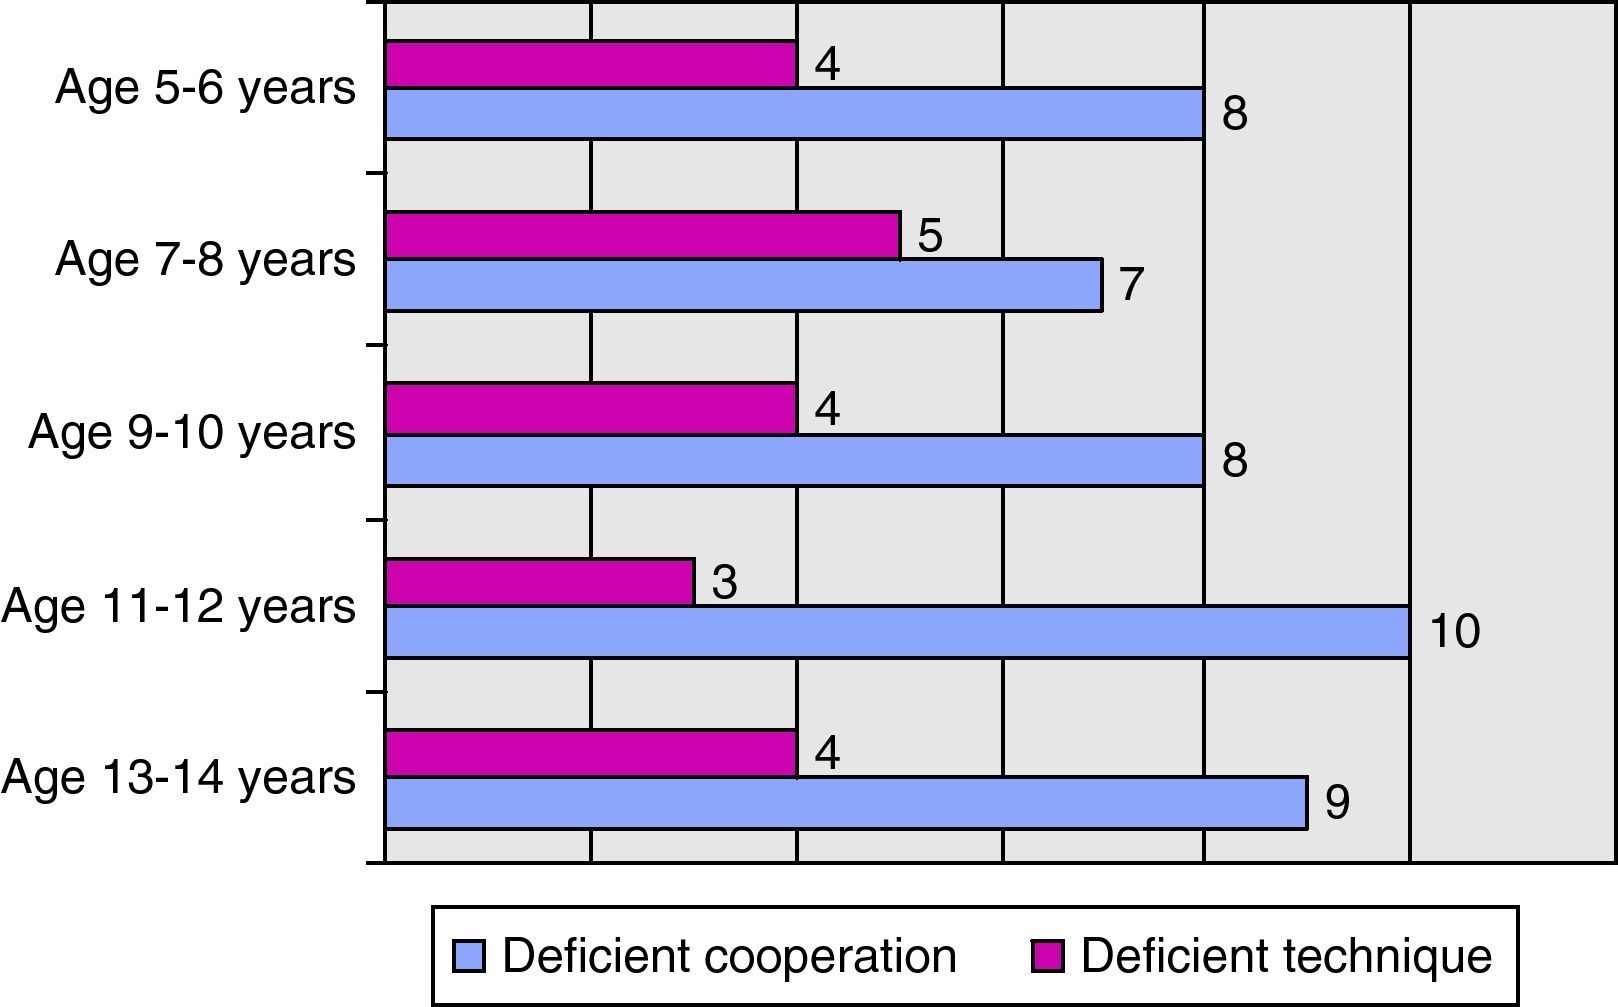
Of the total initial sample (409 children), we excluded 41 children due to deficient cooperation, 95 due to alterations in the exploration and/or questionnaire suggesting possible nasal pathology, 20 due to deficient technique, and 14 due to other reasons (incomplete registry or registry problems). The final study sample therefore consisted of 239 children: 132 girls (55.23%) and 107 boys (44.77%), with an age range of 5 - 14 years.
Table 2 shows the number of children excluded from the study due to deficient cooperation or deficient technique, by age groups.

One-way ANOVA was performed for each of the independent variables (sex, age, weight, height, and body surface) to determine their influence upon the dependent variables: total flow and resistance in the expiratory phase at a pressure difference of 75 and 100 (TEF-75, TEF-100, TER-75 and TER-100).
The dependent variables (TEF-75, TEF-100, TER-75 and TER-100) differed significantly according to age, height, weight, and body surface.17,18 However, no differences were detected with respect to sex in any of the four dependent variables analysed. Both boys and girls showed the same mean total flows and resistances.
Since body surface is directly calculated from body height and weight, inclusion of the pair weight – height is seen to be non-significant when body surface is already previously included. For this reason we performed two-way ANOVA to determine the influence of age and body surface as independent variables upon flow and resistance.
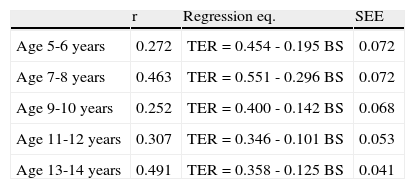
A simple linear regression model was established to explain the behaviour of TER-75 and TER-100 according to body surface and in the different age groups. The regression equations obtained are shown in Table 3, together with Pearson correlation coefficient (r) and standard error of the estimation (SEE). From the equations it is deduced that the greater the body surface, the lower TER for any age group.
Analysis of resistance at pressure difference 75 (TER-75).
| r | Regression eq. | SEE | |
| Age 5-6 years | 0.272 | TER=0.454 - 0.195 BS | 0.072 |
| Age 7-8 years | 0.463 | TER=0.551 - 0.296 BS | 0.072 |
| Age 9-10 years | 0.252 | TER=0.400 - 0.142 BS | 0.068 |
| Age 11-12 years | 0.307 | TER=0.346 - 0.101 BS | 0.053 |
| Age 13-14 years | 0.491 | TER=0.358 - 0.125 BS | 0.041 |
Analysis of resistance at pressure difference 100 (TER-100).
| r | Regression eq. | SEE | |
| Age 5-6 years | 0.275 | TER=0.481 - 0.199 BS | 0.073 |
| Age 7-8 years | 0.463 | TER=0.577 - 0.299 BS | 0.074 |
| Age 9-10 years | 0.253 | TER=0.410 - 0.142 BS | 0.068 |
| Age 11-12 years | 0.357 | TER=0.378 - 0.110 BS | 0.049 |
| Age 13-14 years | 0.529 | TER=0.396 - 0.133 BS | 0.040 |
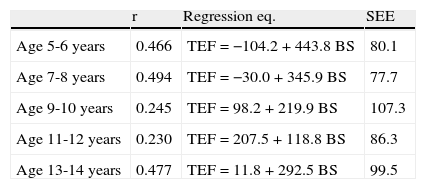
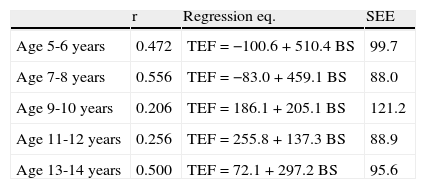
ANOVA of the TEF-75 and TEF-100 revealed the presence of interaction between the implicated factors. This means that in relation to a general behavioural pattern it is not possible to draw conclusions on the influence of age and/or body surface upon TEF-75 and TEF-100. In a concrete age group, body surface may influence flow in one way, while in another age group it may exert the opposite influence. This disparity in the behaviour of flow according to the age group involved explains the detected interaction. The regression equations obtained are shown in Table 4, for both TEF-75 and TEF-100.
Analysis of flow at pressure difference 75 (TEF-75).
| r | Regression eq. | SEE | |
| Age 5-6 years | 0.466 | TEF=−104.2+443.8 BS | 80.1 |
| Age 7-8 years | 0.494 | TEF=−30.0+345.9 BS | 77.7 |
| Age 9-10 years | 0.245 | TEF=98.2+219.9 BS | 107.3 |
| Age 11-12 years | 0.230 | TEF=207.5+118.8 BS | 86.3 |
| Age 13-14 years | 0.477 | TEF=11.8+292.5 BS | 99.5 |
Analysis of flow at pressure difference 100 (TEF-100).
| r | Regression eq. | SEE | |
| Age 5-6 years | 0.472 | TEF=−100.6+510.4 BS | 99.7 |
| Age 7-8 years | 0.556 | TEF=−83.0+459.1 BS | 88.0 |
| Age 9-10 years | 0.206 | TEF=186.1+205.1 BS | 121.2 |
| Age 11-12 years | 0.256 | TEF=255.8+137.3 BS | 88.9 |
| Age 13-14 years | 0.500 | TEF=72.1+297.2 BS | 95.6 |
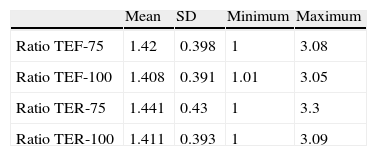
Based on the measurements of flow and resistance in both nasal passages, a degree of concordance is obtained between one measure and the other. We calculated the ratio between the highest measurement and the lowest, for TEF-75, TEF-100, TER-75 and TER-100. Table 5 summarises the descriptive statistics obtained.
All the mean ratios were over 1.4 units, i.e., the measures of each variable on one side and the other differed between 40% and 44%.
DiscussionActive anterior rhinomanometry is widely used in clinical practice and in research. While posterior rhinomanometry requires a degree of patient cooperation and training,17,19 we have found active anterior rhinomanometry to be well accepted and tolerated by children from as early as five years of age. Only 41 children (10% of our total series) were excluded due to deficient cooperation. In addition, we have been able to demonstrate that deficient cooperation in performing rhinomanometry was similar in the different age groups studied, as can be seen in Table 2.
Some authors19 have carried out these measurements in preschool children as small as two years of age, since these measurements – in contrast to pulmonary function tests – do not require too much cooperation. However, the success of the tests were substantially dependent upon patient psychomotor maturity, which is clearly more limited in smaller children. Since maturation at age five years is sufficient for testing, and in view of the good results obtained in our study in children of this age, we postulated five years as the limiting age for correct testing – without ruling out the inclusion of smaller and more alert children, provided sufficient patience is shown on the part of the investigator.
In coincidence with the criteria of the International Committee on Standardization of Rhinomanometry,3,4,20 we expressed the results in values of resistance at a given pressure instead of at a given flow.
The pressures approved for the study of nasal resistance and flow are 75, 100 and 150Pa – the value of 300Pa being reserved for the study of nasal alar collapse.3 Studies in adults20,21 have shown that 100% of all normal subjects reach a pressure of 100Pa in the course of calm breathing. We in turn have found that 96% of the children studied were able to reach 100Pa; as a result, we consider the most appropriate pressures for referencing the nasal resistance and flow values to be 75 and 100Pa.
As regards evaluation of the variables capable of influencing nasal resistance, we were able to confirm the already known correlation to age,22,23 characterised by a decrease in resistance with advancing age. In relation to the influence of patient sex, the literature (always in reference to adult subjects) offers conflicting results – some authors reporting gender-based differences,23-25 while others observe no differences.22,26 In our series we recorded no significant differences suggesting an influence on the part of patient sex. As regards body height and weight, the results found in the literature likewise fail to show agreement.27 However, in our series both of these parameters did exert an influence upon nasal resistance, in the same way as a third parameter (body surface), which combines both height and weight.
It has been reported that total nasal resistance values are much more reproducible than the values obtained for each nasal passage separately,27 since the nasal cycle does not exert as great an influence in the former case. We therefore decided to record total nasal resistance.22
Based on the results obtained, the following conclusion can be drawn:
- -
The lower age limit for active anterior rhinomanometry with the highest probability of success is five years of age.
- -
The appropriate pressures for referencing the resistance and flow values are 75 and 100Pa.
- -
The reference standards are established with respect to total resistance and as a function of age and body surface.
The authors have no conflict of interest to declare.
