


To quantify the effect of statins’ use on Prostate Specific Antigen (PSA) levels in patients referred to prostate biopsy and to determinate if the exposure to statins must be considered to improve the prostate cancer diagnostic accuracy of PSA.
MethodsWe selected 551 subjects with PSA <10.0ng/mL, referred to ultrasound guided trans-rectal prostate biopsy and classified as cancer or non-cancer patients after biopsy. Information regarding statins’ use was obtained from clinical records. We used path analysis to quantify the direct (reflects the influence on PSA biology and metabolism) indirect (reflects the influence on PSA through the effect on the risk of prostate cancer) and total effects (net result of direct and indirect effects) of statins’ use on PSA. We used Receiver Operating Characteristic curves to assess the global predictive accuracy of models including PSA, age, body mass index, 5-α-reductase inhibitors, aspirin and statins’ use for distinguishing between prostate cancer and benign conditions.
ResultsWe observed a negative total effect of statins on PSA levels (users vs. non-users: −0.633ng/mL; 95% CI: −1.087; −0.179), which corresponds to approximately 8.9% lower levels among statins’ users, mostly due to the direct effect (−0.588ng/mL; 95% CI: −1.034, −0.141) rather than that by the indirect effect (−0.045ng/mL; 95% CI: −0.152, 0.061). There were no statistically significant differences between the area under the curve corresponding to the models with or without statins (P=0.274).
ConclusionIn patients referred to prostate biopsy, statins’ use contributed to lower Prostate Specific Antigen levels, but the clinical impact in these patients is low.
Quantificar o efeito do uso de estatinas nos níveis do antigénio específico da próstata (PSA) em doentes submetidos a biópsia prostática. Determinar se o uso de a estatinas deve ser considerado para melhorar a validade do PSA no diagnóstico de cancro.
MétodosSelecionámos 551 doentes com PSA<10,0ng/mL, referidos para biópsia prostática e classificados como «cancro» e «não-cancro» após biópsia. A informação relativa ao uso de estatinas obteve-se nos registos clínicos dos doentes. Usámos «path analysis» para quantificar os efeitos direto (reflete a influência na biologia e metabolismo do PSA), indireto (reflete a influência no PSA através do efeito no risco de cancro da próstata) e total (soma dos efeitos direto e indireto) do uso de estatinas nos valores de PSA. Usámos curvas ROC para avaliar a validade de modelos que incluíam os valores de PSA, idade, índice de massa corporal, uso de inibidores da 5-α-reductase, uso de aspirina e estatinas para distinguir entre cancro da próstata ou situações benignas.
ResultadosObservámos um efeito total negativo das estatinas nos níveis de PSA (utilizadores vs. não-utilizadores: −0,633ng/mL; 95% CI: −1,087; −0,179), correspondendo, aproximadamente, a níveis 8,9% menores com estatinas, devido principalmente ao seu efeito direto (−0,588ng/mL; 95% CI: −1,034, −0,141) em vez do efeito indireto (−0,045ng/mL; 95% CI: −0,152, 0,061). Não houve diferenças estatisticamente significativas entre as áreas sob a curva dos modelos com e sem estatinas (p=0,274).
ConclusãoNos doentes referidos para biópsia, o uso de estatinas contribuiu para menores valores de PSA; o impacto clínico nestes doentes é baixo.
The use of statins has been increasing over the last two decades1,2 due to the definition of successively lower cut-offs for cholesterol levels associated with high cardiovascular risk,3 the changes in the spectrum of statins’ indication – with recommendations for its use in both primary and secondary prevention of cardiovascular events –3 and the intense marketing policies by pharmaceutical companies.4,5 Currently, statins are among the most prescribed drugs within countries of the Organization for the Economic Co-operation and Development (OECD), with an estimated average daily consumption of 91 Defined Daily Doses (DDDs) per 1000 people.6
In addition to the lipid lowering properties of statins, these drugs have shown anti-inflammatory, anti-invasive, tumor growth suppressing, apoptotic and angiogenesis inhibiting properties, potentially decreasing the risk of several cancers,7 including prostate cancer.7–9 Statins may also contribute to a reduction in total Prostate Specific Antigen (PSA) levels due to their action on benign prostatic tissue, and on the metabolism of cholesterol – a precursor in the synthesis of PSA.9 Epidemiological evidence supports a lower risk of prostate cancer among statins users, and several observational studies have shown that non-cancer patients under treatment with statins, especially long therapy courses, present lower levels of serum PSA.10–12
The impact of statins on serum PSA levels may lead to a decrease in prostate cancer detection when using the traditional cut-offs for reference to biopsy,11,13 and adjustment of the PSA threshold may be needed among statins’ users, to maximize sensitivity and specificity.14
Therefore, we aimed to quantify the effect of using statins on PSA levels, and to assess the potential impact of the exposure to these drugs in the diagnostic accuracy of PSA, among patients referred to prostate biopsy.
MethodsStudy population and data sourcesBetween October 2009 and November 2012, we consecutively recruited patients, at the Department of Urology of Hospital de São João, Porto, Portugal, referred to ultrasound guided trans-rectal prostate biopsy on the basis of abnormal digital rectal examination (DRE) or PSA ≥2.5ng/mL, and selected those with PSA <10ng/mL. Before undergoing prostatic biopsy, weight and height were measured and a fasting blood sample was collected for assessment of PSA and free PSA. None of the patients had received hormone therapy, radiotherapy or chemotherapy previously.
The results of the prostatic pathology assessment (cancer versus non-cancer) were defined by biopsy (12–14 biopsy cores). The participants with non-malignant disease in the first biopsy, but having a prostate cancer diagnosed within six months, were considered as cancer patients.
Information gathered by the physicians regarding the patients’ prostatic volume, previous medical conditions and currently used medication was obtained from clinical records for a total of 551 patients. Data analysis was restricted to this group.
Currently used medications were classified according to the Anatomical Therapeutic Chemical (ATC) classification system, from the 1st level – anatomical main group–to 5th level – chemical substance name –15 depending on the information available. Statins’ use was defined as the current treatment with any of the drugs belonging to ATC level C10AA (Hydroxy-methylglutaryl Coenzyme-A – HMG CoA – reductase inhibitors) including simvastatin (C10AA01), lovastatin (C10AA02), pravastatin (C10AA03), fluvastatin (C10AA04), atorvastatin (C10AA05), rosuvastatin (C10AA07) or pitavastatin (C10AA08). Data on specific dosage, duration of treatment or previously discontinued prescription medications were not systematically recorded and, therefore, not considered for analysis.
Statistical analysisTo compare quantitative and categorical variables across groups, we used the Mann–Whitney and the Chi-square tests, respectively. Statistically significance was considered when P<0.05. All reported P-values are two-sided.
We used path analysis to quantify the direct (corresponding to the influence on PSA biology and metabolism), indirect (through the relation with the risk of prostate cancer, which, in turn, is related to PSA levels) and total effect (the net result of direct and indirect effects) of statins’ use on PSA levels.16 This method is an extension of regression analysis that allows for simultaneous estimation of the interrelations between variables in a set, as well as to decompose the magnitudes of effects between variables with complex interrelations – which represent an advantage of this particular method –, as well as to compare them, allowing to test the plausibility of mediation effects.16
We assumed a causal/temporal relationship between the use of statins and the PSA levels, taking into account several potential confounders, as depicted in the Directed Acyclic Graph (DAG)17 presented as Fig. 1. The model reflects the minimum set of variables needed to estimate the global effect of statins on PSA levels, including the direct, indirect and total effect.
 representing estimates of direct (solid thick line) and indirect (solid dashed lines) effects of statins on total Prostate Specific Antigen (PSA) levels, calculated by path analysis. Direct effect (statins→PSA): β1=−0.588 (−1.034; −0.141), Indirect effect (statins→cancer→PSA): β2×β3=−0.045 (−0.152; 0.061), Total effect: β1+(β2×β3)=−0.633 (−1.034; −0.179). Note: The regression coefficients (β) and 95% confidence intervals (95% CI) were obtained using linear (presented in italic) or logistic (bold) regression models, as appropriate.")
Directed Acyclic Graph (DAG) representing estimates of direct (solid thick line) and indirect (solid dashed lines) effects of statins on total Prostate Specific Antigen (PSA) levels, calculated by path analysis. Direct effect (statins→PSA): β1=−0.588 (−1.034; −0.141), Indirect effect (statins→cancer→PSA): β2×β3=−0.045 (−0.152; 0.061), Total effect: β1+(β2×β3)=−0.633 (−1.034; −0.179). Note: The regression coefficients (β) and 95% confidence intervals (95% CI) were obtained using linear (presented in italic) or logistic (bold) regression models, as appropriate.
Models were fitted with Mplus software (Muthe¿n and Muthe¿n, Los Angeles, California); 95% confidence intervals were calculated by bootstrapping, and the models were considered to have a good fit when the estimated Root Mean Square Error of Approximation (RMSEA) was <0.05.18
We fitted logistic regression models, including cancer as the dependent variable and different combinations of PSA, age, BMI, 5-α reductase inhibitors (5ARI), aspirin and statins’ use as independent variables, due to their impact on PSA levels, and used the areas under the corresponding Receiver Operating Characteristic (ROC) curves to compare their predictive accuracy to distinguish between prostate cancer and benign prostatic conditions.19 The analyses were performed using STATA®, version 11.2 (StataCorp LP, College Station, TX, USA).
Ethical considerationThe project was approved by the Hospital de São João Ethics Committee.
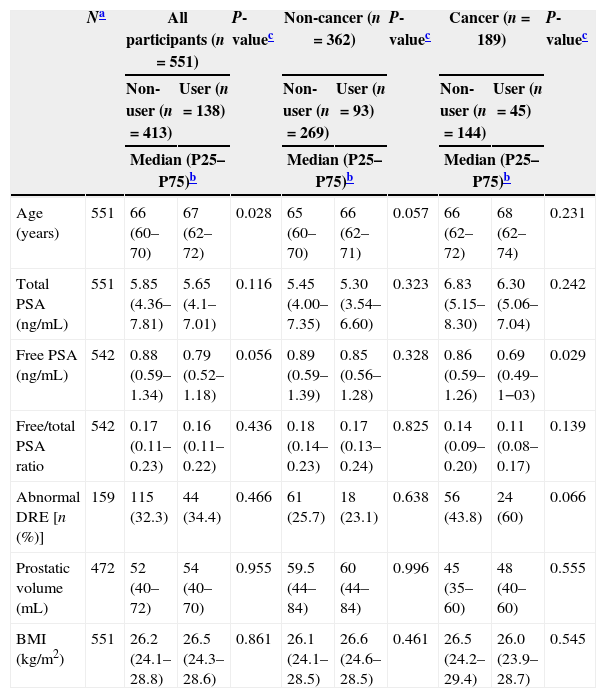
ResultsThere were a total of 138 statins’ users: 42.3% used simvastatin, 1.3% lovastatin, 18.1% pravastatin, 4.7% fluvastatin, 17.4% atorvastatin, 12.8% rosuvastatin and 0.7% pitavastatin. Statins users were significantly older than non-users and presented tendency for lower tPSA and free/total PSA ratio. No further statistically significant differences were observed according to the use of statins, except for lower levels of free PSA in statins’ users among cancer patients (Table 1).
Characteristics of the patients according to statins’ use, for all participants and according to prostate biopsy diagnosis.
| Na | All participants (n=551) | P-valuec | Non-cancer (n=362) | P-valuec | Cancer (n=189) | P-valuec | ||||
|---|---|---|---|---|---|---|---|---|---|---|
| Non-user (n=413) | User (n=138) | Non-user (n=269) | User (n=93) | Non-user (n=144) | User (n=45) | |||||
| Median (P25–P75)b | Median (P25–P75)b | Median (P25–P75)b | ||||||||
| Age (years) | 551 | 66 (60–70) | 67 (62–72) | 0.028 | 65 (60–70) | 66 (62–71) | 0.057 | 66 (62–72) | 68 (62–74) | 0.231 |
| Total PSA (ng/mL) | 551 | 5.85 (4.36–7.81) | 5.65 (4.1–7.01) | 0.116 | 5.45 (4.00–7.35) | 5.30 (3.54–6.60) | 0.323 | 6.83 (5.15–8.30) | 6.30 (5.06–7.04) | 0.242 |
| Free PSA (ng/mL) | 542 | 0.88 (0.59–1.34) | 0.79 (0.52–1.18) | 0.056 | 0.89 (0.59–1.39) | 0.85 (0.56–1.28) | 0.328 | 0.86 (0.59–1.26) | 0.69 (0.49–1−03) | 0.029 |
| Free/total PSA ratio | 542 | 0.17 (0.11–0.23) | 0.16 (0.11–0.22) | 0.436 | 0.18 (0.14–0.23) | 0.17 (0.13–0.24) | 0.825 | 0.14 (0.09–0.20) | 0.11 (0.08–0.17) | 0.139 |
| Abnormal DRE [n (%)] | 159 | 115 (32.3) | 44 (34.4) | 0.466 | 61 (25.7) | 18 (23.1) | 0.638 | 56 (43.8) | 24 (60) | 0.066 |
| Prostatic volume (mL) | 472 | 52 (40–72) | 54 (40–70) | 0.955 | 59.5 (44–84) | 60 (44–84) | 0.996 | 45 (35–60) | 48 (40–60) | 0.555 |
| BMI (kg/m2) | 551 | 26.2 (24.1–28.8) | 26.5 (24.3–28.6) | 0.861 | 26.1 (24.1–28.5) | 26.6 (24.6–28.5) | 0.461 | 26.5 (24.2–29.4) | 26.0 (23.9–28.7) | 0.545 |
P25–P75, percentile 25–percentile 75; BMI, body mass index.
Fig. 1 presents the relation between the variables tested to assess the plausibility of an effect of statins’ use on PSA levels, using path analysis; the overall fit of the model was good (RMSEA=0.00). We observed a significant negative total effect of statins on PSA levels (users vs. non-users: −0.633ng/mL; 95% CI: −1.087; −0.179), which corresponds to approximately 8.9% lower levels among statins’ users, mostly due to the direct effect (users vs. non-users: −0.588ng/mL; 95% CI: −1.034, −0.141) rather than that by the indirect effect (users vs. non-users: −0.045ng/mL; 95% CI: −0.152, 0.061).
Fig. 2 depicts the ROC curves that reflect the global predictive accuracy of models including PSA, age, BMI, 5ARI, aspirin and statins’ use for distinguishing between prostate cancer and prostate benign conditions. There were no statistically significant differences between the area under the curve (AUC) corresponding to the models with or without statins (P=0.274). Furthermore, there was no meaningful or statistically significant difference in the predicted probability of prostate cancer detection among statins users (24%; 95% CI: 17–31) and non-users (27%; 95% CI: 21–32) when setting the PSA value to 4ng/mL and considering the mean values of the remaining variables included in the model.
 curves for global predictive accuracy of different combinations of total PSA (PSA), age, body mass index (BMI), aspirin, 5-α reductase inhibitors (5ARI) and statins’ use for prostate cancer diagnosis. AUC, area under the curve; 95% CI, 95% confidence interval.")
Receiver operating characteristic (ROC) curves for global predictive accuracy of different combinations of total PSA (PSA), age, body mass index (BMI), aspirin, 5-α reductase inhibitors (5ARI) and statins’ use for prostate cancer diagnosis. AUC, area under the curve; 95% CI, 95% confidence interval.
When restricting the analysis to cancer patients, taking into account the use of statins did not modify the predictive accuracy of PSA to distinguish between low and high-grade disease at prostate biopsy; there were no significant differences between the AUC obtained from the models presented in Fig. 3 (P=0.202).
 curves for global predictive accuracy of different combinations of total PSA (PSA), age, body mass index (BMI), aspirin, 5-α reductase inhibitors (5ARI) and statins’ use for distinguishing between low and high-grade prostate cancer (Gleason score 3+4 or lower vs. 4+3 or higher). AUC, area under the curve; 95% CI, 95% confidence interval.")
Receiver operating characteristic (ROC) curves for global predictive accuracy of different combinations of total PSA (PSA), age, body mass index (BMI), aspirin, 5-α reductase inhibitors (5ARI) and statins’ use for distinguishing between low and high-grade prostate cancer (Gleason score 3+4 or lower vs. 4+3 or higher). AUC, area under the curve; 95% CI, 95% confidence interval.
In a group of patients referred to prostate biopsy there was a negative effect of statins on PSA levels. According to the model proposed for the relation between statins use and PSA levels, there was a weak association when considering only the effects mediated by the potential relation between the use of statins and the occurrence of cancer.
Despite the overall significant association between statins and PSA, no important difference in the predictive value of PSA testing is to be expected according to the use of these drugs.
Previous studies that evaluated the relationship between statins and PSA levels found lower levels of PSA among statins users10–13,20–22; the relative difference in PSA levels between statins users and non-users was −3% and −13% after one and five years of therapy with statins, respectively, in a sample from participants in the National Health and Nutrition Examination Survey (NHANES).13,20 However, methodological differences preclude direct comparison between our results and the ones from most studies conducted before.
Concerning the relationship between statins and cancer, we observed a non-significantly lower risk of prostate cancer, which is also in agreement with other studies that used a similar setting–men referred to prostate biopsy. In these studies, the risk ratios (RR) for prostate cancer diagnosis were 0.92 (95% CI: 0.85–0.99)23 and 0.95 (95% CI: 0.73–1.24)24 when adjusting for different confounders. Regarding the other relations depicted, the magnitudes of effects are in accordance with the available evidence with an exception for the association between aspirin use and PSA levels,25,26 since previous observational studies showed lower PSA levels among aspirin users.13
Our study adds to previous research on this topic a comprehensive assessment of the impact of use of statins in prostate cancer; we quantified the statins direct (statins→PSA) and indirect (statins→cancer→PSA) effect – through path analysis – and assessed the impact of decreased PSA levels among statins’ users in the prediction of prostate cancer – through ROC curve analysis. Nevertheless, some limitations need to be discussed. The absence of information from the patient's clinical records regarding the duration of treatment with statins, since it is one of the main determinants for statins anti-carcinogenic activity,10,13 contributes to an underestimation of the association between statins and prostate cancer and may help to explain why we observed a larger contribution from the direct effect on PSA levels. The cross-sectional nature of our analyses does not allow us to confirm the precedence of the exposure to statins over the observed PSA levels. Although it is unlikely that there is a causal relation between low PSA and the use of statins, the absence of information regarding access to health care services could have resulted in an overestimation of the direct effects of statins on PSA levels.12,26 People who have a better access to health care are more likely to be prescribed a statin, possibly leading to lower PSA levels, as well as to undergo PSA testing more frequently and to be diagnosed with a prostate cancer on the basis of lower PSA values. This probably had little impact in the internal validity of our findings, since all participants were referred for prostatic biopsy and a relatively high homogeneity in the access to health care may be expected among them. However, our results cannot be extrapolated to the general population or clinical settings with different risk of prostate cancer.
In conclusion, in a consecutive sample of patients referred to prostate biopsy, we observed that statins’ use was associated with lower PSA levels, but the clinical impact of this relation is low. Further investigation is needed to obtain more robust and generalizable estimates of the relation between the use of statins and PSA levels.
Ethical disclosuresProtection of human and animal subjectsThe authors declare that no experiments were performed on humans or animals for this study.
Confidentiality of dataThe authors declare that they have followed the protocols of their work center on the publication of patient data.
Right to privacy and informed consentThe authors declare that no patient data appear in this article.
Conflicts of interestThe authors have no conflicts of interest to declare.
