


As regional development becomes increasingly technically complex, technological capability has a growing influence on economic growth. Traditional theories predominantly concentrate on macro-level concepts, often overlooking the relationship between technological capability and regional economic growth, which has seldom been empirically examined. From the perspective of ‘technology space’, we select data on Chinese invention patents to construct indicators and explore its impact on economic growth. Our empirical results reveal that technological capability is a significant driver of regional economic growth. Our findings reveal four notable results. (1) Technological capability positively promotes regional growth but exhibits certain non-linear characteristics wherein as technological capability improves, its marginal effect on economic growth diminishes. (2) Technological capability primarily fosters regional economic growth through technological upgrading, industrial diversification and knowledge spillover mechanisms. (3) The policy environment and market conditions moderate the promotional effect of local technological capability on regional economic growth. (4) The economic growth effect of technological capability is time-dynamic and exhibits regional heterogeneity. The conclusions of this study deepen the understanding of regional development theory in terms of technology path dependence and breakthrough mechanisms, revealing technological capability as a core driving force behind regional economic evolution and redefining the logic of regional economic growth. These insights offer actionable guidelines for policymakers to tailor strategies according to local technological endowment stages.
Amidst the combined effects of global value chain restructuring and ‘anti-globalisation’, the core driving force behind regional economic growth is transitioning from traditional factor-driven to innovation-driven approaches. The reshaping of local technological ecology related to developed countries’ ‘re-industrialisation’ strategy and China’s promotion of the ‘new quality productivity’ policy indicate that the localised accumulation of innovation has become a key dimension of regional competition. However, in the process of innovation-driven economic transformation, significant regional imbalances have been revealed. On the one hand, regions such as Silicon Valley and the Guangdong–Hong Kong–Macao Greater Bay Area have experienced sustained growth with robust technological innovation ecosystems. On the other hand, resource-based areas and traditional industrial bases are ensnared in the dilemma of ‘low technology lock-in’ and can even exhibit the paradox of increased investment in research and development (R&D) intensity yet stagnant total factor productivity.
The phenomenon of regional development differentiation indicates that local innovation performance relies on static resource endowment as well as the organisation and adaptability of technology and its dynamic interplay with regional industrial structure, institutional environment, human capital and other factors. In other words, local technological capability is a crucial factor in explaining regional economic growth, and disparities in technological capabilities may exacerbate regional economic differentiation. Therefore, a deeper understanding of the correlation between technological capability and regional growth has significant economic implications. The practical contradictions in regional development noted above inform the core research questions of this study. At the causal level, is local technological capability an endogenous driving force of regional economic growth? At the mechanism level, how does technological capability influence economic performance? At the condition level, how are the effects of technology-driven economic growth constrained by the policy environment or market conditions?
Traditional theories on the definition predominantly concentrate on the macro-level of R&D investment or the quantity of patents and other stock measures, neglecting the multi-dimensional characteristics of technology such as organisational aspects, adaptability and local relevance. In addition, existing research inadequately addresses the black box of the correlation between technological capability and regional economic growth, particularly regarding the theoretical challenge of overcoming technological path dependence. While previous studies recognise the lack of systematic analysis on the pathways through which technological capability transforms into productivity, they overlook how these pathways are embedded in historical accumulations and institutional lock-ins that create rigid technological trajectories such as the smartphone industry. Early dominant designs addressed path dependence as cumulative technical experience and industry standards. For example, when touchscreen technology emerged, incumbents faced resistance from entrenched R&D routines, supplier networks and user habits—factors that perpetuated the ‘keyboard-centric’ trajectory until Apple redefined the paradigm by integrating touchscreens with software ecosystems, overcoming technical inertia and institutional lock-ins. This illustrates how historical investments and systemic norms establish rigid pathways that hinder radical innovation.
The literature has two main limitations. First, it struggles to explain how path-dependent routines shape and constrain the conversion of technological potential into productivity. For instance, regions may be trapped in incremental innovation, with existing competences hindering the adoption of disruptive technologies and lacking theoretical guidance on strategic reconfiguration. Second, a lack of critical engagement with the dynamic evolution of technological space remains. Current analyses treat technological capability as static, ignoring its relational nature that evolves through internal firm-level and external environmental interactions. In summary, previous research lacks a comprehensive theoretical framework integrating the micro-foundations of capability conversion and the macro-dynamics of technological space evolution. A more refined approach is needed to explain how regions can disrupt inert technological trajectories and bridge the gap between technological potential and sustained growth.
This study addresses the limitations of previous research by integrating new growth theory with the perspective of evolutionary economics, offering an interpretation of the concept of technological capability from the perspective of local technology correlation. We construct an analytical framework to examine the non-linear characteristics and path-dependent effects of local technological capability on the regional economy. This study elucidates the influence mechanisms from technological comparative advantage upgrading, industrial diversification and knowledge spillover dimensions. It opens the black box of the dynamic correlation between technological capability and regional development, overcoming the constraints of traditional macro-factor analysis. Second, the study uses China as a case study and quantifies technological capability using a technology density index derived from patent data. We construct a causal correlation model linking technological capability to regional economic growth to systematically test the dynamic effect of technological capability on regional economic growth. This approach addresses the longstanding issue of a lack of micro-mechanism verification. Third, by analysing the impact of policy environment and market conditions on the economic transformation effect of technological capability, the study reveals a feasible path for developing regions to break free from low-end lock-in and achieve technological structure upgrading through accumulated technological capability. Developing regions should invest in technological infrastructure and nurture local knowledge networks; for example, using tax incentives to promote enterprise technological collaboration. Developed regions should focus on technological innovation and global value chain upgrading; for example, by establishing cross-regional R&D alliances.
The remaining contents are organised as follows. Section 2 presents a brief literature review. Section 3 presents the theoretical framework of technological capability driving economic growth and proposed research hypothesis. Section 4 introduces the measurement method of technology capability index and provides descriptive statistics to reveal several characteristic facts. Section 5 presents the empirical analysis and examines the influence mechanisms. Section 6 expands the research based on the dual regulating effect of policy environment and market conditions, and Section 6 elaborates on the main conclusions.
Literature reviewTheoretical origin of technological capability: from product space to technology spaceRegional economic growth is a central topic across multiple fields, including economic geography, economic history and development economics. Traditionally, the question of regional economic growth is approached from a macro-level perspective to understand economic growth from aggregate inputs of investments in R&D and education, quality of institutions and knowledge spillovers (Rodríguez-Pose and Crescenzi, 2008). However, product space theory shifts the focus of regional growth from aggregate analysis to the process of diversification generated by specific products and how such diversification affects economic development (Neffke et al., 2011; Boschma et al., 2013; Essletzbichler, 2015; Guo and He, 2017). The transition from the aggregate to the product level leads to an alternative understanding of regional development as a path-dependent process of diversification, where the current portfolio of a local economy contains potential opportunities for diversifying into new products. From this perspective, economic growth can be considered an evolutionary process in which economies gradually evolve into related and more complex products over time (Balland et al., 2019; Davies and Maré, 2021; Mewes and Broekel, 2022; Rigby et al., 2022).
Product space theory and the Schumpeterian paradigm contend that product diversification is a significant driver of regional economic growth. Furthermore, technology is increasingly becoming a core element that promotes regional economic growth and a significant source of regional comparative advantage. Product diversification and the evolution of product spatial structure are only appearances that often imply changes in the mix of technological activities in a region (Neffke et al., 2011). According to technology path dependence theory, regional technology evolution is affected by existing technology accumulation and path dependence. Technologically advanced regions can consolidate technological advantages by relying on the established technological path and continuously conducting cutting-edge technological innovation, which can be a driving force for industrial transformation and structural evolution (Fu et al., 2013).
However, when regions have a low capacity for new technology expansion, they may face the risk of industrial structure lock-in, which will restrict sustainable economic growth. From this perspective, regional economic growth depends on the continuous accumulation of technological elements as well as mastering the ability to overcome the dependence of technological path lock-in to achieve new technological comparative advantages and industrial structure transformation.
Product space theory is the first to elaborate the related concepts of capability from diversity and relevance perspectives. According to this theory, product space is heterogeneous and discontinuous, with dense core areas and sparse marginal areas and producing a product requires corresponding capabilities. The production capacity in the dense core area has stronger substitution capabilities, which makes it easier to develop new products. The substitution capacity of products in sparse marginal areas is weak, making it difficult to develop new products. Therefore, the spatial structure of regional products may determine the evolution of comparative advantage, affecting economic growth. Evolutionary economic geography (EEG) further expands the theoretical framework, considering economic growth as an evolutionary process through the continuous restructuring of capabilities into new product development (Hausmann and Hidalgo, 2011; Inoua, 2023; Van Dam and Frenken, 2022). In relevant EEG studies, local capabilities are considered to be a source of regional transformation and capability is generally defined as the basis of development composed of a series of conditions. Such regional bases can enhance the links of production activities (Boschma, 2017). Yeung (2021) demonstrates the significance of local capabilities for establishing new industrial links and upgrading existing industrial chains. Other studies confirm that regions build on existing capabilities to develop new activities (Balland et al., 2019; Boschma, 2017).
Based on this, we derive the concept of technological capability. In contrast to discussions on product complexity and its economic relevance, no common definition of technological capability has been reached. The majority of studies conflate technological capability with narrow metrics such as R&D investment or patent counts, overlooking its constitutive elements: the adaptive capacity of firms to reconfigure internal routines in response to technological shocks, and the embeddedness of capabilities within regional innovation ecosystems that shape their applicability to local economic conditions. Regarding organisational adaptability, previous research fails to adequately theorise concerning how firms balance leveraging existing competences with exploring new ones, particularly when facing institutional barriers. Similarly, the concept of local relevance (the alignment between regional resources and technological capabilities) receives limited attention. This oversight means that regions may develop advanced capabilities that do not integrate with local production systems, hindering inclusive growth. For example, in the Yangtze River Delta region, where local manufacturing clusters and abundant scientific research resources are highly aligned, technologies such as intelligent manufacturing and new energy may quickly diffuse into production systems, driving rapid industrial upgrading. In contrast, some western regions may introduce advanced digital technologies that do not match local resource endowments (e.g. underdeveloped traditional industries and scarce technical talent), resulting in low technology absorption efficiency and difficult integration with local economic structures, which will weaken the spillover effect of technological diffusion. A more critical approach is essential for understanding how these dimensions interact with path-dependent trajectories and impact the conversion of capabilities into productivity.
However, a consensus exists on a number of its basic features. Fransman and King (1984) provide the earliest definition of technological capability as identifying reliable alternative technologies, determining the most appropriate technology to introduce, realising the conversion of imported technology from input to output, improving the capacity to adapt to local production conditions, achieving local innovation and developing locally adapted ability of R&D equipment, developing basic research programmes and enhancing the capacity to improve technology. In general, the contents and components of technological capability can be divided into three categories. (1) Abilities based on the technical operation processes (Fransman and King, 1984; Stewart, 1990). (2) Abilities based on the enterprise’s production and operation activities. (3) Abilities to operate and apply knowledge stock. We contend that the essence of regional technological capability is the ability to connect regional technologies and knowledge. In other words, in the context of continuous technological change, to produce goods and services, regional technological capability contributes to cumulative knowledge by selecting, acquiring, assimilating, improving and creating technologies for integration with other resources.
Relationship between technological capability and economic growthExisting studies offer various explanations for the correlation between technological capability and economic growth. New growth theory emphasises the linear transmission of knowledge spillover (Aghion & Howitt, 1992). The theory of institutional economics considers technological capabilities to be the result of resource allocation under the institutional framework(North, 1990); however, this perspective has limitations. Teece (1986) notes that its excessive emphasis on institutional decision-making and neglect of the initiative of technology subjects weaken the creativity of technological innovation. Meanwhile, it is difficult to use static analysis to explain the non-linear evolution of technological capabilities in a dynamic environment (Dosi, 1982) and this approach does not consider geospatial differences (Boschma and Frenken, 2011). Therefore it cannot account for the differentiation of regional technological capabilities under the same system. In contrast, EEG places technological capabilities in a dynamic evolution process of the spatial dimension, asserting that their formation is the product of the interaction between regional knowledge bases, innovation networks and localised learning. EEG emphasises the geographical proximity of technological diffusion and unique regional innovation environments, providing a more explanatory theoretical framework for understanding the multi-dimensional attributes of technological capabilities(Boschma and Frenken, 2011).
Some research examines the impact of local technological capability or technological complexity on economic growth from the product level (Ferrarini and Scaramozzino, 2016; Chávez et al., 2017). From the perspective of product structural complexity, Ferrarini and Scaramozzino (2016) analyse how countries’ efforts to update complex product portfolios can expand production processes and have an impact on economic growth. Chávez et al. (2017) calculate the economic complexity of each state using industrial structure data from Mexico, finding that different regions’ production structure differs significantly but all of them are positively correlated with economic growth. Similar to the product space theory perspective, we argue that regional technological capability accumulation and the resulting change of technological structure have significant impact on economic growth and is closely related to inter-technological correlation and technological spatial structure. However, few studies explore the effect of technological capability on regional economic growth from the technology level. This study examines the relationship between technological capability and economic growth and demonstrates that technological upgrading and industrial structure evolution caused by technological capability accumulation are significant driving forces for regional economic growth.
The main marginal contributions of this study are threefold. (1) First, the study provides a new perspective for explaining economic development. We expand the traditional product space theory to the dimension of regional technology structure, derive and develop a technology space measure and combine it with localised technology capability to provide a theoretical explanation for regional economic growth from the perspective of technology capability. We focus on exploring the impact of changes in technological capabilities on more complex products and the surrounding industrial structure. (2) Second, this study identifies a possible development path for developing countries as existing research mainly focuses on developed countries. Taking China as a research sample, we comprehensively demonstrate the characteristics of the gradual evolution of China’s technology space, verifying that large developing countries can leverage the space of structural transformation to continuously accumulate technological capability endowments to achieve stable economic growth. (3) Third, we address a pressing empirical research gap, investigating the relationship between technological capability and regional economic growth, which has rarely been empirically examined. Using patent data from subdivided fields, we employ technology density as a measure to assess the potential technology capability of 31 Chinese provinces in relation to economic growth.
The theoretical framework and research hypothesisTechnological capability threshold effectBy theorizing regional economic development as a continuous process of diversification, one can describe a regional economy as the portfolio of technologies produced at any given moment in time. To be able to produce a particular portfolio, specific capabilities associated with the technologies in the portfolio are required. Evolutionary theorizing in economics often invokes the notion of organizational capabilities,which have been understood as a property of organizations. In more recent work by Hausmann and others on the economic development of regions and countries (Hidalgo and Hausmann, 2009; Hausmann and Hidalgo, 2011), capabilities are similarly understood as the set of inputs that are needed to produce a specific output.
Our theoretical framework starts from the assumption that, at the granular level of individual products, capabilities are strictly complementary akin to a Leontief production function implying that missing one of the required capabilities makes it impossible to produce a product. If one accepts the assumption that a product is produced once all required capabilities are present in a region, then the set of capabilities present in a region determines the set of outputs in that region at every moment in time. In this case, a region will move up the development ladder each time its economy acquires a new capability, which renders new combinations of capabilities feasible that allow for the production of new products, expanding the economy’s portfolio. As the total number of capabilities grows, new products will be more sophisticated than existing products because new products will combine, on average, more capabilities than existing products.
Figure 1 shows how local technological capabilities can contribute to regional economic development. In the process of Ⅰ, a region has three capabilities and four technologies. The links between capabilities and technologies indicate the capabilities are needed to produce a particular technology. In this case, the three capabilities in the region can be recombined in four different ways leading the region to produce four technologies. In the process Ⅱ, once the region acquires a fourth capability, here technology variety increases from four to five technologies, as this new capability can be combined with existing capabilities in only one way. Similarly, in the process of Ⅲ, the region acquires a fifth capability, here increasing technology variety from five to eight technologies, as this new capability can be combined with existing capabilities in three ways.

Obviously, with the improvement of technological capabilities, the probability of regional production of more complex, higher value-added products is also higher. In addition, these products tend to require a more precise division of labor and a more skilled labor force, which in turn helps the workers involved in the development of technology and the production of products to earn higher incomes. Therefore, from this point of view, technological capability represented by technological complexity is closely related to regional economic growth (Hidalgo and Hausmann, 2009). One can view regional development as a process of capability acquisition, leading to diversification into new technologies of rising average complexity. The challenge of economic development can then be understood as a challenge of capability acquisition, as the complexity of an economy can only grow through the addition of new capabilities (Hidalgo and Hausmann, 2009; Van Dam and Frenken, 2022).
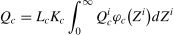
On this basis, based on the Ferrarini and Scaramozzino (2016) model, we further explore the impact of technological capability improvement and the changes in technological structure complexity on economic growth. Suppose that the country is composed of several regions,c=1,2,...,n, the scale of labor force and material capital are Lcand Kc, respectively and the level of technological capability of the region is Tc. Assume that the share of technological capability devoted to the production of complex technologies is λc, and the share devoted to the production of general technologies is 1−λc,λc∈[0,1].
The heterogeneity of different technology fields is reflected in different levels of technology complexity, which is expressed by parameter Zi. Since the technology complexity of different fields is reflected in the specific technological characteristics of different fields, we assume that the value of this parameter remains constant. Assuming that the economic growth of a region is only related to the development of complex technologies, the output related to regional technology fields can be expressed as:

In formula (1), the regions have continuous technological fields that are evenly distributed in the unit interval. Assuming that the output level is an increasing function of the share allocated to highly complex technologies λc and the level of technological capability Tc, as well as a function of technological complexity Zi, the parameter αccan be used to reflect the economic impact of the increasing complexity of regional technological structure. φc(Zi) represents the density function of the technology complexity of region c technology field i, then the total output of region c can be expressed as:
For the sake of analysis, it is assumed that the regional technology fields obey the general Gamma distribution, i.e.Zi∼Gamma(kc,βc). Among them, kc>0,βc>0, then φc(Zi) can be expressed as:

According to the nature of the Gamma distribution, the average technology complexity of a region is Zc=Ec(Zi)=kcβc. Among them, kc represents the shape parameter, which can also be understood as the technology parameter related to the characteristics of the technology field, and constant between various regions, so we can obtain kc=k, c=1,2......,n;βc stands for the scale parameter, which is the graphical effect of horizontal and vertical scaling, and is related to the specific distribution of regional complexity, so Zc=kβc.
By substituting equations (1) and (3) into (2), the output level of the region can be expressed as:

Further, referring to the human capital formation equation of Lucas (1998), we can obtain the formation equation of technology capability as follows:
Where, parameter uc is a measure of the effectiveness of regional technology capability. Further, take the derivative of equation (4) and bring equation (5) into the result after derivation, the expression of output growth can be obtained as follows:

According to formula (6), regional economic growth is closely related to the share of technological capability allocated to complex technologies(λc), the level of technological capability(Tc), the size of labor force(Lc), physical capital(Kc) and the complexity of regional technological structure(αc). In addition, from equation (6), we can further derive the total factor productivity (TFP) reflecting the efficiency of economic growth as follows:

We can find that as the core driving force of economic growth, total factor productivity(TFP) is positively correlated with regional structural complexity. Therefore, based on the results of formula (6) and (7), we can conclude that as a region moves towards more complex technologies based on the accumulation of existing “capabilities”, new technologies emerge, while old technologies disappear, and the complexity of technological structure gradually increases, thus continuously improving the total factor productivity of the region and thus promoting regional economic growth (Adam et al., 2023). Based on the above theoretical analysis and model deduction, we can propose the following hypothesis 1:
H1 The accumulation of technological capability promotes regional economic growth.
From a theoretical perspective, the marginal impact of technological capabilities on economic growth can elicit dynamic changes that are closely related to the phenomena of resource misallocation and technology lock-in. According to the theory of resource misallocation, when technological capabilities are overly concentrated in a few enterprises or regions, it disrupts the optimal equilibrium state of factor allocation and forms a ‘Matthew effect’ of regional resource distribution. Relying on technological advantages, leading enterprises could attract core elements such as talent and capital, which establishes barriers for small and medium-sized enterprises’ factor acquisition, insufficient supply of innovation resources and results in a stratified innovation ecosystem. Meanwhile, the technology lock-in effect has gradually emerged in which regional economies overly rely on existing technological paths and find it difficult to adapt to the development direction of emerging technologies. This kind of path dependence could limit technological innovation within a specific paradigm, suppress the breadth and depth of technological diffusion, exacerbate the imbalanced development between industries and hinder the optimisation and upgrading of the economic structure.
The law of diminishing marginal returns demonstrates that the relationship between technological capabilities and economic growth is non-linear, particularly when analysed through the lens of micro-level factors such as corporate innovation and talent mobility. In the initial phase of technological development, forward-thinking firms invest in R&D and recruit skilled talent; for instance, startups allocate resources to develop new technologies and attract top professionals with incentives, rapidly enhancing efficiency and fuelling economic growth. However, once technological capabilities surpass a certain threshold, issues emerge. Established companies can become complacent, reducing investments in breakthrough innovations, while the talent market becomes imbalanced as high-end professionals gravitate towards leading firms, leaving marginal industries understaffed. This imbalance can result in a cycle in which leading firms engage in redundant R&D in saturated areas and smaller players struggle to access technology spillovers due to resource shortages. Coordinating innovation across firms can also become challenging as large companies enforce proprietary standards, and cross–disciplinary talent encounters barriers when switching industries. Consequently, the additional benefit of improving technological capabilities can diminish, and despite increased investment, the impetus for economic growth weakens. In essence, while initial technological accumulation drives short-term growth, unbalanced development and mounting micro-level frictions can limit long-term economic potential.
Therefore, the impact of technological capability on economic growth may not be a simple linear relationship. Although moderate technological capacity accumulation can enhance short-term efficiency, after surpassing a certain critical threshold, the coordination costs and innovation rigidity caused by imbalance may outweigh the growth momentum, constraining the regional economy’s sustainable growth. Based on the above theoretical analysis and model deduction, we propose the following hypothesis:
H2 The accumulation of technological capability has a threshold effect on regional economic growth. When regional technological capability is at a relatively low level, its improvement can better promote economic growth.
How does technological capability accumulation affect a region’s dynamic technological comparative advantage, industrial structure evolution and economic growth? This is the main question we explore in our study. We analyse this question from technology structure upgrading and industrial structure diversification perspectives.
Technology upgrading effectHausmann and Klinger (2007) propose the product space theory, which considers the impact of initial regional capability endowment on the industrial upgrading path from the perspective of dynamic evolution of comparative advantage. In contrast to the traditional theory of comparative advantage, the comparative advantage in product space theory is based on capability, contending that each product contains a set of production capacity, referring to the set of all production conditions that include the resource factor inputs required for production, the corresponding organisational mechanisms and legal system and other external environments. A significant point of product space theory is that the proximity of production capacities between products determines whether product conversion or industrial upgrading can be achieved smoothly. Caniels & Romijn (2008) demonstrate that the degree of spatial agglomeration of technology-intensive industries is positively correlated with regional innovation speed, verifying the impact of technological spatial density on upgrade efficiency.
Recent studies indicate that the technology development process bears similarities to that of industrial development. Technological advancements are typically concentrated in one or a few domains within a region’s technology space. The majority of existing literature presumes that regions share a knowledge pool and that the technology space is continuous and homogeneous, suggesting that enterprises within a region can consistently identify and refine new technologies within the existing technology space, facilitating the continuous and automatic evolution of comparative advantage. However, in reality, significant differences exist in the correlations between various technologies, and the technology space is actually discrete and heterogeneous with some dense areas of the technology space, while others are sparse. The evolution of comparative advantage stems from the correlation structure of the technology space (Hausmann and Klinger, 2007). In areas with dense technology space, it is easier for enterprises and entrepreneurs to transition from old to new technologies, achieving technological advancement and fostering new comparative advantages. This subsequently results in the creation of new products and industries and promotes economic growth. Conversely, areas with sparse technology space may lack the new technologies needed for upgrading, and the process of transitioning from old to new technologies may not be smoothly executed, and technology upgrading and economic growth could be impeded or experience stagnation.
Therefore, sustainable regional economic growth largely depends on the ability to operate within the technology space and the resulting knowledge-intensive breakthrough innovation capability, referring to the sum of a series of factors that promote the accumulation of knowledge and skills that promote smooth economic growth (Boschma, 2017; Rigby et al., 2022). From the perspective of institutional economics, particularly referencing Acemoglu’s (2005) property rights protection theory, these capabilities constitute intangible assets and products of institutional environments that foster and safeguard knowledge accumulation. Acemoglu (2005) emphasises that secure property rights such as intellectual property protection reduce innovators’ expropriation risks, incentivising continuous investment in knowledge creation and skill enhancement. Such institutional arrangements can transform decentralised individual knowledge into regional collective capabilities, embedding these intangibles into the local innovation ecosystem. Such capabilities are largely hidden intangible assets that are not easily imitated in other regions, and can drive broader technological innovation, providing a steady stream of motivation and capability for product innovation. In summary, the stronger the local capability is, the greater the possibility of opening up emerging technology fields and developing new products and the stronger relevant regional enterprises’ product investment and innovation ability will be, which will promote the regional economy’s long-term growth.
However, while enhanced technological capabilities measured by technological complexity can create new economic value, it will also inevitably introduce destructive changes in the technological structure. The production of complex products requires more hidden and dispersed technologies, incurring difficult technological restructuring and expanding the division of labour tasks, which increases the risk of technological innovation failure. Therefore, the impact of the more complex technological production process on output is uncertain. In the process of more complex technological capabilities enhancement, a force that continuously resists or obstructs technological upgrading can arise, tending to maintain the current technological structure and technological comparative advantage. However, overall, as long as a region has sufficient willingness to continuously move towards a more densely populated technological space, it will promote enhanced regional technological capabilities and sustainable economic growth.
In summary, existing studies indicate that technological capability accumulation shapes the trajectory of industrial upgrading by altering the proximity of the regional technological structure (Hausmann & Klinger, 2007), overlooking technological capability heterogeneity. By introducing the concept of technological sophistication, we demonstrate that technological capabilities foster advancements in new fields and sustain existing advantages through path dependence. This perspective challenges the linear assumption that technological transitions must supplant old technologies (Nelson & Winter, 1982) and underscores the bidirectional mechanism of the coexistence of old and new technologies. Building upon this analysis, we can propose the following research hypotheses:
H3a Technological capability accumulation promotes regional economic growth by guiding the evolution of technological comparative advantage.
H3b Technological capability has the dual influence of stimulating new technology comparative advantages and maintaining old advantages in the process of technological upgrading and the former effect is stronger than the latter.
From the perspective of industrial structure change, the primary path of regional economic growth is to continuously innovate in the original industry to improve the productivity of a single or major industry, and then fully capture the quasi-rent of the comparative advantage of the existing industry. The specialisation development path means that a specialised region will dominate the regional economy for a long time through technological agglomeration, maintaining the original production and innovation activities; however, the lack of revolutionary technological change will limit regional economic growth potential. In addition, it is also possible to diversify the industrial structure by developing new technologies to expand into more product lines. In the above analysis, we contend that technological capability is conducive to developing new technological advantages, which can affect overall productivity through knowledge externalities, improve the industrial structure and realise the transition from the specialised agglomeration of a single industry to the common development of diversified industrial structure.
From the perspective of industrial structure evolution, regional economic growth driven by technological capabilities hinges on a critical balance between specialisation and related diversification. While specialisation enhances productivity through incremental innovation within dominant industries, overreliance can risk entrenching path dependency, stifling adaptability to disruptive technological shifts. Conversely, diversification—characterised by industry relevance, technological complementarity and modular connectivity—can unlock growth by reconfiguring structural dynamics. Specifically, diversity amplifies knowledge externalities through three synergistic mechanisms. First, industry relevance lowers barriers to cross-sectoral knowledge spillovers, enabling regions to leverage existing capabilities while accessing adjacent markets. Second, technological complementarity fosters platform innovations that can simultaneously elevate productivity in multiple sectors. Third, modular connectivity establishes adaptive resilience by recombining core technologies, transforming specialised agglomerations into interconnected innovation networks. This structural shift mitigates the diminishing returns of specialisation while sustaining systemic productivity gains, enabling the transition from static comparative advantage to dynamic competitive advantage rooted in diversified and coherent technological ecosystems.
Furthermore, referencing Glaeser et al.’s (1992) industrial diversification theory, we differentiate between the technology-driven mechanisms of related diversification and unrelated diversification. Related diversification refers to resource allocation to more related industrial fields, which can be conceptually considered as dominated by new firms within the same industry. Different products’ production processes rely on distinct technologies, and a correlation exists between various products at the same production stage. Jacobides et al., 2018 indicate that technological complementarity is the core driving force behind related diversification. For example, automobile or computer assembly may depend on similar automation technology, and related diversification based on process flow can establish the capability to produce similar products. Furthermore, the production process can form a complete industrial chain, and different stages require different technical support, with certain links between technologies such as those between mobile phone chips and batteries. In contrast, unrelated diversification refers to the pursuit of industrial diversification across traditional paths, directly allocating resources to unrelated areas. Although it is often accompanied by high coordination costs (Argyres & Silverman, 2004), unrelated diversification considerably affects the regional industrial structure and is typically accompanied by the emergence of new industries, rather than the mere replacement of original products. We posit that technological capability can drive the transformation of the regional industrial structure towards diversification and the related industrial structure diversification has a more significant impact on regional economic growth. Based on the aforementioned theoretical analysis, we propose the following research hypotheses:
H4a Technological capability accumulation promotes local industrial structure diversification.
H4b Technological capability’s promotion of related industrial structure diversification and economic growth is greater than unrelated diversification.
Regional economic growth through local technological capabilities is essentially achieved via technological cooperation and knowledge transfer pathways. Technological cooperation connects dispersed innovation entities into a synergistic network, and knowledge transfer transforms technological expertise into shared resources. Together, these pathways overcome technological barriers, optimise resource allocation and translate technological advantages into industrial competitiveness. This process necessitates robust inter-organisational collaboration and institutionalised knowledge-sharing mechanisms, establishing a complete chain from technological accumulation to economic output.
The essence of technological collaboration is the establishment of cross-enterprise and cross-industry cooperative innovation mechanisms. In regional economic development, individual enterprises’ technological capabilities are often limited; however, different entities can share technological resources and research outcomes through collaborative models. Likewise, upstream and downstream enterprises can develop technology platforms to avoid redundant investments and concentrate on solving common industry challenges. Such collaboration can accelerate technological iteration and reduce innovation costs through risk-sharing, enabling advanced technologies to be translated into productivity more rapidly. Moreover, long-term stable collaborative networks can enhance regional innovation systems’ stability, attract external resources and establish a virtuous cycle of technological breakthroughs—industrial upgrading—economic value creation.
The essence of knowledge transfer requires the establishment of a standardised technology diffusion system. When technological capabilities are limited to individual enterprises, their broader economic value is restricted. Consequently, institutional designs are essential to enable the orderly dissemination of technological expertise. Formal channels such as patent licensing and technical standards convert complex technologies into tradable, standardised outputs, enterprises’ swift acquisition of mature technologies. Informal pathways like talent mobility and industry exchanges facilitate tacit knowledge transmission, including practical production techniques and management practices. This structured knowledge transfer fulfils dual objectives, broadening revenue streams for technology providers through licensing and shortening learning cycles and diminishing trial-and-error expenses for technology recipients. Moreover, intra-regional knowledge flow can stimulate secondary innovation, where enterprises refine and enhance existing technologies to meet specific needs, fostering a multi-layered technological innovation ecosystem, which magnifies the spillover effects of technology on economic growth. Building upon the aforementioned theoretical analysis, we propose the following research hypotheses:
H5a Local technological capability enhances the knowledge spillover effect, promoting regional economic growth.
H5b Technological capability strengthens the growth effect of knowledge spillovers through technological cooperation and knowledge transfer paths.
Based on the aforementioned analysis, Figure 2 illustrates the mechanisms through which local technological capability influences regional economic growth. In contrast to the traditional new economic growth theory, which concentrates on the linear output relationship of R&D investment, we adopt an evolutionary economics perspective and incorporate product space theory (Hausmann et al., 2007) alongside technological system theory (Nelson, 1993). This integration results in our three-dimensional analytical framework, which can dynamically capture the self-reinforcing mechanism of technological capability within economic growth (Arthur, 1989) and elucidate the path breakthrough phenomenon in regional industrial upgrading. This study bridges the gap between macro-growth theory and micro-innovation practice. Furthermore, compared with national innovation system theory that merely emphasises policy intervention (Lundvall, 1992), the framework of our study is better suited to examining the complexity of technological catch-up in emerging economies and offers actionable intermediate variables that inform future policy design.

Figure 2 shows the main research hypotheses of this paper.
Measures and some characteristic factsMeasurement methodsIn the capability framework, the relatedness between two technologies refers to the number of capabilities they have in common. By definition, two technologies can never be exactly the same, as each pair has a unique production function specifying a unique bundle of capabilities required to produce that technology. Logically, the relatedness between two technologies ranges from having no capabilities in common at all (minimum) to having all capabilities in common except one (maximum). Developing new technologies involves recombining old and new capabilities into new configurations that have economic value. Since these new recombinations consist of a new capability and capabilities that were already present, new technologies will be related to existing ones, giving rise to ‘the principle of relatedness’ (Lall, 1992; Frenken et al., 2023).
Hidalgo et al. (2007) introduced the concept of “product density” to measure the average relatedness between a potential product and the current products produced, that is, the production capacity of all products surrounding the product under the given conditions of product collection. Building upon this concept and referring to Mewes and Brökel (2022) and Davies and Maré (2021), we use “technology density” to refer to local technological capability, reflecting the advantage of ability endowments in regional technology space.
Technology comparative advantage(TCA)The measurement of TCA is based on the Revealed Comparative Advantage (RCA) proposed by Balassa (1986), which measures the weighting ratio of technology field i in all technologies in a region to the weighting ratio of technology field i in all technologies in all regions. Its specific calculation formula is as follows:

In the above formula, xicrepresents the number of field i in the regionc. If TCAic>1, it means that the technology field i has comparative advantage in the region c, and vice versa. On this basis, the “region-technology” matrix of TCA can be constructed, which can be converted to a binary logical matrix by comparing the size between TCA and 1, where:
Technology proximity
Technology proximity is based on the probability that any two technologies will have a comparative advantage in the same region. If there are more regions where two technologies with revealed comparative advantage can be created at the same time, it can be seen that the technological capabilities required by the two technologies are more similar and the distance between the two technologies is closer. This also means that the higher the proximity between technology i and j, the less difficult it will be to achieve transformation and upgrading between technologies. Its calculation formula is as follows:

In the above formula, ximeans that the technology i has a comparative advantage, xj means that the technology j has a comparative advantage, and P(xi|xj)(P(xj|xi)) means that under the condition that the technology j(i) has a comparative advantage, the technology i(j) also has a conditional probability of comparative advantage.Since the two conditional probabilities are not necessarily equal, we take the smaller value of the two, there is TPij=TPji, that is, the symmetry of the conditional probability values is guaranteed.
In specific calculation, we assume that xi and xj are independent events, so the above formula can be rewritten as follows:

The numerator of the rightmost fraction represents that xi and xj have the probability of comparative advantage in the same region at the same time, that is, the probability that xic and xjc are both 1 in the same region; The denominator max{P(xi),P(xj)} represents xi and xj has the larger value of the probability of each having a comparative advantage, that is, P(xi) is the probability of 1 in all regions, and the same can be obtained of P(xj). By calculating the proximity between any two technologies, the distance between them can be calculated, and then the regional technology spatial proximity structure can be formed.
Technology space density and technological capability“Technology density” refers to the average proximity of any technology to all other technologies in the region. Under certain conditions of technology collection in the region, “technology density” means the new ability of all other technologies around the technology. Its specific calculation formula is as follows:

In the above formula, φijis the proximity between technology i and other technology j.xjc is a binary logical variable of whether technology j in region c has comparative advantage. In the above formula, the numerator represents the sum of technology proximity of all the technologies with comparative advantage with technology i. The denominator is the path of technology i in the technology space. Technology density ωic is actually the weighted average of the proximity between technology i and the surrounding technologies, and its value reflects the size of the overall technological capability endowment of the surrounding area of i. The larger the index value, the more the existing technology structure of a region tends to the core area of technology space, the stronger the applicability of existing technology capabilities in the region, and the stronger the ability to develop new technologies.
Based on the technology density around each technology, the overall situation of regional technology density is further described using the following formula:
Where, Xc represents the number of technologies with comparative advantage in the region c. Furthermore, TC reflects the overall technological capability of the region c.Data description
Considering the availability and comparability of data, we utilize China's invention patent data from 31 provinces (regions) between 1985 and 2015 for measurement and analysis. Each patent application record encompasses the following information: Application Code, Applicant, Applicant Address, Application Time, and Citation. The patent application data is categorized by year, province, and IPC two-digit code, allowing us to ascertain the number of invention patent applications for the technology represented by each IPC two-digit code in every province. Relevant indicators can be derived through the application of a series of calculation formulas. Following the classification method of the Patent Search and Analysis of SIPO, patents are categorized into 8 main groups, labeled A through H, which can be further subdivided using secondary classifications. By excluding secondary classification numbers ending in 99, we obtain 121 types of secondary patent classifications (IPC two-digit codes).
Characteristic factsChanging trends of technological comparative advantageThe actual value of TCAic is converted into a binary logical matrix, and the sum of each value in the matrix of each region in each year is defined as Xc, which represents the sum of the number of all technologies with comparative advantage. It can be seen from Figure 3 that since 1985, the number of technologies with comparative advantage in China has been on the rise in general, but the growth has been close to stagnation since 2010.The trend not only confirms the fact that the number of technologies in China's comparative advantage is increasing (which also means that the number of high value-added and high-tech products is gradually increasing) and the technological competitiveness continues to increase, but also reveals the sign of insufficient innovation drive in recent years.

In Figure 4, we classify and summarize according to technological categories (A∼H). It can be seen that the growth rate of comparative advantage formation of technology category B (Operations;Transportation) is relatively fast, and the number of C category (Chemistry; Metallurgy) has been in a leading position since then. In addition, consistent with the trend reflected in Figure 3, the growth rate of the number of technologies with comparative advantage in each broad category also stagnated around 2010.
Space-time evolution of China's “technology space”
In this paper, 121 2-code “technology space” chart is constructed using Chinese patent data in 2000 and 2015 respectively, where each node represents a type of technology, and the connection weight between nodes is “technology proximity”. As can be seen from the Fig. 5, the layout characteristic of China's technology space structure is transformed from “sparse and uniform” to “dense core area and sparse edge area”. Specifically, the technology fields in the core area in 2015 mainly include B02, B03, A23, C25, F27, etc., which indicates that these technology fields are gradually accumulating “capabilities”, which is easy to promote technology upgrading and economic growth. However, the traditional technology at the edge of technology space has not shown significant accumulation of “capability” and obvious comparative advantages, and the driving force of innovation is insufficient.

Further, we calculate the index of technological capability as measured by “technological spatial density” and plot the trend over time. As shown in Figure 6, from the perspective of time scale, the average “technological capability” at the national level keeps rising over time, but after 2008, the growth rate gradually tends to 0.

To reflect the changing trend of technological capability at spatial scale, we plot the spatial distribution of technology density in China at provincial level in 1990, 2000, 2010 and 2015 respectively. From the perspective of regional dimensionality in Figure 7, the spatial distribution of China's technological capability has undergone a process of change from “dispersion” to “concentration” and then to “equilibrium”. From 1990 to 2010, the spatial scale has experienced a regional distribution shift from the “Bohai Rim region” to the “Pearl River Delta” and the “Yangtze River Delta”. After 2010, the spatial distribution gradually shows a balanced transformation, and the degree of regional differentiation between the eastern and the central regions gradually has narrowed.
Relationship between technological capability and economic growth
We further give descriptive statistics of technological capability and economic growth. We plot the trend of technological capability and GDP per capita in Figure 8 and their growth rate in Figure 9. In contrast, the two variables show an overall upward trend, but the average technology density basically slows down after 2007, failing to break the upper limit of 0.35. In contrast, per capita GDP has been on the rise, and there is no “ceiling” of growth. From the perspective of average technology density, it seems that the breakthrough of China's technological innovation capability has encountered a “trap”, and whether it can successfully overcome the trap of technological innovation capability has become a phenomenon worthy of attention.


As shown in Figure 10, from the provincial level as a whole, technology capability and per capita GDP of all regions are highly consistent. Beijing, Shanghai, Jiangsu, Zhejiang and Tianjin, which have a higher per capita GDP, also show a higher level of regional technological capability. In Gansu, Jiangxi and Tibet, where per capita GDP is relatively low, the density of technological capability is also at a low level.
Empirical analysisModel setting and variables description
To verify the impact of technological capability on economic growth (hypothesis 1), we construct the following fixed-effect model:

growth represents GDP growth rate. TC represents the technological capability, measured by the technological density index referred to the third part of this paper. ηc and θt represent fixed effects by region and year; εct represents the random disturbance term. Our paper focuses on the estimated coefficient α1, which reflects the overall impact of the more complex technological innovation capability improvement process on economic growth based on the accumulation of existing technological capabilities.
CVs are a series of control variables that affect regional economic growth, including six aspects: (1) Natural resource endowment(nr). Regions with higher resource endowment have greater potential for economic growth. Tang (2017) believes that natural resources are distributed in geographical space rather than population dimension. Therefore, this paper uses the spatial density of natural resources to characterize the natural resource endowment of the region. In this paper, the output value per unit area of resource-based industries(ferrous metal mining industry, coal mining and washing industry, oil and natural gas mining industry and non-ferrous metal mining industry) are used to characterize the degree of natural resource endowment. (2) Government expenditure(ge). Government expenditure increases investment and consumption demand, which in turn drives regional economic growth (Geng, 2020). This paper uses the proportion of local government expenditure in GDP after deducting public expenditure such as science, education, culture and health. (3) Openness to the outside world(open). The improvement of the degree of opening to the outside world will increase the flow of resources and technical exchanges between regions, and advanced production technology and management experience will improve the marginal output of capital. Consistent with existing literature, this paper uses the proportion of total imports and exports in GDP as a measure of openness to the outside world. (4) Urbanization level(urban). The higher the level of urbanization, the greater the scale agglomeration effect of industry and population, which is conducive to expanding domestic demand and market scale, and thus promoting economic growth. (5) Human capital level(hum). The level of human capital is the key factor of innovation and economic growth, and has strong knowledge spillover effect. The data of above variables are mainly collected from China Industrial Economy Statistical Yearbook, China Statistical Yearbook, China Fixed Asset Investment Statistical Yearbook, etc. This paper defines the econometric analysis period as 2001-2015 due to the poor data quality in the patent database we have after 2015. Specifically, the data quality issues manifested in the following aspects: First, there are missing key fields, such as the absence of patent application dates and applicant contact information in patent data, which affect the integrity of data analysis. Second, there are changes in statistical calibers, for instance, some patent classification standards were adjusted after 2015, leading to inconsistencies in the classification of patents across different periods and making longitudinal comparisons difficult. Third, there is a decline in regional statistical coverage, with some regions no longer reporting certain types of data after 2015, resulting in an incomplete representation of the overall situation. Although the latest data would enhance timeliness, the consistency and completeness of the 2001-2015 dataset ensure the robustness of causal inference and longitudinal comparability. Table 1 lists the definitions and descriptions of the main variables.
Variable definition and description.
Fig. 11 draws a scatterplot between local technological capability and per capita GDP. The figure shows that there is a significant positive correlation. However, correlation does not imply strict causation, so we will use econometric models for more detailed tests.
Baseline regression
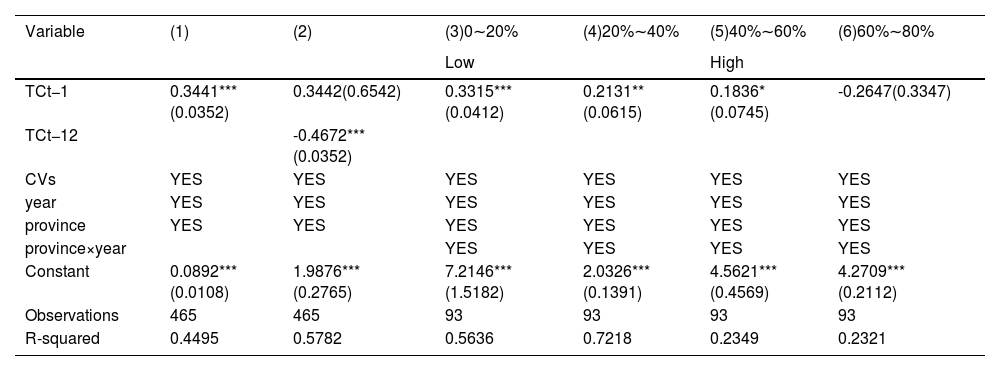
Table 2 shows the estimation results of the impact of technological capability on economic growth. Among them, the model in column (1) does not control for any fixed effect or other control variables, and its estimation results show that the impact of technological capability on regional economic growth is significantly positive within 1% confidence interval. In columns (2) - (4), we control for regional fixed effects, time fixed effects, and control variables, respectively. According to the regression results controlling all factors in column (4), the regional economic growth can be increased by 0.3441 units for every one unit increase in the coefficient of TCt−1. In general, the richer the technological capability and the stronger the innovation capacity, the more the region will be able to maintain stable economic growth.
Linear effect:Technological capability and economic growth.
Note: *, ** and *** are significant at the level of 10%, 5% and 1%, respectively; Values in parentheses are standard errors. The following tables are the same.
In addition, the change of technological structure and the cultivation of technological capability can not be achieved “overnight”, and its impact is likely to lag behind. In order to observe the lag effect, we add the second and third lag of TC respectively on the basis of the first order lag in the benchmark regression. It can be seen from the results in columns (5) and (6) that the impact of the third and second lag is greater than that of the first lag, and the coefficient of the third lag is greater than that of the second lag, which indicates that with the dynamic growth of technological capability, its impact on regional economic development will become more and more significant.
This paper aims to examine the nonlinear impact of technological capability. In the second column of Table 3, we incorporate the quadratic term (TCt−12) and the findings indicate that the primary term is positive while the quadratic term is negative. This suggests that technological capability exerts a nonlinear, inverted U-shaped influence on regional economic growth. The inflection point value of the nonlinear effect, which marks the transition from a positive to a negative impact, can be calculated as 0.3681. This value is slightly higher than the sample's average, implying that for contemporary China, technological capability predominantly has a positive effect.Most regions still have room to enhance their technological capabilities to further stimulate economic growth before reaching the inflection point where the effect might start to diminish. This also indicates that promoting technological progress remains a viable and important strategy for sustaining regional economic growth across most areas, as the current overall technological level has not yet crossed the threshold where its marginal benefits would begin to decline.Additionally, we segment the sample into four categories (based on different quantile levels) for regression analysis. Among them, the first two categories can be regarded as low -technology capability regions, and the last two categories can be regarded as high-technology capability regions.We also add an interaction term between regional fixed effects and temporal trends in the regression, thereby controlling for regional heterogeneity.The results reveal that as technological capability improves, its impact on regional economic growth diminishes, thereby further substantiating the aforementioned nonlinear effect.Therefore, combining the above analysis, hypothesis 2 can be verified.
Nonlinear effect:Technological capability and economic growth.
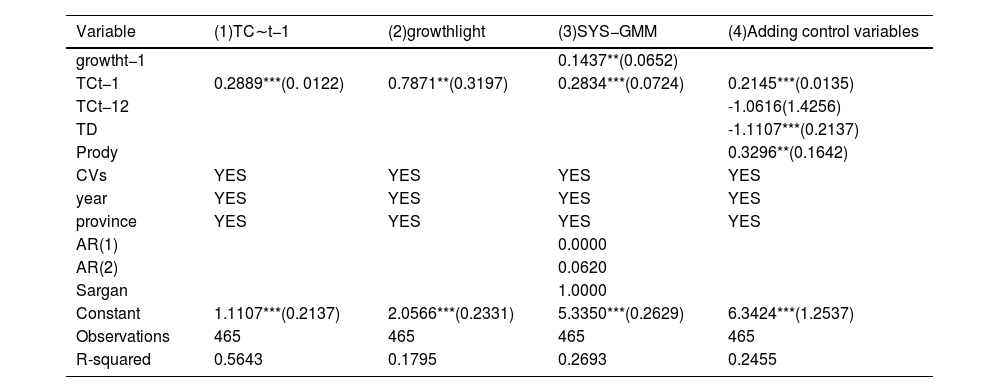
The robustness test will be carried out by changing the explanatory variable and the explained variable. On the one hand, the explained variable is measured in light data. At present, a large number of economists have applied night light data to the research of economic growth and other fields (Clark et al., 2017). With reference to the method of Liu et al. (2017), the existing lighting data is corrected, and the lighting brightness at 31 provincial levels are obtained. On the other hand, the invention patent authorization data is used to re-estimate the explanatory variables related to the patent, and then replace the original explanatory variable. Compared with the application data, the patent authorization data can filter out some low-quality patent applications and effectively reflect the situation of regional technological progress. Columns (1) and (2) of Table 3 show the estimates using the two measures above, which are significantly positive at the confidence level of 1% and 5%, respectively.
Changing the regression methodEconomic growth usually has the characteristics of dynamic continuation, this paper will construct dynamic panel data to deal with this problem. We take the lag time of the explained variables and the main explanatory variables as endogenous variables, and the control variables as instrumental variables, and use GMM method for regression. The AR (1) test value of the regression model approaches 0, and the AR (2) test value is greater than 0.05, indicating that the residual series after difference only has first-order auto-correlation, but not second-order auto-correlation. At the same time, the result of Sargan test value is not significant, indicating that the null hypothesis of over-recognition cannot be rejected. According to the results in column (3) of Table 3, the coefficient symbol and significance of the core explanatory variables after using the systematic GMM estimation method are not significantly different from the benchmark regression. The above results prove that the basic research conclusions of this paper are robust and reliable.
Adding control variables related to “technology”① Quadratic termTC2. To verify possible nonlinear relationship, we add the quadratic term of TC to the model. The estimated results show that the coefficient of the primary term is still significantly positive, while the coefficient of the quadratic term is not significant. This not only further verifies the basic conclusion, but also shows that there is no inverse U-shaped relationship between technological capability and regional economic growth.
②Technological diversity TD. The measuring index is caculated by the following formula:TDc=−∑i(xvalic∑ixvalic)log(xvalic∑ixvalic). The abovexvalicshows the number of new additions of technology field i in region c. The higher the value, the higher the regional technology diversity, and the more dispersed the distribution of various types of patents in different fields. According to the regression results in column (4), the estimated coefficient of TDcis significantly negative at the 1% confidence level. This shows that excessive diversification of technological structure is not conducive to regional economic growth. One possible explanation is that the dispersion of fields within the local makes it more difficult to identify and integrate knowledge resources. The diversified technology structure with weak correlation will lead to the "noise" in the process of technology diffusion and transmission, which will inhibit regional innovation and even economic growth to a certain extent.
③ Technology added-value Prody.The structural transformation occurs to create more added value, and the upgrading of technology with strong added value ability is an important source of power for regional economic growth. For this reason, this paper refers to the method of Hidalgo and Klinger (2007), combines comparative advantage and per capita GDP, and designs an index to measure regional technology added-value. The specific calculation formula is as follows:

As can be seen from the above equation, Prodyreflects the per capita income level related to technology. According to the regression results in column (4), we can see that the estimated coefficient is significantly positive at the confidence level of 5%, which indicates that under the condition of a certain regional technological capability, improving technological capability is conducive to the profitability of enterprises and drives the transformation of regional technological structure.
Based on the analysis results in column (4) in Table 4, it is consistent with the original regression, and the coefficient sign and significance of the core explanatory variable have not changed significantly, which indicates that the basic conclusion of this paper is robust.
Robustness tests.
In this paper, the two stage least square method (2SLS) of instrumental variable is used to deal with the endogeneity problem. With reference to Zheng et al. (2021), the instrumental variable “Government innovation expenditure intensity” (gov) is selected, and it is set as the proportion of government expenditure on science and technology activities in regional GDP. The increase in this proportion means that the government has made public investment in the innovation on a larger scale or scope, and has played a more encouraging and guiding role in the innovation activities. The rationality of choosing "government innovation expenditure intensity" as an instrumental variable lies in the fact that the government's innovation participation will inevitably affect the direction of local technology diversification activities and the improvement of innovation capacity.
Table 5 shows the estimated results of the 2SLS method. Among them, the heteroscedasticity robust DWH test shows that the null hypothesis is rejected at the significance level of 5%, indicating an endogeneity problem. The regression results in Table 5 pass the under-recognition test (Kleibergen-Paap rk LM statistic) and the weak tool test (Kleibergen-Paap rk Wald F statistic), which indicates that the selected instrumental variable is valid. The regression results of the first stage show that the increase in the intensity of government R&D expenditure will promote the concentration of regions in related technology fields and improve the spatial density of localized technology. The regression results of the second stage show that the introduction of instrumental variable does not affect the main conclusion of the model, and the coefficient of the main explanatory variable is significantly positive. The regression results corresponding to the instrumental variable 2SLS method show that the results of the benchmark regression are robust and reliable. In addition, the results of the first stage of regression show that the intensity of government innovation expenditure can guide local innovation entities to diversify related technologies, and promote the improvement of localized technology capabilities.
Heterogeneity analysisDifferent time periodsIn order to reflect the different impacts of technological capability growth on regional economic growth in different stages of China's economic development, this paper divides the sample into three periods: 2001-2005, 2006-2010 and 2011-2015, and then analyzes the heterogeneity. Regression results are reported in columns (1) - (3) of Table 6. It can be seen that the coefficient of the explanatory variable is significantly positive in the three time periods, which further confirms that the accumulation of technological capability has a positive impact on economic growth. At the same time, this effect has gradually increased over time. This reflects that with the increasing pace of China's reform and opening up, technological capabilities are playing a more significant role in driving economic growth.
Different regional development levelsIn order to further verify the heterogeneity of the impact of technological capability on economic growth, we divide all regions into four categories (backward, less developed, more developed and developed) according to per capita GDP from low to high, and then use the data of the four categories of regions to verify the basic regression model. The results are shown in Table 7. In general, the coefficients of explanatory variable are significantly positive at different confidence levels, but the estimated values gradually increase with the group from low to high, indicating that the more economically developed regions, the greater the dependence of economic growth on technical capacity endowment. Its economic meaning is that the more economically developed regions tend to have a stronger ability to expand new technology fields, and the less their technology diversification and regional economic growth depend on the existing technology stock. Most of these regions can easily get rid of the situation that the technical capability endowment continues to be locked in a certain field, and even have innovative behaviors to break the existing comparative advantages, and through the implementation of active industrial policies, and effective deployment of fiscal and tariff policies and other means, can achieve leapfrog economic development.
Heterogeneity analysis: Different development levels.
The Pavitt classification is a framework for categorizing types of technological innovation proposed by Pavitt(Pavitt, 1984; Pavitt, 1994). It aims to elucidate the sources of technology, patterns of innovation, and economic impacts across various industries. Specifically, Pavitt identifies four types of technological innovation behavior in enterprises: Supplier-Dominated (SD), Scale-Intensive (SI), Specialized Suppliers (SS), and Science-Based (SB). The technological innovation in supplier-dominated industries (SD) primarily relies on external suppliers, with enterprises having weak R&D capabilities. This category mainly includes traditional manufacturing industries such as furniture manufacturing, the wood industry, and the textile industry. Scale-intensive industries (SI) derive their technological advantages from large-scale production capacity and process innovation. Their R&D investments are focused on improving process efficiency and mainly include bulk material production and assembly industries. Specialized supplier (SS) industries primarily provide highly customized technical equipment or services as their core offerings. Technical knowledge in these industries is highly specialized and relies on the accumulation of experience, with machinery and instrument equipment manufacturing industries being typical examples. Technology innovation in Science-based (SB) industries is heavily dependent on internal R&D and basic scientific research, maintaining close ties with universities and scientific research institutions. This category mainly includes industries such as biomedicine and communication equipment manufacturing.
In this paper, the technological capability levels of various industries across different regions are calculated using the Reference Relation Table of International Patent Classification and National Economic Industry Classification (2018) compiled by the State Intellectual Property Office. Subsequently, the technological capability of sub-industries is averaged into broader industry categories. The regression results presented in Table 8 indicate that there are gradient differences from different industries based on Pavitt classification. Science-based industries exhibit the strongest driving effect, primarily rooted in the intrinsic nature of their technical knowledge. Such industries demand continuous heavy investment in R&D to generate breakthrough innovations, which inherently possess transformative potential to disrupt traditional industrial architectures. The cross-regional knowledge spillovers they facilitate are not merely superficial exchanges but deep-rooted interactions involving collaborative R&D networks, talent mobility across innovation hubs, and the diffusion of cutting-edge methodologies. This self-reinforcing mechanism, driven by the proprietary nature of scientific knowledge and its high adaptability across sectors, establishes science-based industries as fundamental catalysts for sustained regional economic transformation.The specialized supplier industry follows closely, with its tacit technical expertise diffused through local cooperation networks, directly enhancing the regional technical adaptability. In scale-intensive industries, cost reductions are primarily achieved through process optimization, leading to evident short-term growth, although long-term technology spillovers are somewhat limited. The supplier-dominated industry has the weakest role, with technical capabilities external to the enterprise and a low level of innovation, thus economic growth is mainly driven by the efficiency improvements from external technological inputs. Overall, these differences are fundamentally determined by the attributes of technical knowledge, the scope of spillovers, and the openness of the innovation network. Science-based and specialized supplier industries are more likely to develop sustainable regional competitive advantages due to their inherent technological accumulation and potential for collaborative innovation.
Heterogeneity analysis: Different industry types based on Pavitt classification.
The patent classification system typically relies on the technology field. The international standard for patent classification is the International Patent Classification (IPC) established by the World Intellectual Property Organization (WIPO), which divides the technology field into eight categories (A to H), as listed in Figure 4. Each category corresponds to a distinct technical domain. After assessing the technological capability levels of various technical categories across different regions, this paper regresses the technological capability of subcategories. According to the regression results presented in Table 9, there are differences in the intensity of the effect that different technology fields (A to H) have on regional economic growth. Generally, the technological frontier and the ability for cross-industry penetration are the core mechanisms that determine the economic impact differences among various patent departments. Technologies such as electricity (H), physics (G), and chemical metallurgy (C) are highly complex and versatile; thus, advancements in these fields significantly contribute to regional economic growth. In contrast, fields like textiles and paper (D), fixed buildings (E), and others with slower technological evolution or limited application scopes have a relatively weak marginal contribution due to their limited technology spillover effects and low industrial added value. Technical areas such as human necessities (A), operational transportation (B), and mechanical engineering (F) fall somewhere in the middle.
Heterogeneity analysis: Different technology complexity levels.
As discussed in the theoretical part of this paper, regional technology complexity is also an important factor affecting technological capability and growth performance. On the one hand, the higher the technology complexity, the richer the local knowledge reserve, and the higher the technical relevance and density, the more conducive to the local understanding, integration and absorption of knowledge, thus promoting the growth of local innovation and economic growth. On the other hand, when technological complexity is at a relatively low level, the marginal effect of technological ability to promote economic growth is often high. Therefore, this paper concludes that the influence of technological space density on economic growth will present different effects under different levels of technological complexity.
Referring to the method of Hidalgo and Hausmann (2009), we use the iterative method to measure the regional technology complexity (com). We then set five binary dummy variables according to the 10%, 25%, 50%, 75% and 90% percentile levels of the index value. It mean that, for example, the dummy variable is 0 when complexity is below 10% (25%, 50% or 75%) and 1 otherwise. We interact the dummy variable with the core explanatory variable, respectively. The coefficient of the interaction term can reflect the influence of regional technical capability on economic growth at different technical complexity levels. The estimated results in Table 10 show that the interaction coefficient gradually becomes insignificant from the significant level of 10% with the increase of the interaction coefficient, and becomes significantly positive again when the interaction coefficient reaches the level of 75%. This means that the influence of technological capability endowment on economic growth has a “bipolar effect”: when the level of regional technological complexity is in the low or high range, the positive promotion is more significant, while at the intermediate level, the effect of technological capability is not obvious. The economic implication is that the higher or lower the technical complexity of the region, its economic growth is more dependent on the existing technical capacity endowment.
Heterogeneity analysis:Different technology complexity levels.
In the theoretical analysis, we have elaborated that the accumulation of technological capability endowments will be conducive to the evolution of regional technological comparative advantages, promoting the region to break the dependence on old technological paths, and forming related diversified industrial structure to promote economic growth. Furthermore, we can summarize two influencing mechanisms (the effect of technology upgrading and the effect of industrial structure diversification). Therefore, we will carry out further empirical tests.
Technology upgrading effectBased on the complementary term idea proposed by Hidalgo and Klinger (2007), the following Logit model is constructed to investigate whether and to what extent technology upgrading depends on the advantage of technological capability endowment. The specific design is as follows:

TCA_dumrepresents whether the regional technology has a comparative advantage, the specific calculation method is shown in formula (2) in the third part of this paper. Because whether a technology achieves the upgrading of comparative advantage is often affected by the previous period, the two core explanatory variables (TCA and TC) in the model are taken with a lag of one period.
The above model can isolate the effect of technological capability on the change of technological comparative advantage(Hidalgo and Klinger, 2007). Specifically, if the technologyihas comparative advantage in the period t−1, (1−TCAi,c,t−1)×TCi,c,t−1 is zero, α2 reflects the degree of influence of the technology innovation ability with comparative advantage in the previous period on the technological comparative advantage in the current period . On the contrary, if the technology i does not have a comparative advantage in the period t−1, TCAi,c,t−1×TCi,c,t−1 is zero, α3 reflects the degree of influence of the technological capability that does not have a comparative advantage in the previous period on the comparative advantage of the next period. Therefore, in this case, α2 reflects the role of technological capability in maintaining the comparative advantage of a certain technology in a region, and α3 reflects the role of technological capability in breaking the role of non-dominant technology in a region, that is, the role of technological innovation and upgrading. ηc and θt represent fixed effects by region and year, respectively. CVs represents the control variables, which are the same as the benchmark model.εis the disturbance term.
The regression results are shown in Table 11. The results in column (1) show that the coefficient of TCAis significantly positive, which is consistent with the theoretical expectation. While the coefficient of TCA×TCis positive but not significant, the coefficient of (1−TCA)×TC is 0.7871 and significantly positive at the 1% confidence level. Compared with the size of the regression coefficients, α3 is greater than α2, which indicates that the capability endowment advantage plays a greater leading role in promoting technology upgrading. In order to ensure the credibility of the empirical results, we use the Probit model for regression again in column (2), and the sign and significance of the regression coefficient is basically consistent with those in column (1). The coefficient of TCA×TCbecomes significant from the non-significant in column (1), but its coefficient value is still less than that in column (1).
Influence of technological capability on the change of technological comparative advantage.
Further, we conduct heterogeneity test according to different periods, and the regression results are reported in columns (3) - (5) of Table 8. It can be seen that the coefficient of TCA is significantly greater than 0 in each period, and the effect shows a trend of significant enhancement. Compared with the coefficient of different periods, it can be found that in the early period of the sample (2001-2005),α2is greater than α3. During the period of China's accession to the WTO, it relied on the existing endowment advantages to achieve opening-up and thus obtain rapid economic growth. In the middle period of the sample (2006-2010), the difference between the α2and α3 is small, but in the late period of the sample (2011-2015), α3 is greater than α2. In this stage, the momentum of economic growth was weakened by relying solely on the original technology capability endowment. The government needs to take the initiative to readjust and deploy the capacity endowment resources on the basis of the original comparative advantages, so as to be more conducive to the realization of innovation in the field of higher value-added technology. In other words, the traction of technological upgrading caused by technological capability is greater.
The above conclusions show that the accumulation of technological capability plays a dual role of “leading the development of technological comparative advantage” and “maintaining the existing advantageous technology (or preventing the decline of the existing advantageous technology)” in China's technological upgrading, but the former plays a greater role than the latter. Technological capability is conducive to the release of regional limited resources from the existing comparative advantage of the technology field, so that the emerging technology field gather enough ability endowment, conducive to the promotion of technological innovation and breakthrough development, conducive to the formation of new technology-intensive industries, and finally realize the technology upgrading and industrial structure transformation. Furthermore, in order to verify that technological capabilities have a direct effect on the formation of new technological advantages, in this paper, the explanatory variable is replaced with the relative value of the number of new and old technological advantages in a certain field (TCNN/O). Column (6) of Table 11 shows the regression results. The results show that the regression coefficient of this variable is significantly positive at the 1% level, indicating that there is a close and stable relationship between technological capabilities and the upgradding of technological advantages. From a theoretical perspective, the improvement of regional technological capabilities can enable them to identify and absorb the advantages of new technologies more efficiently, thereby promoting the application and popularization of new technologies.Therefore, combining the above analysis, hypothesis 3 can be verified.
In the above model, the explanatory variable is a binary variable composed of 0 and 1. In order to ensure the validity of the empirical results of the model, we directly use the “revealed” technology comparative advantage(TCA) value of any technology in the region to replace the binary variable as the explained variable, and further establish the regression model:

If the coefficient of TCi,c,t−1 in the model is positive, it indicates that there is a positive correlation between the comparative advantages of technology and the local technological capability, indicating that the technological capability endowment plays a positive role in the technological upgrading.
Table 12 shows the impact of technological capability on technological comparative advantage, where column (2) is the result of adding control variables. It can be seen that after using TCA as the explained variable, the coefficient of TC is significantly positive, which further explains the positive impact of technological capability improvement on technological upgrading and the change of technological comparative advantage, thus indirectly verifying the influence mechanism of technology upgrading effect.
Industrial structure diversification effectWe have verified the leading role of technological capability in China's regional technological upgrading, and we can infer that the improvement of “local capability” will inevitably have an impact on the regional industrial structure, especially the degree of diversity. Generally speaking, if the region has a more diversified industrial structure, then the technology formed by external links will be more likely to be related to the local area, which is conducive to the integration and absorption of external knowledge. However, with the improvement of the diversity of industrial structure, if the industrial technology structure in the region is relatively low or even relatively scattered, then the region may not be able to focus on a few core industries, which is not conducive to enterprise innovation or regional economic growth. In order to verify whether technological capability can affect regional economic growth by improving the diversity of industrial structure, we set up the following econometric model on the basis of the benchmark model:


According to existing studies (Sun and Chai, 2012), industrial structure diversity (Str) can be divided into “related diversification” (rv) and “unrelated diversification” (uv) according to the following formula:
Where, Sindicates the category department, xindicates the subcategory department. InPS=∑x∈SPx, Px represents the proportion of employment in a certain industry in the total employment in a certain region. Hwrepresents the diversification entropy index of a major sector in a certain region, PSrepresents the proportion of employment in this major sector in the overall employment, ∑S=1SPSHwrepresents the sum of the product of diversification entropy index (Hw) in a major sector and the share of this sector. This index reflects the diversification degree of subdivided industries within a major sector that is more industry-related, and reflects the related diversification of industrial structure (rv);HB represents the diversification entropy index among major sectors in a certain region, which reflects the diversification level of sectors with relatively weak industrial correlation, that is, the unrelated diversification of industrial structure (uv). Through the above methods, we can decompose the diversification of industrial structure into related diversification and unrelated diversification, and substitute them into the econometric regression model (11) and (12) respectively.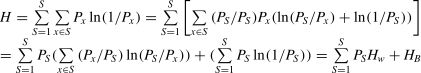
Table 13 shows the test results of the influence channels of technological capability on regional economic growth. Column (1) of Table 13 is column (4) of Table 2, reflecting the significant contribution of localization capabilities to economic growth. In column (2), we take this intermediary variable rvas the explained variable, and it can be found that the improvement of TC promotes the improvement of related diversification of regional industrial structure. Meanwhile, in column (3), we add TC and rv at the same time, and the results show that the coefficient value of the variable is slightly reduced, and the significance level is also decreased compared with that of the variable in column (1) without adding. Therefore, we can basically judge that the improvement of technological capability will improve the diversification level of regional industrial structure, and thus promote the economic growth of the region.
Influencing mechanisms of technological capability on industrial structure diversification.
By the same logic, we can examine the mechanism of uncorrelated diversification (uv) of industrial structure. As can be seen from column (4), although the estimated coefficient of TCis positive, it is not significant, that is, the improvement of technological capability has no obvious effect on the improvement of the unrelated diversification of industrial structure. If TCand uv are added to column (5) at the same time, it can be found that the size and significance level of the estimated coefficient are not much different from those in column (1). In addition, the impact of uncorrelated diversification on economic growth is significantly negative, which indicates that uncorrelated diversification does not play a mechanism role in the economic growth effect of technological capability. Based on the above analysis, hypothesis 4 can be verified.
Knowledge spillover effectIn the theoretical analysis presented above, we explain that regions with a high level of technological capability can foster technology diffusion through industry-university-research cooperation, patent sharing, and other means. This process breaks down knowledge barriers, facilitates the upgrading of traditional industries, and the emergence of new industries, ultimately driving economic growth. The subsequent section will empirically explore how technological capability can stimulate regional economic growth by enhancing the knowledge spillover effect. In recent years, China's technology market transactions have been pivotal in supporting the transformation and upgrading of enterprises and the development of emerging industries. This essentially reflects the intensity of knowledge spillover. Utilizing technology transaction data, we measure the regional technological cooperation level (TCcoop) using the ratio “technology contract transaction volume (in ten thousand yuan) to regional GDP (in ten thousand yuan)”, and we gauge the regional knowledge transfer level (KTflow) by the ratio “technology exchange transaction activity (in number) to regional GDP (in hundred million yuan)”.
Table 14 shows the analysis results of econometric regression. The explained variable in column (1) is TCcoop. The estimated results show that the improvement of regional technological capability is conducive to improving the level of technological cooperation. In column (2), the explained variable is replaced with growth, and the two variables are added at the same time, it can be found that technological cooperation also has a significant positive effect on regional economic growth, which means that technological capability can affect economic growth by improving the level of regional technological cooperation(TCcoop). Furthermore, in column (3), we further focus on two major types of cooperation: technological cooperation between universities and enterprises (TCcoopUE) and technological cooperation among enterprises (TCcoopEE).We integrate them simultaneously into a regression model. We find that the coefficients of both TCcoopUEand TCcoopEE are significantly positive within the 1% confidence interval, and the coefficient of TCcoopUEis greater than that of TCcoopEE. This indicates that technological capability has a greater promoting effect on technological cooperation between universities and enterprises. Similarly, we can also find that knowledge transfer(KTflow) has a significant positive effect on regional economic growth.
Influencing mechanisms of technological capability on knowledge spillover.
In the aforementioned article, we verify that local technological capability may have a nonlinear effect on regional economic growth. In this section, we will concentrate on the factors that influence the impact of technological capability in driving economic growth, considering the two dimensions of “policy environment” and “market conditions”. This will allow us to explore methods for mitigating the marginal diminishing effect of technological capability. Overall, this study posits that the promotional effect of local technological capability on regional economic growth is moderated by both the policy environment and market conditions.
The policy environment profoundly influences the development and dissemination of local technological capabilities by way of institutional design and resource allocation. On one hand, it directly affects the accumulation and dissemination efficiency of technological capabilities through innovation incentive policies. On the other hand, policies shape the supportive conditions of the regional technological ecosystem via infrastructure investment and the establishment of technical standards. Furthermore, the strategic orientation of policies towards emerging technology fields can steer technological capabilities towards areas with high growth potential, thereby forming structural competitive advantages. In addition to the factors of the policy environment, market conditions can also dynamically regulate the efficiency of transforming technological capabilities into economic growth through mechanisms such as supply and demand matching and competitive selection. Mature market mechanisms can guide technological resources to be allocated to high-value-added sectors through price signals, while sufficient market competition compels enterprises to accelerate technological iteration and enhance innovation efficiency. In empirical research, it is necessary to identify proxy variables for the policy environment and market conditions.
Innovation policy environment. Based on the classification of innovation policy tools, the paper classifies and quantifies the supply-oriented, demand-oriented and environment-oriented innovation policies, and uses the innovation policy intensity index to evaluate the innovation policy environment. Supply-oriented policies are mainly promoted by local governments through providing relevant incentive factors to promote innovation and product research and development, and can be subdivided into five policy tools according to different input factors: infrastructure, public service, scientific and technological support, human resources and capital investment. Demand-oriented policies are mainly adopted by local governments to ensure the industrialization of regional innovation achievements by stabilizing the market of new technologies and new products, which can be divided into four policy tools: government procurement, government outsourcing, trade control and overseas institution management. Environmental policies provide local governments with favorable regional policy environment to indirectly guide regional innovation and development, which can be divided into four policy tools: financial support, tax incentives, regulatory control and strategic measures. Then, as shown in Table 15, according to the regional administrative power structure, policy type, innovation policy improvement degree and influence effectiveness, the strength and effectiveness of regional innovation policy are assigned by 5-point system.
Quantitative assignment standard of regional innovation policy strength and effectiveness.
We classify and compare regional innovation policies by examining their tools and methods, identifying the key differentiators for quantitative analysis. We then calculate the intensity and effectiveness of each policy, multiply these by the weight of the main content of each innovation policy, and aggregate these to determine the overall intensity of regional innovation policies:
Where, TPGi denotes the policy intensity; Uk represents the weight of the main content of the first policy; Gij denotes the score of the innovation policy intensity; Pij represents the innovation policy effectiveness score.
Market conditions. The Fan Gang Marketization Index is a provincial-level marketization process evaluation system built by a team of the National Economic Research Institute (NERI) led by economist Professor Fan Gang, aiming to quantify the progress and differences of marketization reforms across Chinese provinces. The index has been published regularly since 2000 and has become an important reference tool for studying China's regional economic reform, resource allocation efficiency and institutional environment. Therefore, this paper uses the index as a proxy variable for market conditions in various regions.
In this paper, the interaction between policy environment or market conditions and technological capability is added to verify how the above two factors influence economic growth driven by technological capability. Considering that the regulatory effect of policy environment and market conditions may also have a time lag, we also add the lag first-order term. Table 16 presents the results of regression. The coefficients of the interaction terms in the columns (1) and (2) are 0.5216 and 1.4127, respectively, and both are significantly positive at the 1% confidence level, which indicates that from a single dimension, the local regional policy environment and market conditions can enhance the promoting effect. This also provides some solutions for how to reduce the marginal diminishing effect of technological capability on growth. Finally, in order to verify whether there is a certain complementary effect, that is, whether they jointly enhance the promoting effect, we construct a triple interaction term in the column (3), and focus on its coefficient. By comparing the double interaction terms, we can find that the coefficient of the triple interaction term is not only significantly positive at the 1% confidence level, but also greater than the coefficients of the double interaction term respectively, which indicates that the policy environment and market conditions can not only play a separate regulating role, but also have a two-way enabling role. If the region can enhance the synergies between the two factor, the enhancement effect of technological capability on economic growth will also be significantly enhanced.
The dual regulating effect of policy environment and market conditions.
The formation and diffusion of technological capability is a significant feature of regional innovation and has an important influence on promoting regional economic growth. From the perspective of capability, we examine the driving force for technological comparative advantage changes and industrial structure diversification and the impact on regional economic growth. This study breaks through the limitations of traditional macro-level research on technological capability. We integrate the core essence of product space theory, constructing a conceptual framework based on the organisational mode of technology and network correlation characteristics within a region. We analyse the concrete path of transforming technological capability into economic productivity, opening the black box regarding how technological capability drives regional economic growth. Based on the definition of product density, we construct an index reflecting the spatial correlation density of technology to measure technological capability using China’s regional data. The study empirically validates the mechanism and effect of technological capability on economic growth in developing countries, filling the gap in relevant empirical studies.
The main conclusions are fourfold. (1) Technological capability positively promotes regional growth but exhibits certain non-linear characteristics. As technological capability improves, its marginal effect on economic growth diminishes. (2) The economic growth effect of technological capability is time-dynamic and exhibits regional heterogeneity. (3) Technological capability primarily fosters regional economic growth through technological upgrading, industrial diversification and knowledge spillover mechanisms. (4) The promotional effect of local technological capability on regional economic growth is moderated by the policy environment and market conditions.
The conclusions of this study deepen the understanding of regional development theory on technology path dependence and breakthrough mechanisms, revealing that technological capability is the core driving force of regional economic evolution and reconstructs the formation logic of technological comparative advantage through the dynamic balance of structure upgrading and path maintenance. Theoretically, this study overcomes the traditional product space theory’s single focus on material products and incorporates the endogenous evolution of technological spatial structure into the analytical framework. The results confirm the possibility of path creation by technological capability accumulation promoting technological transition, industrial diversification and knowledge spillover, providing a new perspective for explaining how lagging regions can break the low-end lock-in. The results also have policy implications for developing countries to achieve sustained growth through technological spatial structural transformation. Such conclusions highlight differentiated policy priorities. For late-developing regions trapped in low-end manufacturing, targeted investment in technological infrastructure and cross-border knowledge networks could accelerate capability accumulation and industrial diversification. In contrast, emerging economies facing middle-income traps should balance path maintenance in mature industries and structure upgrading in strategic new sectors could avoid comparative advantage lock-in. These insights offer actionable guidelines for policymakers to tailor strategies according to local technological endowment stages.
When facing technology path dependence, local governments and enterprises can take the following measures. At the government level, the first recommendation is to establish a dynamic technology space monitoring system. While such a system can identify core and peripheral areas of technology density, implementation is challenged by local governments’ limited data integration and technical analysis skills, which may impede mapping and cluster identification. Facing fiscal constraints, we advise prioritising innovation support using existing and adjacent technologies over blanket high-tech investments. Local governments should develop proximity assessment tools and strategically allocate resources to sectors closely related to existing clusters. Short-term policies such as targeted subsidies can quickly stimulate innovation, while long-term strategies such as partnering with research institutions for capacity building and building technology diffusion infrastructure can sustain regional innovation capabilities, addressing administrative and resource limitations. Second, we recommend implementing differentiated technology capability cultivation strategies. Developed regions should concentrate on cutting-edge technological breakthroughs to sustain upgrade effects, whereas less-developed regions should enhance basic technology networks’ density to overcome structural sparsity. Third, industrial policies should guide collaborative technology chain–industrial chain evolution and facilitate industrial clusters’ upgrading from mere aggregation to knowledge networking using technology correlation evaluation tools. Investment promotion should prioritise introducing enterprises that align with the local technology network and encourage cross-industry technology integration via innovation alliances. Finally, the policy environment and market conditions must complement one another. The government should actively compensate for the market’s deficiency in long-term technology investment through targeted policies and leverage market mechanisms to identify sustainable innovation directions via enterprise demand and competition. At the enterprise level, firms should actively respond to the government’s policy orientation, proactively integrate into the regional technology network, strengthen cooperation with upstream and downstream enterprises and research institutions, break through path dependence with cross-industry technology integration and enhance internal innovation capabilities and market competitiveness.
This study illuminates the connection between technological capabilities and regional economic growth; however, it is important to recognise three notable limitations. First, the use of patent-based metrics from a single country cannot fully account for the dimensions of tacit knowledge and the dynamics of cross-border technology diffusion. Future research could enhance this framework by incorporating multinational patent databases, firm-level innovation surveys and/or technology transfer datasets, particularly to explore the pathways of technology adoption and leapfrogging in less-developed regions. In addition, if higher-quality data after 2015 can be obtained, we will extend the research time span to the latest year to enhance the timeliness of the research. Second, the macrostructural approach does not include the micro-level interactions between corporate innovation strategies, university–industry collaborations and knowledge spillover mechanisms. Therefore, subsequent studies should adopt mixed-methods approaches that combine corporate case studies with innovation network analytics to investigate the evolutionary paths of technology dissemination and resource complementarity. Finally, the broad policy implications of this study necessitate contextual refinement. Comparative analyses of market-driven versus state-guided institutional ecosystems could employ quasi-natural experiments such as staggered patent subsidy reforms to quantify the marginal effects of fiscal incentives on capability enhancement.
Financial supportThis work is supported by the National Social Science Foundation Youth Project (24CJY010); Basic Research Fund of Jiangsu Province (Soft Science Research) Project (BR2024036); Youth Project of Jiangsu Social Science Foundation (23EYC002); General Project of Philosophy and Social Science Research in Jiangsu Universities (2023SJYB0277).
CRediT authorship contribution statementYixin Dai: Formal analysis, Data curation, Conceptualization. Yuanhong Hu: Methodology, Investigation. Manzoor Ahmad: Resources, Project administration. Yunting Mou: Writing – review & editing, Funding acquisition.
The authors declare that they have no known competing financial interests or personal relationships that could have appeared to influence the work reported in this paper.
This manuscript has been professionally edited for language correctness, including grammar, spelling, sentence structure, and academic writing style. The editorial service was provided by Elsevier Language Editing Services, a certified language service provider with expertise in scholarly publishing. The editing process focused solely on improving the linguistic quality of the text and did not alter the original scientific content or research findings. This statement is provided to confirm that the manuscript meets the language requirements of international academic journals.
This paper was presented at ACIEK (Winter) -IMIP 2024 and received an Excellent Paper Award. We have revised in accordance with the comments of the reviewers.