
The literature on satisfaction measurement features several models for establishing the relationship between expectations, service performance and satisfaction. The set of measures used includes the Importance-Performance Analysis (IPA), expectation disconfirmation and the satisfaction determinants model. This paper presents a comparison of different measurement models on the basis of a sample of 2900 health services users. The comparison shows that the expectations disconfirmation model allows to establish significant correlations between service attributes and general satisfaction, yet it warrants an adjustment of data distribution to identify the attributes where confirmation and disconfirmation are presented – when not due to chance. On the other hand, the direct effect approach allows to identify predictor attributes of satisfaction better than the other models do, whereas the importance – performance model is easier to implement but can generate erroneous conclusions about the service attributes that generate satisfaction.
En la literatura sobre medición de la satisfacción se han identificado varios modelos para establecer la relación entre expectativas, desempeño del servicio y satisfacción. Dentro del conjunto de medidas que se han empleado se encuentran los análisis de importancia-desempeño (IPA), el modelo de disconfirmación de las expectativas y el de determinantes de la satisfacción. El presente estudio presenta una comparación de distintos modelos de medida a partir de una muestra de 2900 usuarios de servicios de salud. La comparación muestra que el modelo de disconfirmación de expectativas permite establecer correlaciones significativas entre los atributos del servicio y la satisfacción general, pero requiere un ajuste de la distribución de los datos para identificar los atributos donde se presentan confirmación y disconfirmación, no debida al azar; de otra parte, el modelo de efectos directos permite identificar los atributos predictores de la satisfacción mejor que los otros modelos, mientras que el modelo de importancia-desempeño es el más sencillo de aplicar, pero puede generar conclusiones erróneas acerca de los atributos del servicio que generan satisfacción.
Measuring user satisfaction is a subject of extensive debate in contemporary literature on quality of health services (Al-Abri & Al-Balushi, 2014). The companies providing services, as well as those responsible for health sector policies, regard satisfaction as a way to know the point of view of users in order to identify critical conditions of improvement, differentiation or analysis opportunities of the health system. In so doing, satisfaction studies become an input to quality assurance in the provision of services. The importance of user satisfaction is rooted in the ability of this response to evidence the compliance or noncompliance with a service performance standard, while revealing an emotional state of pleasure or displeasure (Mustaffa, Hamid, Bing, & Rahman, 2016; Oliver, 1993). This emotional state contributes to the formation of attitudes toward the purchase, repurchase, and loyalty (Lei & Jolibert, 2012), as well as to the allocation of expenditure budgets in households (Fornell, Rust, & Dekimpe, 2010). In addition, the judgments made in the process of formation of consumer satisfaction/dissatisfaction have an impact on the patient – health personnel interaction (Ha & Longnecker, 2010).
The review of the literature on satisfaction measurement indicates that there is no consensus about the best methodological routes to assess a health system. However, there is extensive work where different methodologies and measurement models have been tested. In order to study satisfaction, it is necessary to build the measurement mechanism for the specific case, seeking to have the scope and the generality needed, or the detail otherwise required, in accordance with the appropriate context. Three aspects stand out in the evaluation of attributes to establish satisfaction with the health service: (a) whether measures of specific episodes or summative events will be used (Ariely & Carmon, 2000); (b) whether it is preferable to ask the consumer to evaluate specific service attributes (e.g. waiting times for medical appointments), or rather to ask consumers to comment of general characteristics (e.g. attention, safety, reliability, etc.) in questionnaires such as the SERVQUAL (Li et al., 2015); and (c) whether the items and measurement scales shall use a direct measure of satisfaction or measures of expectation and perceived service performance, in addition, to establish the discrepancy and the satisfaction (Matzler, Bailom, Hinterhuber, Renzl, & Pichler, 2004).
Decisions regarding satisfaction measurement become more complex due to the characteristics of health services. For example, every person is exposed to health care since childhood; thus, it is difficult to determine whether a response corresponds to a single episode that the user experienced, to an attitude formed by previous experiences or to a social norm anchored in the response (Ariely & Carmon, 2000). In addition, health services can be provided by different companies simultaneously, so it is difficult to identify which of the stakeholders in the process can be attributed to the satisfaction/dissatisfaction response and the overlapping level of the measures. Likewise, the person may have expectations generated by their own conditions or by conditions of the service, which may affect their judgment, regardless of the quality of the service provider (Gok & Sezen, 2013). On the other hand, the criteria used to evaluate service quality and user satisfaction by the administrators and promoters of quality policies is based on the importance they give to different attributes of the service. These criteria are not unique or homogeneous, so different evaluation mechanisms are necessary to establish the best quality and satisfaction measures for the implementation of health care services (Sadeh, 2017). In light of the above, it is necessary to evaluate the ability of different measurement models to reflect satisfaction indicators that respond to features of interest in health services to identify and evaluate the relevant factors that must be borne in mind for policy-makers and managers to enhance the quality of health services and scale-up thereof.
Expectations, perceived performance and satisfactionSatisfaction measurement is carried out either by using overall measures through a single response on the general level of satisfaction, or by evaluating particular aspects such as the attributes or events on which the user could have positive or negative reactions to judge the service. However, in both cases, when taking the isolated measure of satisfaction, it is not possible to adequately reflect the psychological process that leads to that (Oliver, 1993). Thus, to understand what determines the satisfaction response, it is necessary to measure other related processes, the most common ones being the formation of expectations and attitudes toward the performance or perceived performance, as well as the gap between expectations and performance or expectation disconfirmation (Oliver, 1993).
Expectations regarding health services are important to consumers on their different roles as users, patients, beneficiaries or caregivers. Expectations are judgments about what can be expected in particular circumstances; these judgements are usually individually consistent with the expected averages in social processes (James, 2009). Due to the characteristics of the health services and prior experience, they can be anticipations on easily identifiable attributes such as waiting time, or abstractions about those attributes, as is the case of the staff quality or capacity. These expectations may also correspond to random predictions whenever there are no points of reference. Given this variability, expectations are related to the expected results of the service process, treatment by the staff, and even placebo effects in health processes (Colloca & Miller, 2011; Gonzalez Sáenz de Tejada et al., 2010). Given the anticipatory nature of expectations, the latter become standards for the expected implementation of the service and can be important predictors of both attitudes toward the performance of the health system and satisfaction (Bleich, Ozaltin, & Murray, 2009). This notion derives measures that contrast expectations with the perceived performance in order to determine satisfaction (James, 2009; Parasuraman, Zeithaml, & Berry, 1988). The gap between these two features is an indicator of service quality, besides conveying a history of customer satisfaction. Service quality is understood as a function of the differences between expectations and performance along the dimensions of quality (Parasuraman et al., 1988). The gap is studied in different models; one of them is expectation disconfirmation.
The expectation disconfirmation theory (EDT) indicates that the purchase effort generates knowledge and a degree of confidence in this knowledge, when the execution of the product fails to equal the expectation of the consumer, discomfort is created. In that case, the result of the purchase is poor regarding the effort allocated. However, if consumers interpret the provision of the service as being consistent with their expectations, they reduce the discrepancy (Anderson, 1973). Because there is previous experience with the services, the consumer adjusts its information on prior executions with respect to their expectations, increasing them whenever the expectations are poor and decreasing them when they are high (Anderson, 1973). The process results in an assimilation effect when common elements are emphasized which are precisely similar on the levels expected. It may also be a contrast effect, which consists in a tendency to exaggerate the discrepancy. The contrast effect usually occurs when the discrepancy is large enough to increase the perceived difference between the expectations and the service performance (Isac & Rusu, 2014).
This model can use expectation (E) and perception of performance (P) measures which are subtracted (P−E) to obtain the discrepancy or disconfirmation level. Measures can also be used through items that measure disconfirmation directly, by asking respondents to indicate how much of what was expected was actually fulfilled. Under the rationale of disconfirmation, a negative difference relates to negative disconfirmation, i.e. when the attribute is below the standard. Positive disconfirmation occurs when it is above the standard, and zero disconfirmation occurs when it is over the standard, this is simply a confirmation of the standard (Anderson, 1973; Oliver, 1993). Subsequently, the relationship between the disconfirmation and satisfaction is established, using correlations or regression methods. Disconfirmation measures are widely used as perceived quality indicators of service, these measures may help to establish hierarchical models of perceived quality or confirmatory models for the prediction of the attributes of greater relevance in the service (Lankton & McKnight, 2012).
In another approach, the measurement of satisfaction can be derived from an adaptation made of the model of importance performance analysis (IPA), as proposed by Martilla and James (1977). The model asks for each of service attributes selected by the health service provider, according to the criteria defined internally or those suggested by the quality policies demanded by the respective government. The questions are organized in such a way as to obtain the importance averages and the performance averages for each of the attributes presented. The resulting analyses of these two measures may be displayed graphically through a bi-dimensional array, divided into four quadrants. The first quadrant – high importance but low performance – displays the service attributes where concentrated work is needed. The second quadrant shows those attributes where implementation is excellent and the attribute is highly important. The third quadrant is the one where there is low implementation and low importance, this quadrant is called low-priority, and the fourth quadrant is a potential exaggeration, where there is an excellent execution but the importance of the attribute is low. The upper quadrants are considered for satisfaction analysis, while the lower quadrants denote indifference and dissatisfaction. In order to allow identifying the middle position to build the division of the array the median of each measure can also be used. Applicability of this analysis for marketing strategies varies in accordance with the quadrant (Piñeiro, Mallou, & Boubeta, 2006).
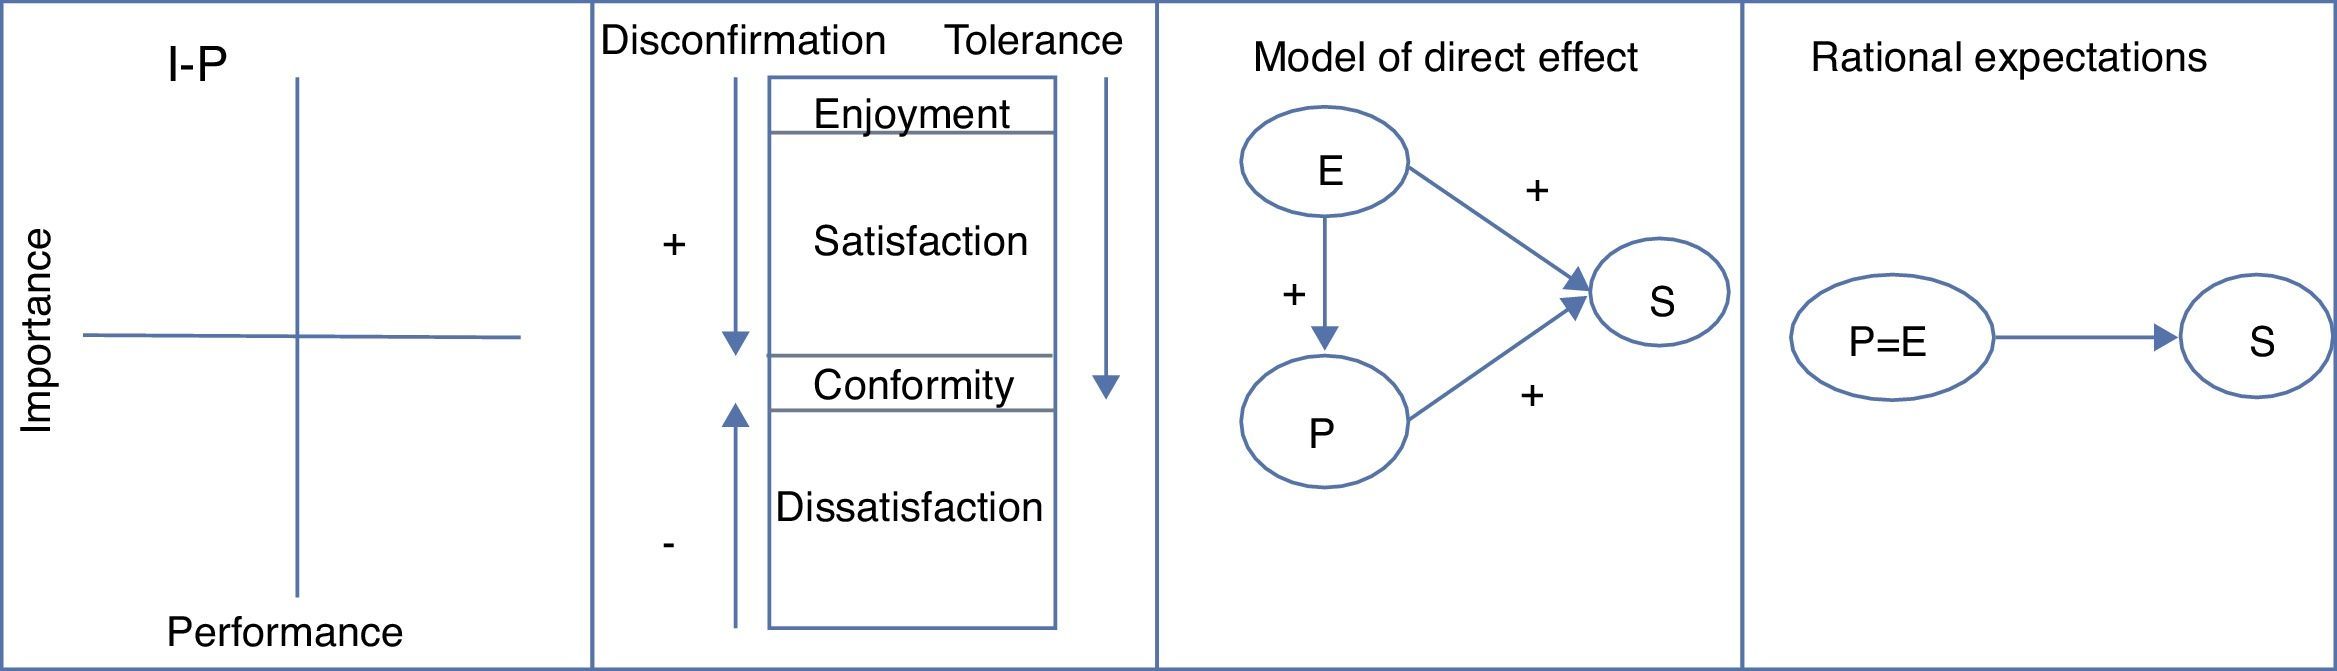
A third model of measures includes measurement models verified against the construct validity of both expectation and performance. The satisfaction is confirmed assessing what aspects make up these measures and then establishing how much satisfaction is predicted. These models allow to establish the determinants of satisfaction. To build the models, exploratory factor analysis is used to identify the measures that evaluate common aspects or factors of expectations, performance or satisfaction. Subsequently, confirmatory factor analysis is conducted. Finally, the predictive value of expectations and the performance or service quality in the satisfaction is established, through regression or covariance analysis. There are several models of this type; however, two of the main ones are the direct effect model – where the perceived satisfaction and the implementation are precedent of the satisfaction and have positive effects (Fornell, Johnson, Anderson & Bryant, 1996), and the model of rational expectations, wherein it is assumed that the perception of service quality is equal to the expectation and predicts the satisfaction directly (Johnson, Anderson, & Fornell, 1995). The summary of the four groups of most commonly used measures is presented in Fig. 1.

The previous models have been used individually in studies on health services; however, there is little literature that compares its measurement models to demonstrate the benefits as well as the disadvantages that should be considered by the managers and policy makers, when evaluating the attributes of perception of service quality in the users and the satisfaction. The health entities can benefit from better systems of measurement because it allows them to identify problems of service implementation in improvement processes and to identify critical attributes for scaling up services. This study aims to fill this gap by comparing these models.
MethodParticipantsA survey was conducted with participants of two cities of Colombia, Bogotá (1703) and Cali (1241), with a sample of 2954 people aged 15–80. The sampling design was multistage, with sampling stratified by city and cluster sampling by areas of residence. The sample size was adjusted in proportion to the population sizes, so that a sample of the different socioeconomic levels is obtained in each city by areas of residence. The sample share of low socioeconomic class was 42.3%, the middle class was 41.7% and the upper class was 6%, 53% females and 47% males.
DesignThe study was descriptive-correlational. A non-experimental cross-sectional design was used performing a single measurement of the variables studied. No manipulation of the variables was performed by the researchers.
InstrumentsExpectations were measured through twenty-eight (28) items that measured health service attributes. The items included were the result of a review of similar studies and the interviews with experts. Likert-type items were used for evaluating participants’ responses to each attribute, ranging from not important (0) to very important (5). In another section of the questionnaire, the same individuals were asked to respond in relation to the same attributes, how often they received the service the way they were expecting. The Likert-type items were used, ranging from never (0) to always (5). The choice of the measurement scales was performed considering recommendations for satisfaction measures, where the greater the number of options the greater reliability and validity – and including zero – the smaller the bias percentage, and absence of the characteristic is attributed (Pearse, 2011). The overall satisfaction measure was built from a confirmatory factor analysis (CFA) and the reliability analysis of the measurement scale. The overall satisfaction measure had a reliability of 96%, as per Cronbach's alpha. However, the result was non-summative upon conducting the additivity test, thereby making it necessary to raise the scores to the exponent of 2.84 so as to obtain the satisfaction overall score from the addition of the different items evaluated.
ProcedureThe first stage of the study was to identify service attributes that could be assessed as important for any user of health services. Studies of satisfaction with the service were reviewed, as were the rules on health and a catalog of rights in health and the survey of health quality published by the Ministry of Health of Colombia. The selected studies were those that considered dimensions of quality similar to those indicated by the quality area of the Ministry of Health of Colombia. Subsequently, interviews were conducted with three experts in health quality assurance of the quality department of the Ministry. The interviews allowed to identify the items that were closer to what the quality area expects from the service provided by health care providers, according to existing regulations and technical recommendations. The study was later applied in the selected communities (Table 1). Descriptive analyses were performed and then data were analyzed in accordance with each of the proposed models.
Comparison of importance and performance of the attributes of the health service.
| Attribute | Median importance | Median performance | Discrepancy (P−I) | Confirmation/disconfirmation (%) | Disconfirmation–satisfaction correlation |
|---|---|---|---|---|---|
| Negative disconfirmation | |||||
| B. Second opinion in the event that there are doubts about the diagnosis | 4.68 | 2.62 | −2.06** | 57 | 0.28** |
| D. Telephone/web information | 4.23 | 2.04 | −2.19** | 59 | 0.27** |
| E. Information in attention site | 4.45 | 2.57 | −1.88** | 53 | 0.29** |
| F. Quality rankings information | 4.18 | 1.89 | −2.28** | 61 | 0.23** |
| H. Direct access to specialist | 4.74 | 2.24 | −2.5** | 65 | 0.37** |
| I. Access to therapies in convenient hours | 4.72 | 2.71 | −2.01** | 56 | 0.41** |
| M. Medicines delivery | 4.79 | 2.79 | −2** | 57 | 0.26** |
| N. Prevention programs | 4.68 | 2.75 | −1.92** | 55 | 0.34** |
| O. Information on risks of disease by personal conditions | 4.71 | 3 | −1.71** | 50 | 0.32** |
| S. Immediate attention of emergencies | 4.82 | 2.4 | −2.41** | 65 | 0.39** |
| T. Information in site to complaints and claims | 4.6 | 2.58 | −2.03** | 56 | 0.30** |
| U. Written reply when there is denial of service | 4.57 | 2.03 | −2.54** | 65 | 0.26** |
| W. Service continuity and integrality | 4.78 | 3.23 | −1.55** | 48 | 0.44** |
| X. Timely information on the treatment | 4.79 | 3.35 | −1.44** | 43 | 0.44** |
| Y. Cost Information | 4.7 | 3.05 | −1.65** | 45 | 0.33** |
| AB. Response to PCC's | 4.69 | 2.59 | −2.1** | 58 | 0.34** |
| Confirmation | |||||
| A. Health status information | 4.8 | 3.57 | −1.23** | 63 | 0.36** |
| C. Access to medical records | 4.63 | 3.01 | −1.62** | 53 | 0.32** |
| G. Appointment with the same doctor | 4.65 | 3.03 | −1.62** | 50 | 0.35** |
| J. Services images/laboratories schedule convenience | 4.76 | 3.1 | −1.67** | 52 | 0.43** |
| K. Timely diagnosis | 4.79 | 3.23 | −1.56** | 54 | 0.41** |
| L. Equality of conditions in service provision | 4.75 | 3.22 | −1.53** | 55 | 0.41** |
| P. Administrative staff attention | 4.78 | 3.63 | −1.15** | 64 | 0.45** |
| Q. Nursing staff attention | 4.81 | 3.72 | −1.09** | 67 | 0.42** |
| R. Medical staff attention | 4.84 | 3.89 | −0.95** | 73 | 0.40** |
| V. Hygiene, safety and respect conditions | 4.78 | 3.69 | −1.1** | 66 | 0.39** |
| W. Service continuity and integrality | 4.78 | 3.23 | −1.55** | 51 | 0.44** |
| X. Timely information on the treatment | 4.79 | 3.35 | −1.44** | 55 | 0.44** |
| Y. Cost information | 4.7 | 3.05 | −1.65** | 53 | 0.33** |
| AA. Confidentiality of the clinical history | 4.73 | 3.79 | −0.93** | 72 | 0.27** |
In the case of IPA model, the data of each attribute was taken, averaged and then we built a scattered diagram to separate the quadrants. In the case of EDT, we performed the subtraction of the scores of each individual in their expectation with respect to the performance. To build conformity-dissatisfaction measure, we constructed the theoretical distribution for the scale of response through a uniform distribution and then this was compared to the empirical distribution through a Chi-square test. Subsequently, a correlation was established using the Pearson correlation coefficient with the general measure of satisfaction. For the performance of the predictive models of satisfaction, a confirmatory factor analysis was used with structural equations for each latent variable: expectations, perceived performance and satisfaction. The structural equations model (SEM) were carried out using AMOS v.23, using the maximum likelihood model (ML) with bootstrap, because the ML SEM has an ability to produce consistent parameter estimate even in the presence of non-normality.
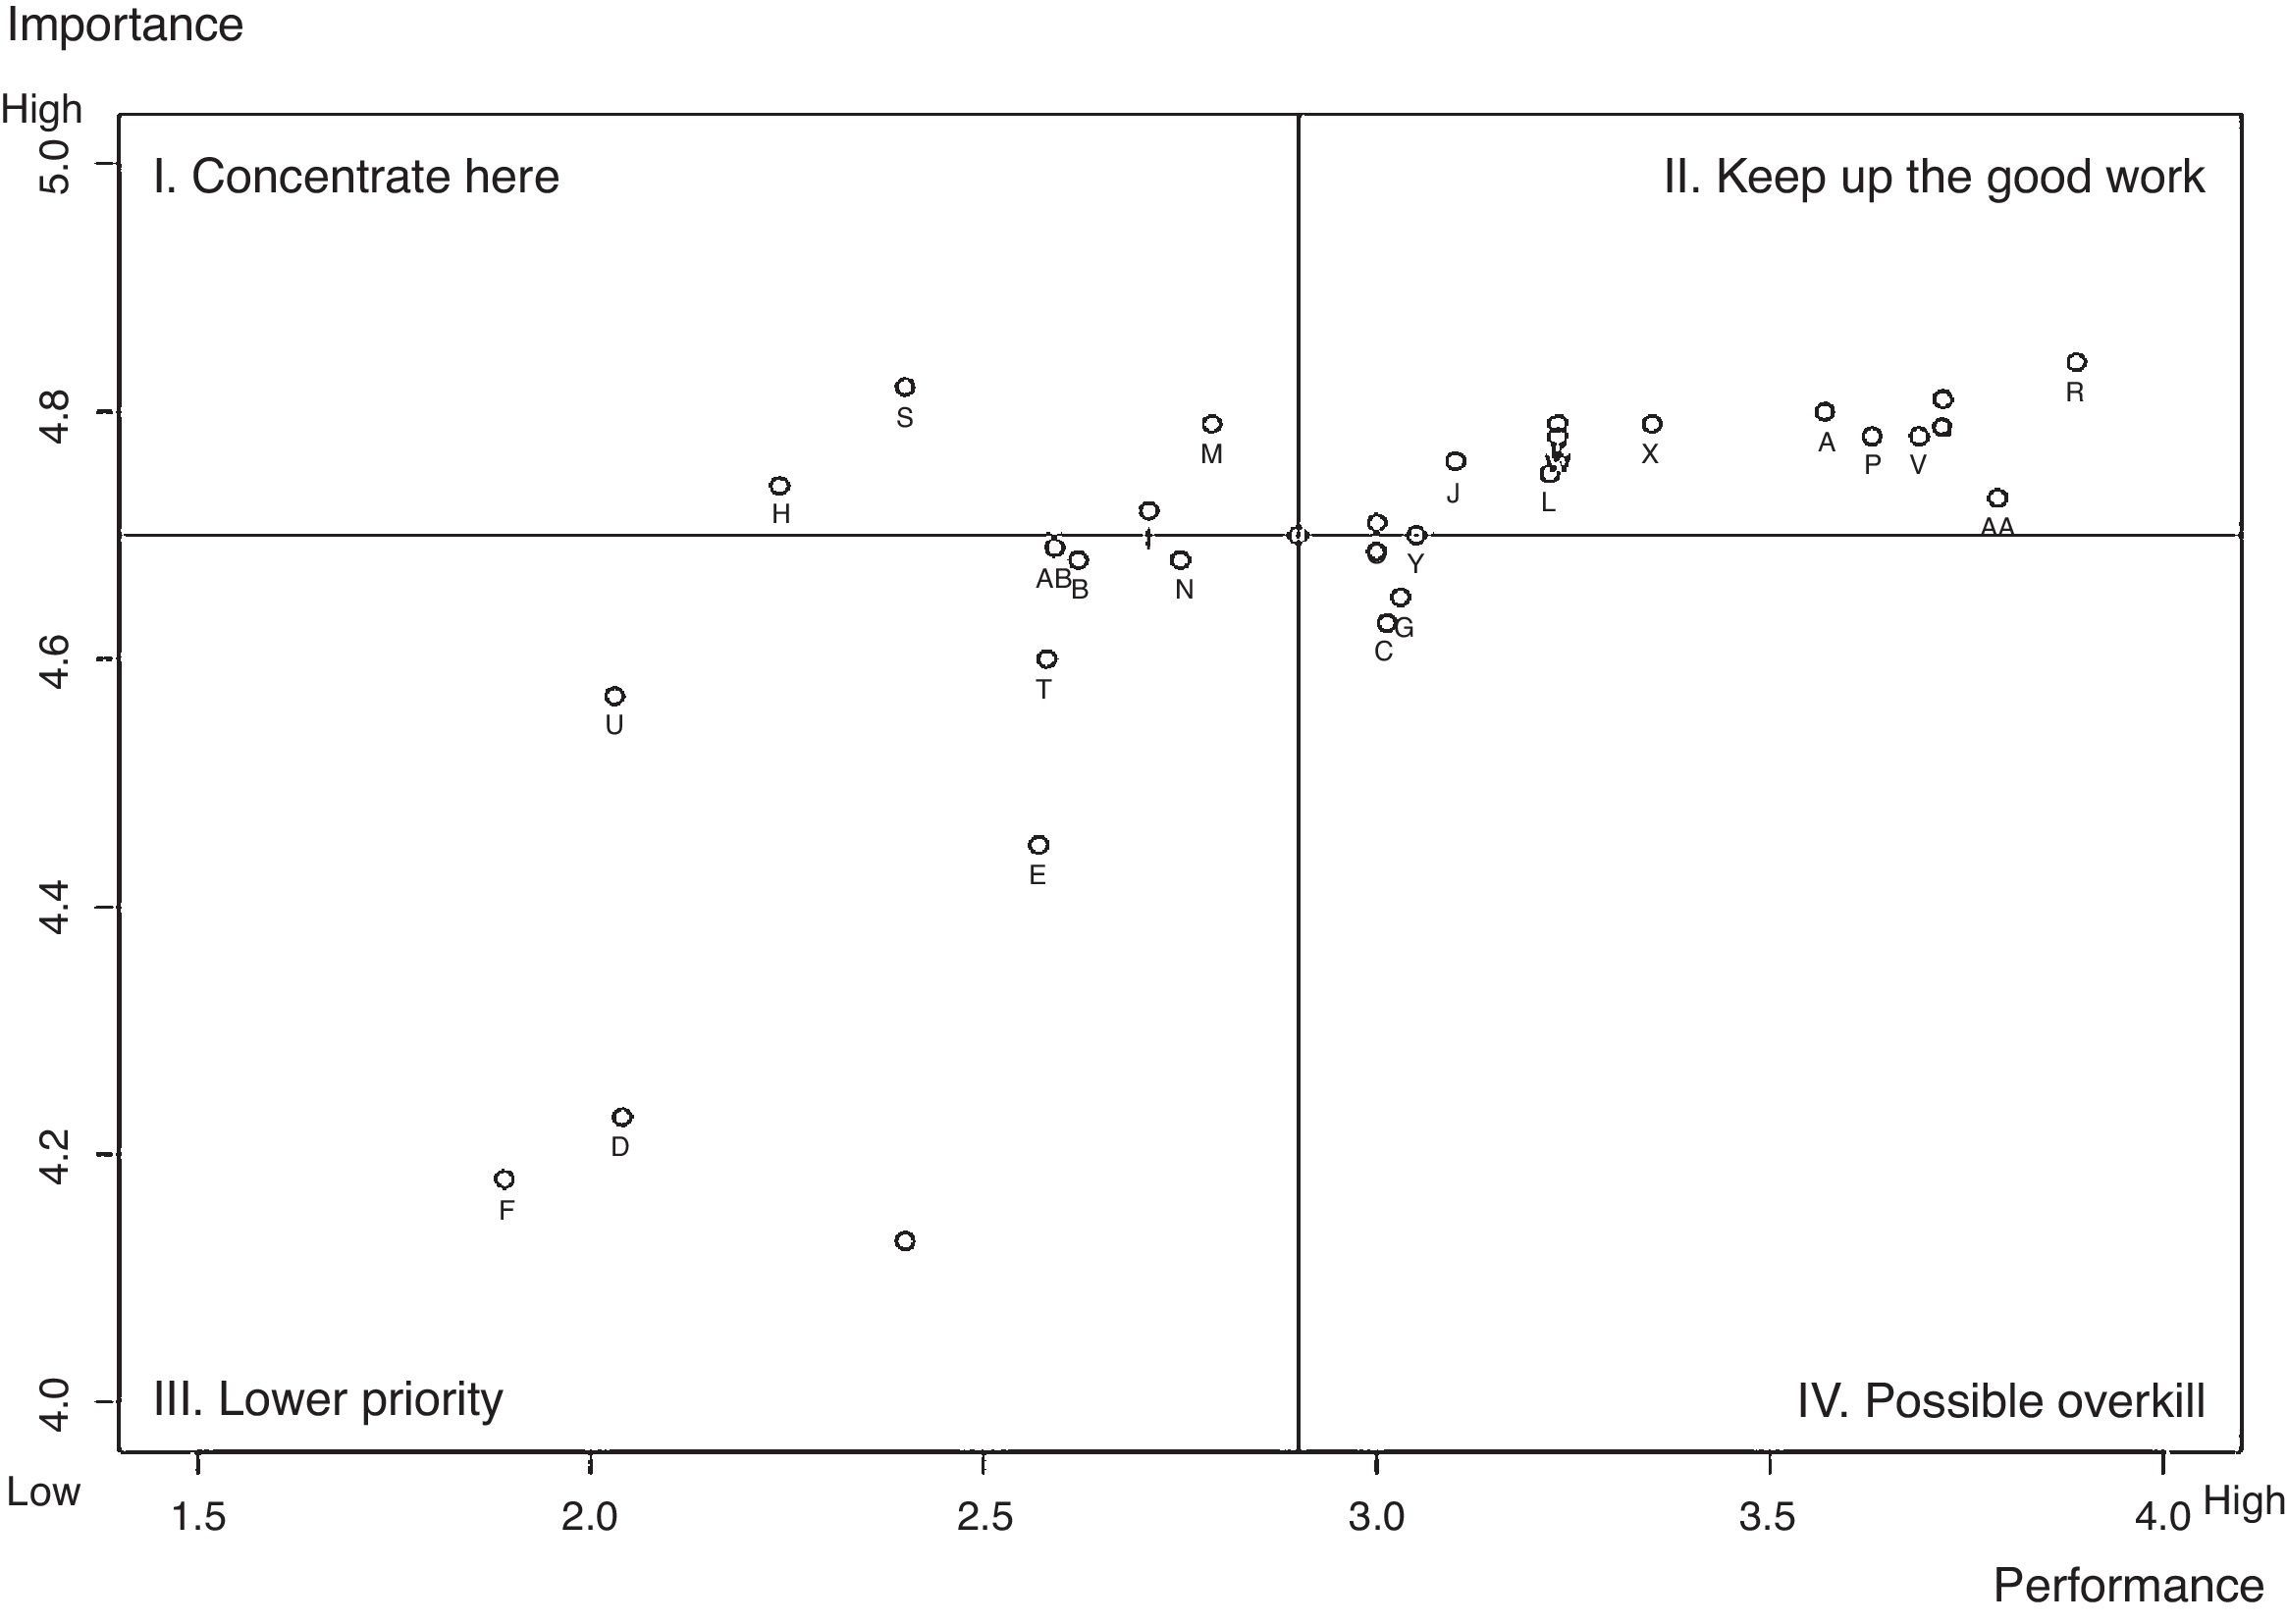
ResultsImportance performance analysisThe IPA is a simple analysis that allows to identify the attributes that require a greater effort to improve the health service (Huang, Wu, & Hsu, 2006). As shown in Table 1, when comparing the averages of importance and performance through a t-test for independent samples, in all cases there is a significant difference between what users expect with regard to what they identify as what they receive in the provision of the service. In all cases the differences were negative, indicating that the service performance was lower than expected in the measured attributes. The highest differences were found in the written explanation of the reasons for the denial of service (Discrepancy=−2.54), the possibility of direct access to specialists (Discrepancy=−2.5) and in the immediate attention of emergencies (Discrepancy=−2.41).
When creating the matrix to contrast the scores of importance and performance (Fig. 2), it can be observed that the health institutions would have to concentrate on improving in direct access to specialists, delivery of medicines and the immediate attention of emergencies (quadrant I). Similarly, they could improve their efforts to set appointments with the same doctor and access to medical records (quadrant III). The model would seem to reflect that there is satisfaction with the attributes that are located in the quadrants I and III, but this result is contradictory with the negative scores of the discrepancies.
Disconfirmation model
The discrepancy measures are indicators of expectation disconfirmation. Upon analyzing the discrepancies in Table 1, it can be observed at a first glance that there would be high negative disconfirmation, as all results are negative. However, in a more detailed examination, it can be found that discrepancies are distributed by percentage in the three groups of disconfirmation: positive, negative and confirmation. The latter case occurs when the difference is 0. When reviewing the results, there are some attributes in which we can observe more confirmation than disconfirmation, e.g. in the information of the state of health and in the consultation of medical records. However, the elements above appear in different quadrants in the IPA.
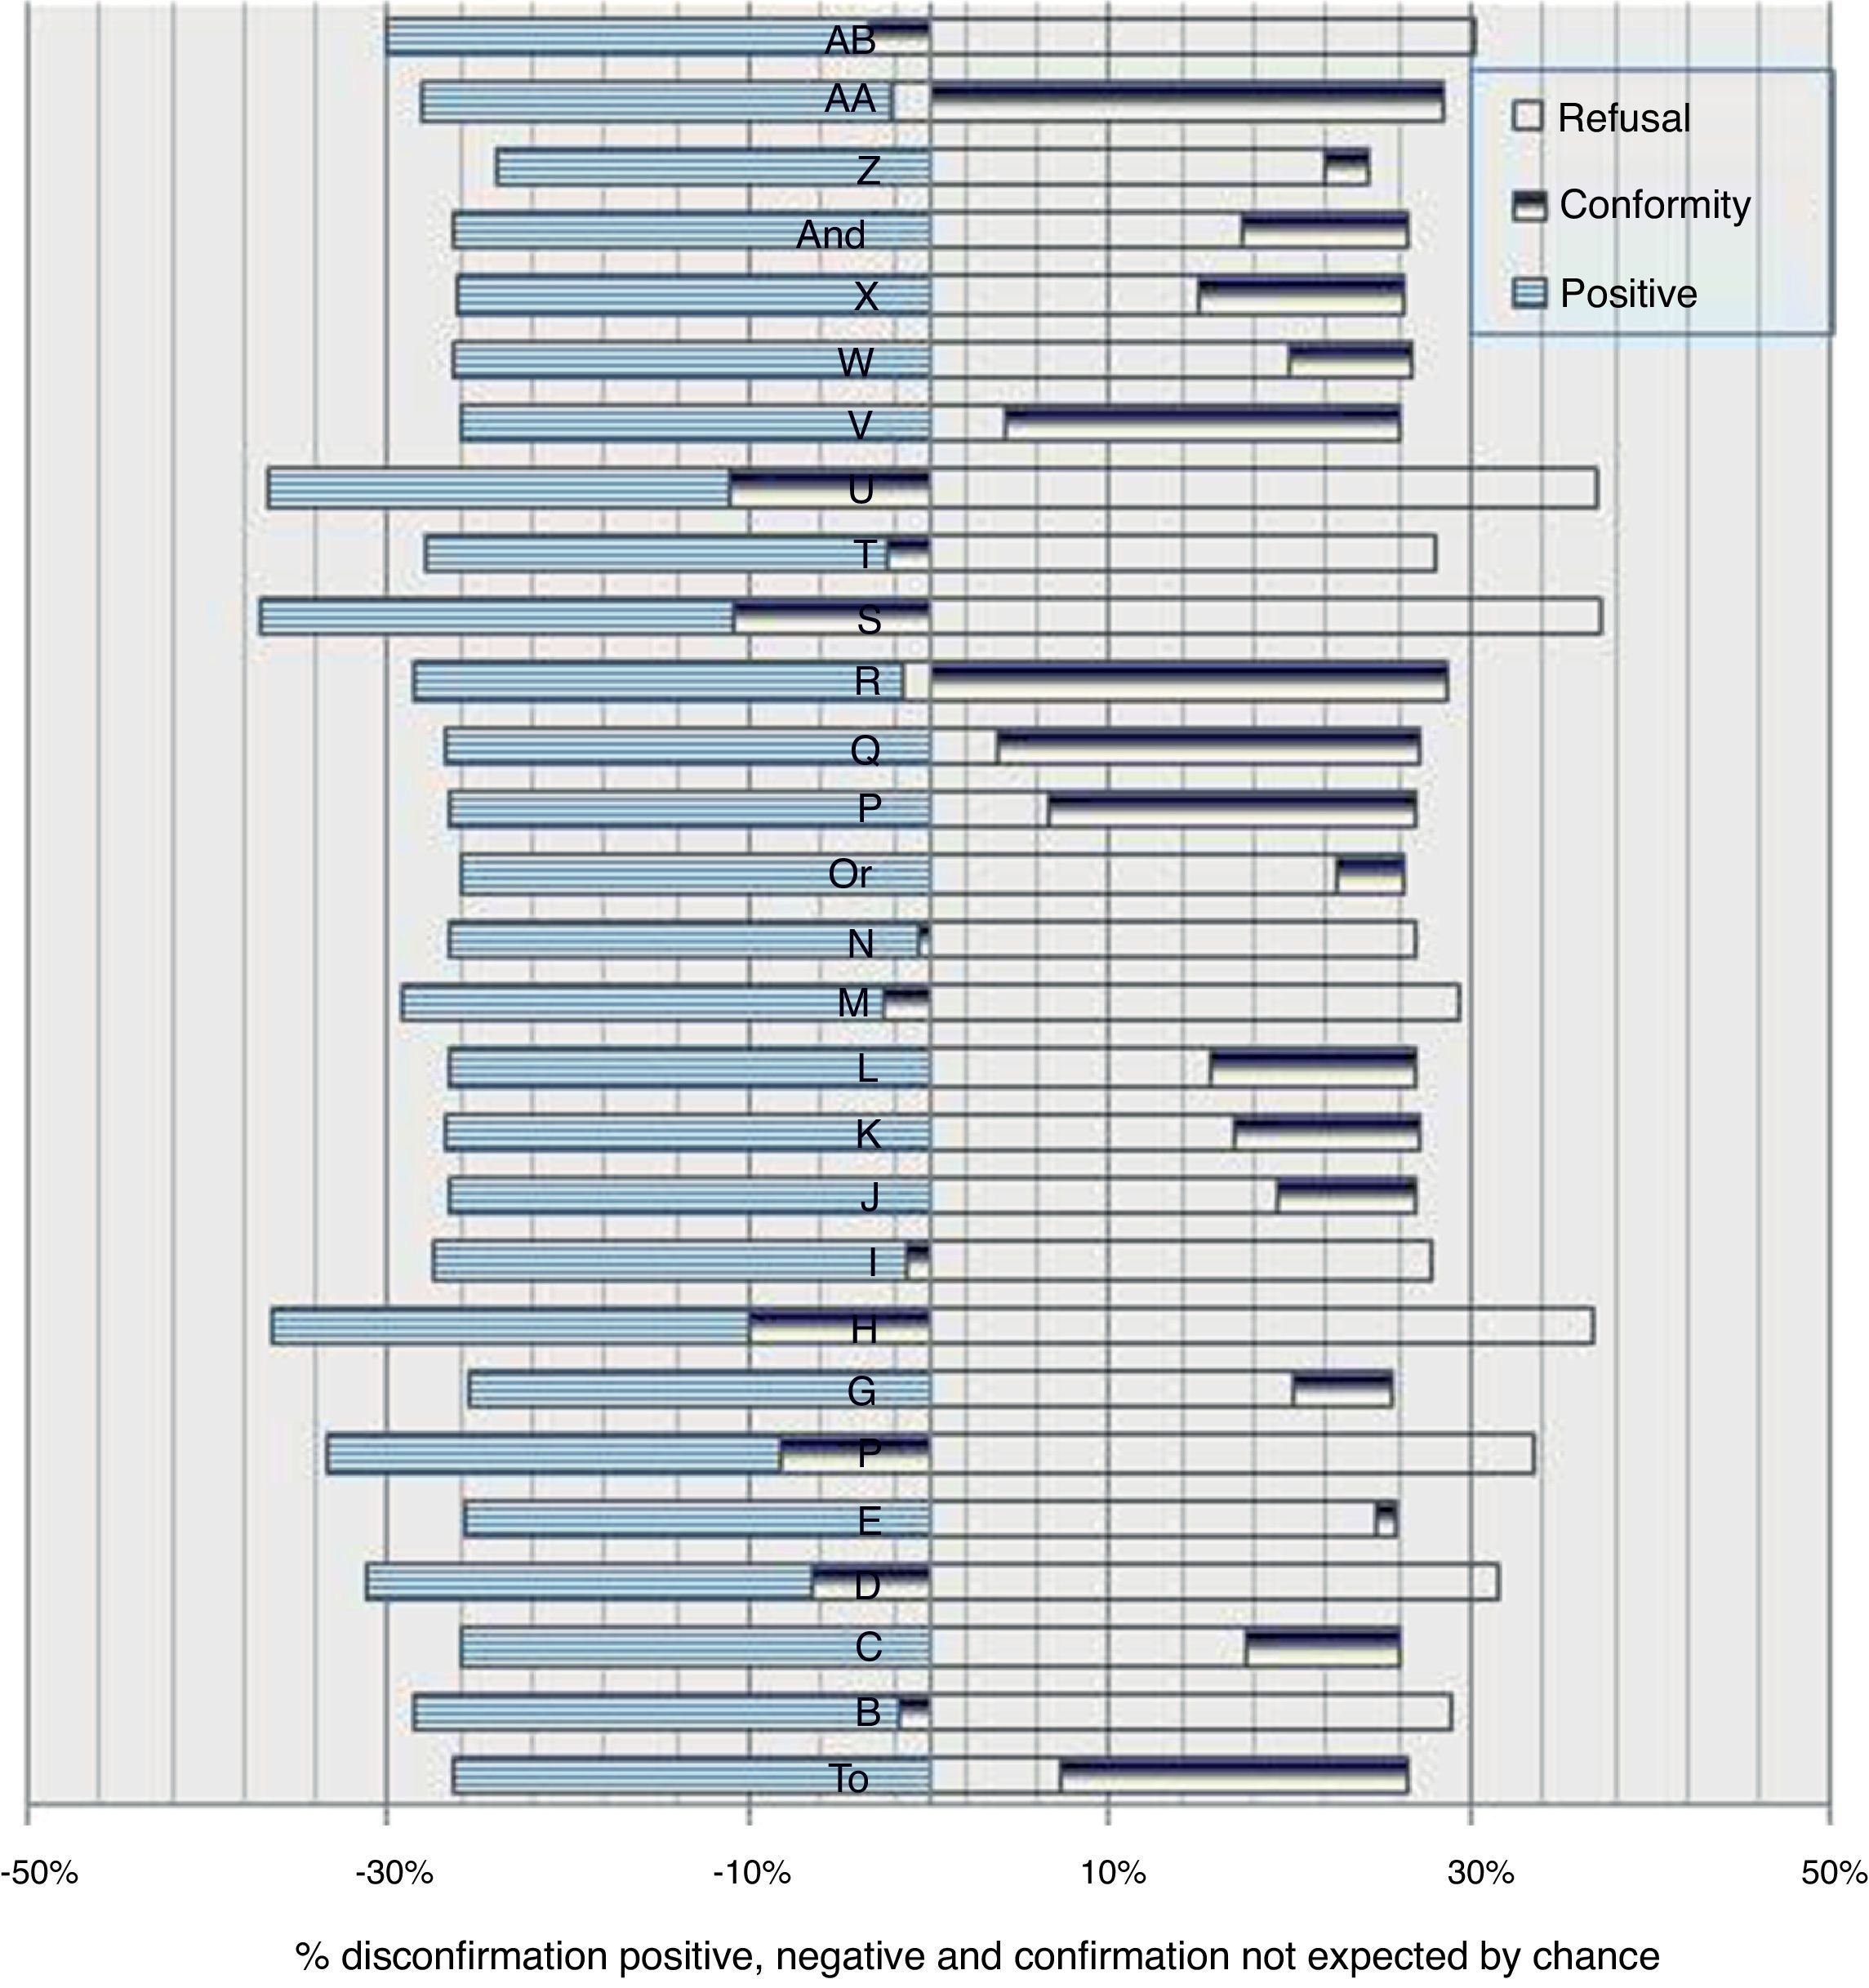
The percentage distribution study of the discrepancy responses does not allow determining whether conformation prevails over disconfirmation. For this reason, it was necessary to demonstrate whether these responses are above what one would expect for a response at random. To obtain such a hypothesis test, we conducted a theoretical distribution for the responses, considering the scale of measurement and a uniform distribution for each option. The resulting distribution shows negative disconfirmation when the scores are between −2 and −5 (28%) and positive disconfirmation between 2 and 5 (28%), if the responses were totally random, while the confirmation (scores between −1 and 1, including 0), will be the predominant response 45% of the times. If the values of negative or positive disconfirmation are larger than this percentage, the result really corresponds to the phenomenon of disconfirmation, rather than a random response. To test this idea is considering above a Chi-square goodness of fit test, this is applied for each attribute, taking the theoretical distribution as expected frequencies and the data of responses given by the subjects (Table 1) as observed frequencies. The results of the significant differences between what frequencies is evidence of non-random disconfirmation, this is presented in Fig. 3.

As it can be seen, there is greater confirmation than disconfirmation with the service in attributes A, C, E, G, J, K, L, O, P, Q, R, V, W, X, Y, Z and AA (see Table 1), whilst there is a predominance in the negative disconfirmation in B, D, F, H, I, M, N, S, T, U and AB. In any case positive disconfirmation has prevailed, in any case the expectations of users are exceeded (Table 1). Even so, conformity with the service prevailed on most of the attributes; thus, the trend on users would be to tolerate the differences between what they expect and what they perceive of the service quality of these aspects. In the negative disconfirmation, it can be seen that there is low performance in aspects such as access to specialists and therapies in convenient hours, immediate attention of emergencies, delivery of medicines, information and response to petitions, complaints and claims (PCC), prevention programs, telephone and web information, quality rankings information and response when services are denied. These results may indicate dissatisfaction.
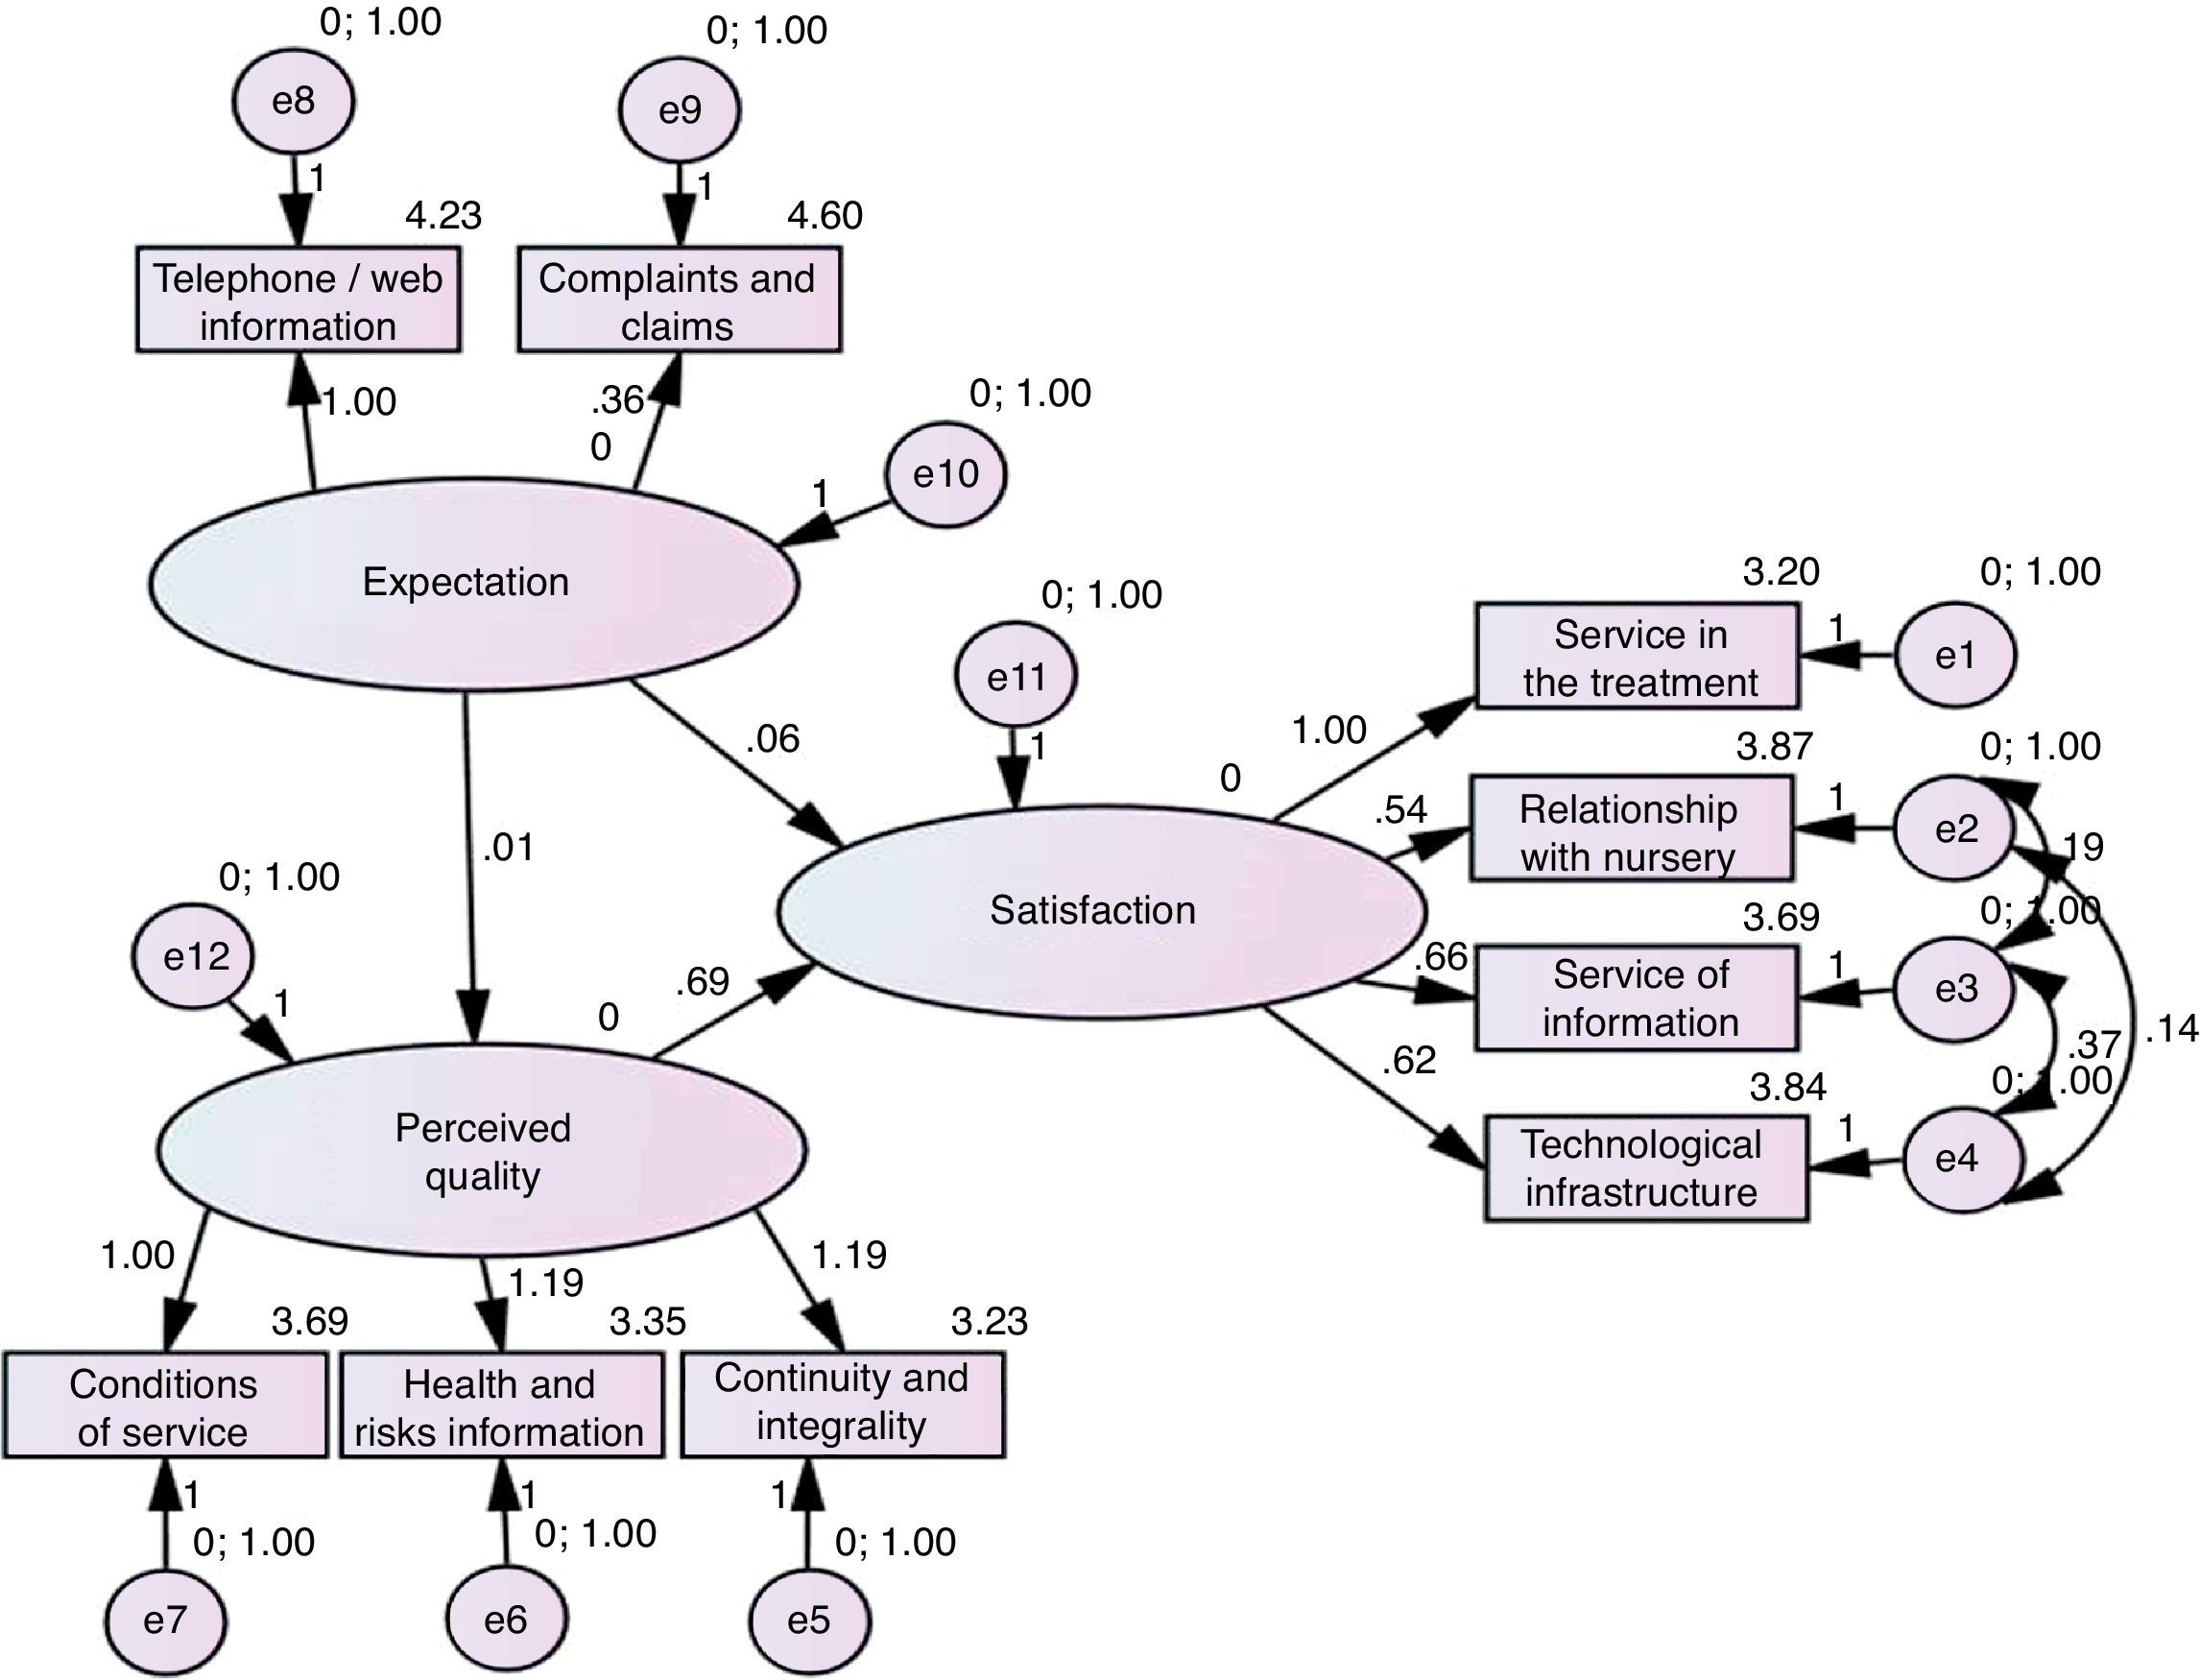
Direct effect modelFig. 4 shows the model equations to establish the direct effect of expectations and perceived quality through service performance in satisfaction. The model has an adjustment CFI=0.97, with an RMSEA=0.049 and a Chi-square of 264.2 (sig.=.000). These values indicate a good fit between the model and the observed data. Standardized parameter estimates are provided in Fig. 4.

As can be observed, only two expectations, those related with the telephone or web attention to provide information, are good predictors of expectation, whilst the service conditions in terms of hygiene, safety and respect, information on the state of health and personal risks, and the continuity and integrality of the services, are those that represent the best of the perceived quality of the health service. In turn, the best measures of the satisfaction construct were those related to the services in the treatment, the relationship with the nursing staff, information services and technology infrastructure.
Finally, the model allows to determine that expectations do not predict properly the satisfaction with the service (β=0.05), whereas the performance of the attributes or perceived quality is a good predictor of satisfaction (β=0.57), see Table 2.
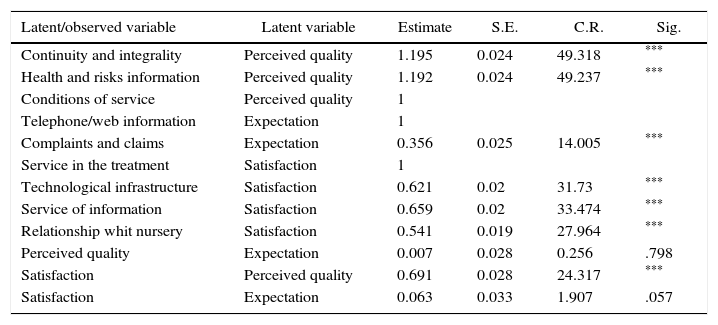
Estimation of parameters for predictors of satisfaction with the health service.
| Latent/observed variable | Latent variable | Estimate | S.E. | C.R. | Sig. |
|---|---|---|---|---|---|
| Continuity and integrality | Perceived quality | 1.195 | 0.024 | 49.318 | *** |
| Health and risks information | Perceived quality | 1.192 | 0.024 | 49.237 | *** |
| Conditions of service | Perceived quality | 1 | |||
| Telephone/web information | Expectation | 1 | |||
| Complaints and claims | Expectation | 0.356 | 0.025 | 14.005 | *** |
| Service in the treatment | Satisfaction | 1 | |||
| Technological infrastructure | Satisfaction | 0.621 | 0.02 | 31.73 | *** |
| Service of information | Satisfaction | 0.659 | 0.02 | 33.474 | *** |
| Relationship whit nursery | Satisfaction | 0.541 | 0.019 | 27.964 | *** |
| Perceived quality | Expectation | 0.007 | 0.028 | 0.256 | .798 |
| Satisfaction | Perceived quality | 0.691 | 0.028 | 24.317 | *** |
| Satisfaction | Expectation | 0.063 | 0.033 | 1.907 | .057 |
As can be evidenced, the model of rational expectations is not met, since predictive variables of satisfaction based on expectations are different from those based on service performance. Therefore, it cannot be said that there is equivalence between expectations and service performance or perceived quality of service.
DiscussionDifferent models of satisfaction measurement with health services were used in this study. The background we utilized includes the expectation and the performance or perceived quality, in an aggregate manner. The models were tested, and we found that the scope of each leads to different findings against the attributes that should be considered for the improvement of the service. In the case of the IPA, it allows to classify the attributes that might be emphasized in the management of the service, in a simple way. However, this model is insufficient to identify the differences not due to chance, which could cause disconfirmation. It is not possible to assess the minimum toleration in each attribute. Hence, the comparison of the individual assessments in group averages can generate mixtures of abstraction levels and errors of inference. As a consequence of the foregoing, there are contradictions when attempting to draw conclusions about the attributes that generate satisfaction and dissatisfaction. These results indicate that the model can present problems of validity to explain satisfaction, as indicated in other studies (Oh, 2001).
On the other hand, the model of expectation disconfirmation allows to analyze those performances that could be tolerated by the consumer in more detail, despite not fully meeting its expectations (Isac & Rusu, 2014). However, both the IPA and the model of disconfirmation have difficulties to establish attributes that are better predictors of satisfaction, as they take each attribute separately. Additional analysis such as regressions or confirmatory analysis are required in order to set the attributes of greater weight in satisfaction (Matzler et al., 2004). The model also has its own drawbacks when measuring the health system; there are previous experiences that allow to create performance standards but those rules generate a certain tolerance to the performances below expectation. The problem of the disconfirmation model is that it is necessary to establish the level of disconfirmation generated by chance or by the scale used, regarding the level of disconfirmation that reveals dissatisfaction or satisfaction (Yuksel & Yuksel, 2001). In the case of the evaluated health system, expectations are high in all cases and – in order to demonstrate whether or not expectations are confirmed and not to make errors of interpretation. It is necessary to assess the random responses of the participants, some models have attempted to consider the variations in the trends of the response distributions in accordance with the scale of measure (Huang, 2015).
However, the main drawback of the IPA and disconfirmation models is that they operate based on the contrast between expectations and quality perception and when we evaluated using a confirmatory model, the expectations are not good predictors of satisfaction. This result is consistent with the literature on the subject, since it is more reflective of a pre-purchase condition, while the level of satisfaction is related to post-purchase assessments. This is the reason why service performance is a better predictor of the service satisfaction (Yuksel & Yuksel, 2001). Structural equation models are useful in identifying the predictive variables or to reflect the determinants of satisfaction with the health service (Bleich et al., 2009). The model of structural equations in this particular study demonstrates that measuring a large number of attributes on the service to establish quality is not the best measurement way, it is preferable to identify a few attributes that really contribute to the understanding of the quality-satisfaction relationship and then monitor them continuously. This conclusion can be applied to the satisfaction studies that are applied in government entities and service providers. A confirmatory analysis of predictor variables such as those found in this study would allow to establish more universal criteria to measure satisfaction and reduces the costs of implementation of measurement systems with low validity, in this way it can be created scalability criteria of the services.
Finally, this study does not delve into the socio-demographic differences of respondents, nor in the segments of users who pay for the service, with respect to those who receive it as part of a public service, nor in the vulnerable populations. These differences could generate other interesting results to understand what generates satisfaction or dissatisfaction amongst users (Grabovschi, Loignon, & Fortin, 2013; Xesfingi & Vozikis, 2016), the behavior of the measures used in this segments requires verification.
We are grateful to the Konrad Lorenz University Foundation for funding this study.