

Conservative therapies, such as active surveillance, can be appropriate treatment for low-risk prostate cancer. The aim of this study was to analyze the frequency of Gleason score (GS) upgrading in patients with a low-grade GS. We reviewed our prospectively maintained database of patients with prostate cancer that underwent radical prostatectomy within the time frame of 2004–2015. Potential predictors of upgrading in patients with GS 3+3 were studied. Of the 342 patients in our database, 125 had GS 3+3. Biopsy GS and surgical GS were identical in 71 (56.8%) patients with GS 3+3, whereas 54 (43.2%) patients had an upgrade. The GS was upgraded to 7 in 70% of those patients and to ≥8 in 30%. We found a statistically significant correlation between postoperative upgrade and the preoperative prostate-specific antigen density (PSAD) value (p<0.001), prostate volume (p=0.004), and patient age ≥70 years (p=0.011). We estimated an optimal PSAD cutoff point of 0.17ng/ml2 through ROC analysis, with an AUC of 0.675 (p=0.001). It is our opinion that every hospital center offering active surveillance should carry out a continuous review of upgrading and related risk factors.
El cáncer de próstata de bajo riesgo es susceptible de ser tratado con terapias conservadoras como la vigilancia activa. El objetivo de este estudio es analizar la frecuencia del incremento de la escala de Gleason (GS) en pacientes con puntuaciones de bajo grado. Revisamos la base de datos institucional de pacientes con cáncer de próstata y que fueron sometidos a prostatectomía radical entre 2004 y 2015. Se investigaron los posibles predictores de incremento postoperatorio de GS en los pacientes con 3+3. El GS obtenido en la biopsia y en la pieza quirúrgica fue idéntico en 71 pacientes (56.8%), mientras que 54 pacientes (43.2%) tuvieron un incremento de la escala. De los cuales, el 70% cambiaron a un GS de 7 mientras que el 30% a un GS ≥8. Se encontró una correlación estadísticamente significativa entre el incremento de GS postoperatorio y el PSAD (p <0.001), el volumen prostático (p=0.004) y la edad ≥ 70 años (p=0.011). Estimamos un punto de corte óptimo de PSAD mediante análisis ROC de 0.17ng/ml2 con una AUC de 0.675 (p=0.001). Consideramos que una revisión permanente del incremento de GS y los factores de riesgo relacionados debe hacerse en cada institución que ofrece vigilancia activa.
Prostate cancer is the most common form of malignancy and the second leading cause of cancer death among men.1 Cadaveric studies show that the possibility of developing prostate cancer micro-foci increases with age (30% in the fourth decade of life, 40% in the fifth decade, etc.).2
While some cancers are aggressive, others have little or no metastatic potential.3 Many men with low-risk prostate cancer will not progress or become clinically symptomatic within their lifespan.4 Because of this variability, different treatment options have been introduced, offering comparable therapeutic effects to radical prostatectomy (RP), while preserving sexual function and continence. In this scenario, active surveillance (AS) may offer reduced morbidity and improvement in quality of life.5 Small, non-aggressive tumors are the ideal candidates for AS, albeit no consensus has been reached. Low-risk disease is defined as Gleason score (GS) 6 and prostate-specific antigen (PSA) <10ng/ml. Patients with clinical stage >T2a are usually excluded.6
Histologic grade is an independent determinant of disease prognosis and survival.7 The GS grading system is the most widely accepted classification,8 but many studies have shown that the GS obtained from prostate biopsy does not always correlate with the final pathologic grade of the surgical specimens. GS upgrade (increase in GS of at least one point) has been reported in up to 57% of cases.9,10 Errors in the assignment of GS may lead to the inappropriate surveillance of biologically aggressive tumors, or to the selection of treatments with inferior curing rates in high-risk disease, which may ultimately have a negative impact on patient outcomes.11 Therefore, several recent studies have searched for factors that could predict GS upgrading.12
Low prostate volume (PV), and more specifically, high prostate-specific antigen density (PSAD) have been shown to be predictors of risk progression in many studies, reflecting the possibility of undetected aggressive cancer.6 Several studies have shown a strong relationship between PSAD and prostate cancer aggressiveness.13 PSAD has been proposed as a strong predictor of GS upgrade in patients with biopsy-confirmed Gleason 6 disease, but there is no general consensus on the cut-off value.11–17
The main aim of our study was to identify the independent predictors for GS upgrade and determine the best cut-off value for PSAD to identify at-risk patients.
Materials and methodsWe collected the study information from our hospital center's prospectively maintained database. Patients with clinically localized prostate cancer that underwent radical prostatectomy (RP) and had a preoperative prostate biopsy within the time frame of January 2004 to February 2015 were selected. The detection of GS 3+3 at prostate biopsy was taken as inclusion criteria. All clinical, imaging, laboratory, and pathologic information was obtained from the database and corroborated by the clinical case records of the patients.
We included preoperative patient age, clinical disease stage, pre-biopsy PSA, preoperative PSAD, biopsy GS, total number of biopsy cores taken, and number of biopsy cores with cancer and analyzed the association of these factors with GS upgrading after RP. Different cut-off values were used for each variable to identify and quantify a potential relationship with Gleason upgrade. We also analyzed the association of GS upgrade with metabolic syndrome variables, such as diabetes mellitus (DM), high blood pressure (HBP), and obesity, which were obtained from the patients’ clinical records. The last variables were included because previous studies have shown their association with worse prognosis and a higher recurrence rate.18,19
PSAD was calculated by dividing the preoperative PSA value by the PV. PV was calculated by transrectal ultrasound using the maximum transverse diameter (D1), the maximum anteroposterior diameter (D2), and the maximum longitudinal diameter (D3), using the formula D1×D2×D3×ϖ/6 based on the prostate ellipse dimension theory.14 Prostate biopsy was performed using our hospital's previously described protocol. All patients were mildly sedated and a single i.v. dose of piperacillin/tazobactam was administered 15min before the procedure.20 We used an 18-gauge needle with an automatic biopsy gun to obtain the prostatic tissue. For the first biopsy, 12–18 cores were retrieved, depending on the size of the prostate and the presence of suspicious nodules.21 All samples were placed in a separate container that identified the corresponding site and were sent to the pathology service of our hospital.
Descriptive statistics were presented as mean±standard deviation (SD) and median/IQR for continuous variables and as the absolute frequency and distribution percentage for categorical variables. Patients postoperatively upgraded to GS 7 or higher were compared with those that were not upgraded. To determine mean differences and similarities, the categorical variables were compared using the Pearson chi-square test and the continuous variables with the median test and Student's t test. A univariate regression test was used for detecting significant independent predictors of upgrading. A receiver operating characteristic (ROC) curve was used and the area under the curve (AUC) was calculated to show the optimal cut-off value for variables with predictive significance for GS upgrade. We estimated the sensitivity, specificity, positive predictive value, and negative predictive value of different cut-off points proposed by other authors, applied them to our population, and then compared them with our cut-off value. All tests were two-tailed and a p value of <0.05 was considered statistically significant. The analyses were performed using SPSS version 20 (SPSS Inc, Chicago, IL) software.
ResultsFrom a total of 342 patients in our database, 144 (42.1%) were excluded because they had a GS ≥4 in the prostate biopsy. This left 198 (57.9%) patients that met our inclusion criteria of GS 6 (3+3). Seventy-three of those patients were excluded due to incomplete clinical information from the medical records.
Mean patient age was 65.1±6.3 years, body mass index (BMI) was 26.7±3.6kg/m2, the number of cores taken was 13.4±3.5, the number of positive cores was 2.5±2, and preoperative PSAD was 0.26±0.23ng/ml2. The preoperative median PSA was 7.2 IQR 5.67–10.05 and PV was 38 IQR 26.5–55.5. Clinical stage based on digital rectal examination was T1c in 86 (69.6%) patients, T2a in 28 (22.4%), T2b in 7 (5.6%), T2c in 2 (1.6%), and T3 in one (0.8%) patient.
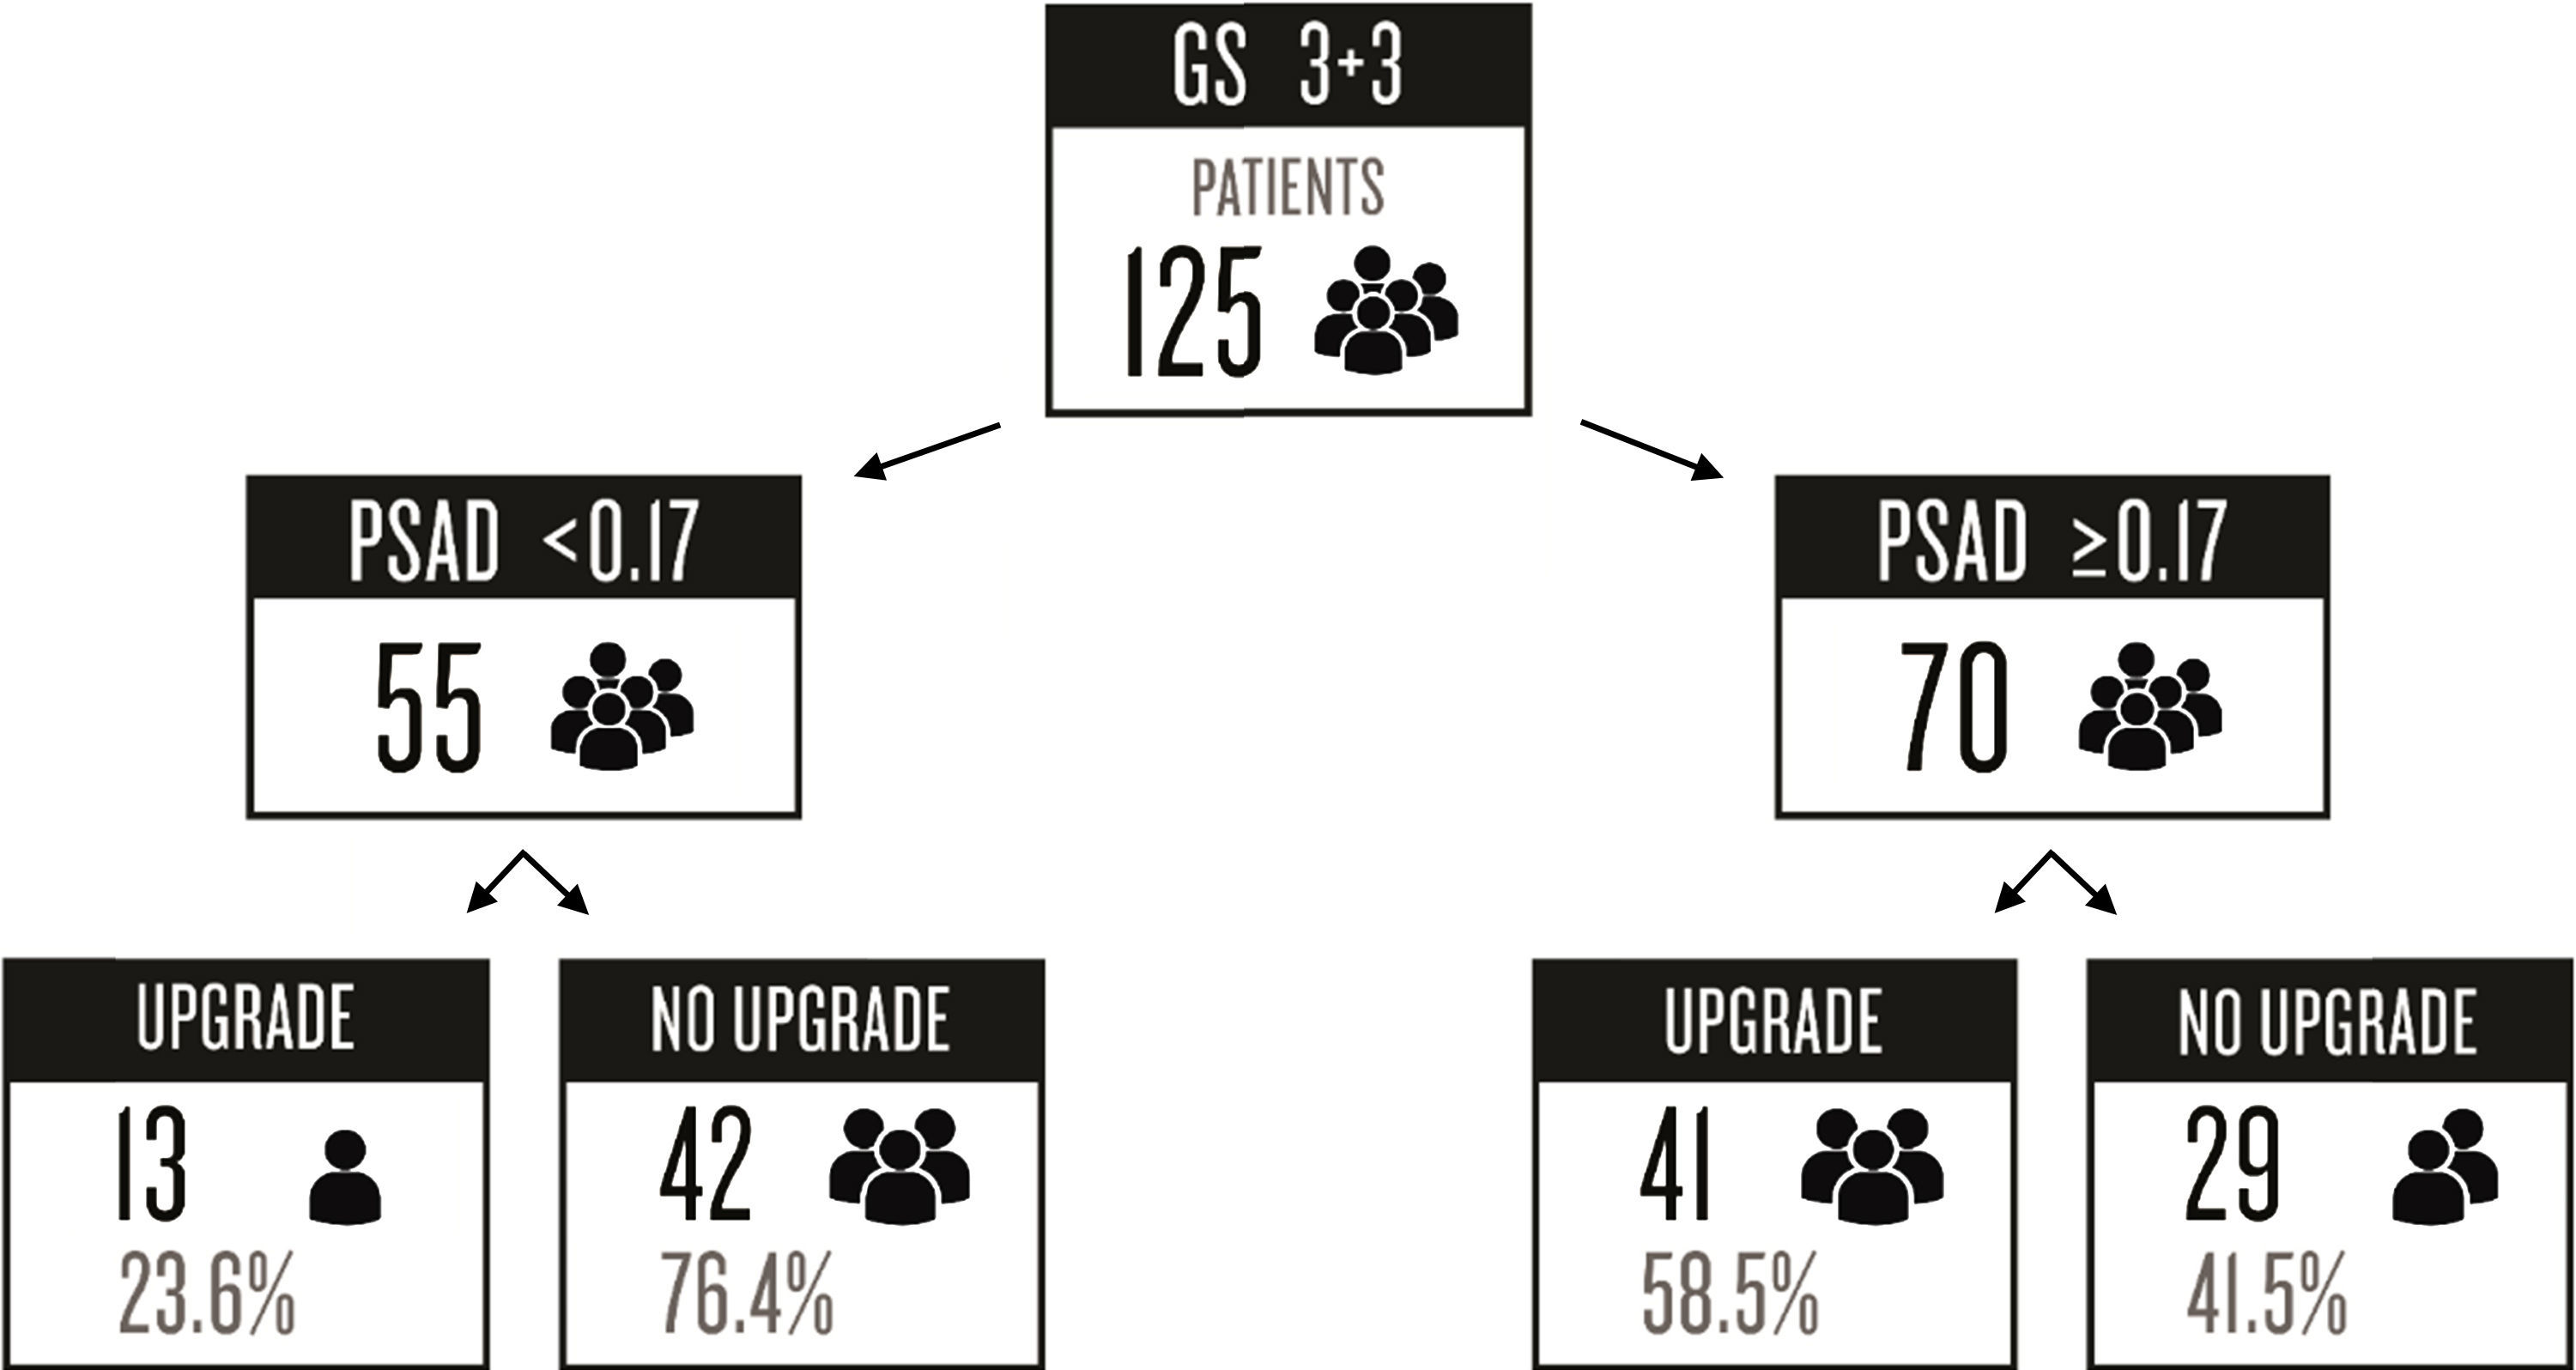
Preoperative PSA was categorized as follows: 6 (4.8%) patients had PSA values <4ng/ml, 88 (70.4%) were between 4 and 9.9ng/ml, 23 (18.4%) were between 10 and 19.9ng/ml, and 8 (6.4%) had PSA ≥20ng/ml. The biopsy GS and surgical GS remained the same in 71 (56.8%) patients with GS 3+3, whereas 54 (43.2%) patients had an upgrade. Of those patients with upgrade, 70% rose to a GS of 7 and 30% increased to ≥8.
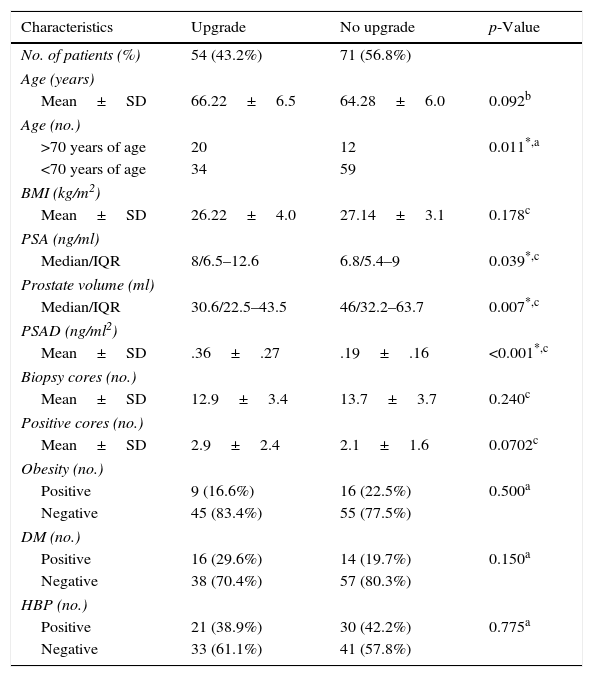
Table 1 shows the demographic and clinical characteristics of patients with and without GS upgrade. We found a statistically significant correlation between postoperative upgrade and the preoperative PSAD value (p<0.001), preoperative PSA (p=0.039), PV (p=0.004), and patient age ≥70 years (p=0.011).
Characteristics of patients with and without upgrade of Gleason score after radical prostatectomy.
| Characteristics | Upgrade | No upgrade | p-Value |
|---|---|---|---|
| No. of patients (%) | 54 (43.2%) | 71 (56.8%) | |
| Age (years) | |||
| Mean±SD | 66.22±6.5 | 64.28±6.0 | 0.092b |
| Age (no.) | |||
| >70 years of age | 20 | 12 | 0.011*,a |
| <70 years of age | 34 | 59 | |
| BMI (kg/m2) | |||
| Mean±SD | 26.22±4.0 | 27.14±3.1 | 0.178c |
| PSA (ng/ml) | |||
| Median/IQR | 8/6.5–12.6 | 6.8/5.4–9 | 0.039*,c |
| Prostate volume (ml) | |||
| Median/IQR | 30.6/22.5–43.5 | 46/32.2–63.7 | 0.007*,c |
| PSAD (ng/ml2) | |||
| Mean±SD | .36±.27 | .19±.16 | <0.001*,c |
| Biopsy cores (no.) | |||
| Mean±SD | 12.9±3.4 | 13.7±3.7 | 0.240c |
| Positive cores (no.) | |||
| Mean±SD | 2.9±2.4 | 2.1±1.6 | 0.0702c |
| Obesity (no.) | |||
| Positive | 9 (16.6%) | 16 (22.5%) | 0.500a |
| Negative | 45 (83.4%) | 55 (77.5%) | |
| DM (no.) | |||
| Positive | 16 (29.6%) | 14 (19.7%) | 0.150a |
| Negative | 38 (70.4%) | 57 (80.3%) | |
| HBP (no.) | |||
| Positive | 21 (38.9%) | 30 (42.2%) | 0.775a |
| Negative | 33 (61.1%) | 41 (57.8%) | |
IQR: interquartile range; BMI: body mass index; PSA: prostate-specific antigen; PSAD: prostate-specific antigen density; DM: diabetes mellitus; HBP: high blood pressure.
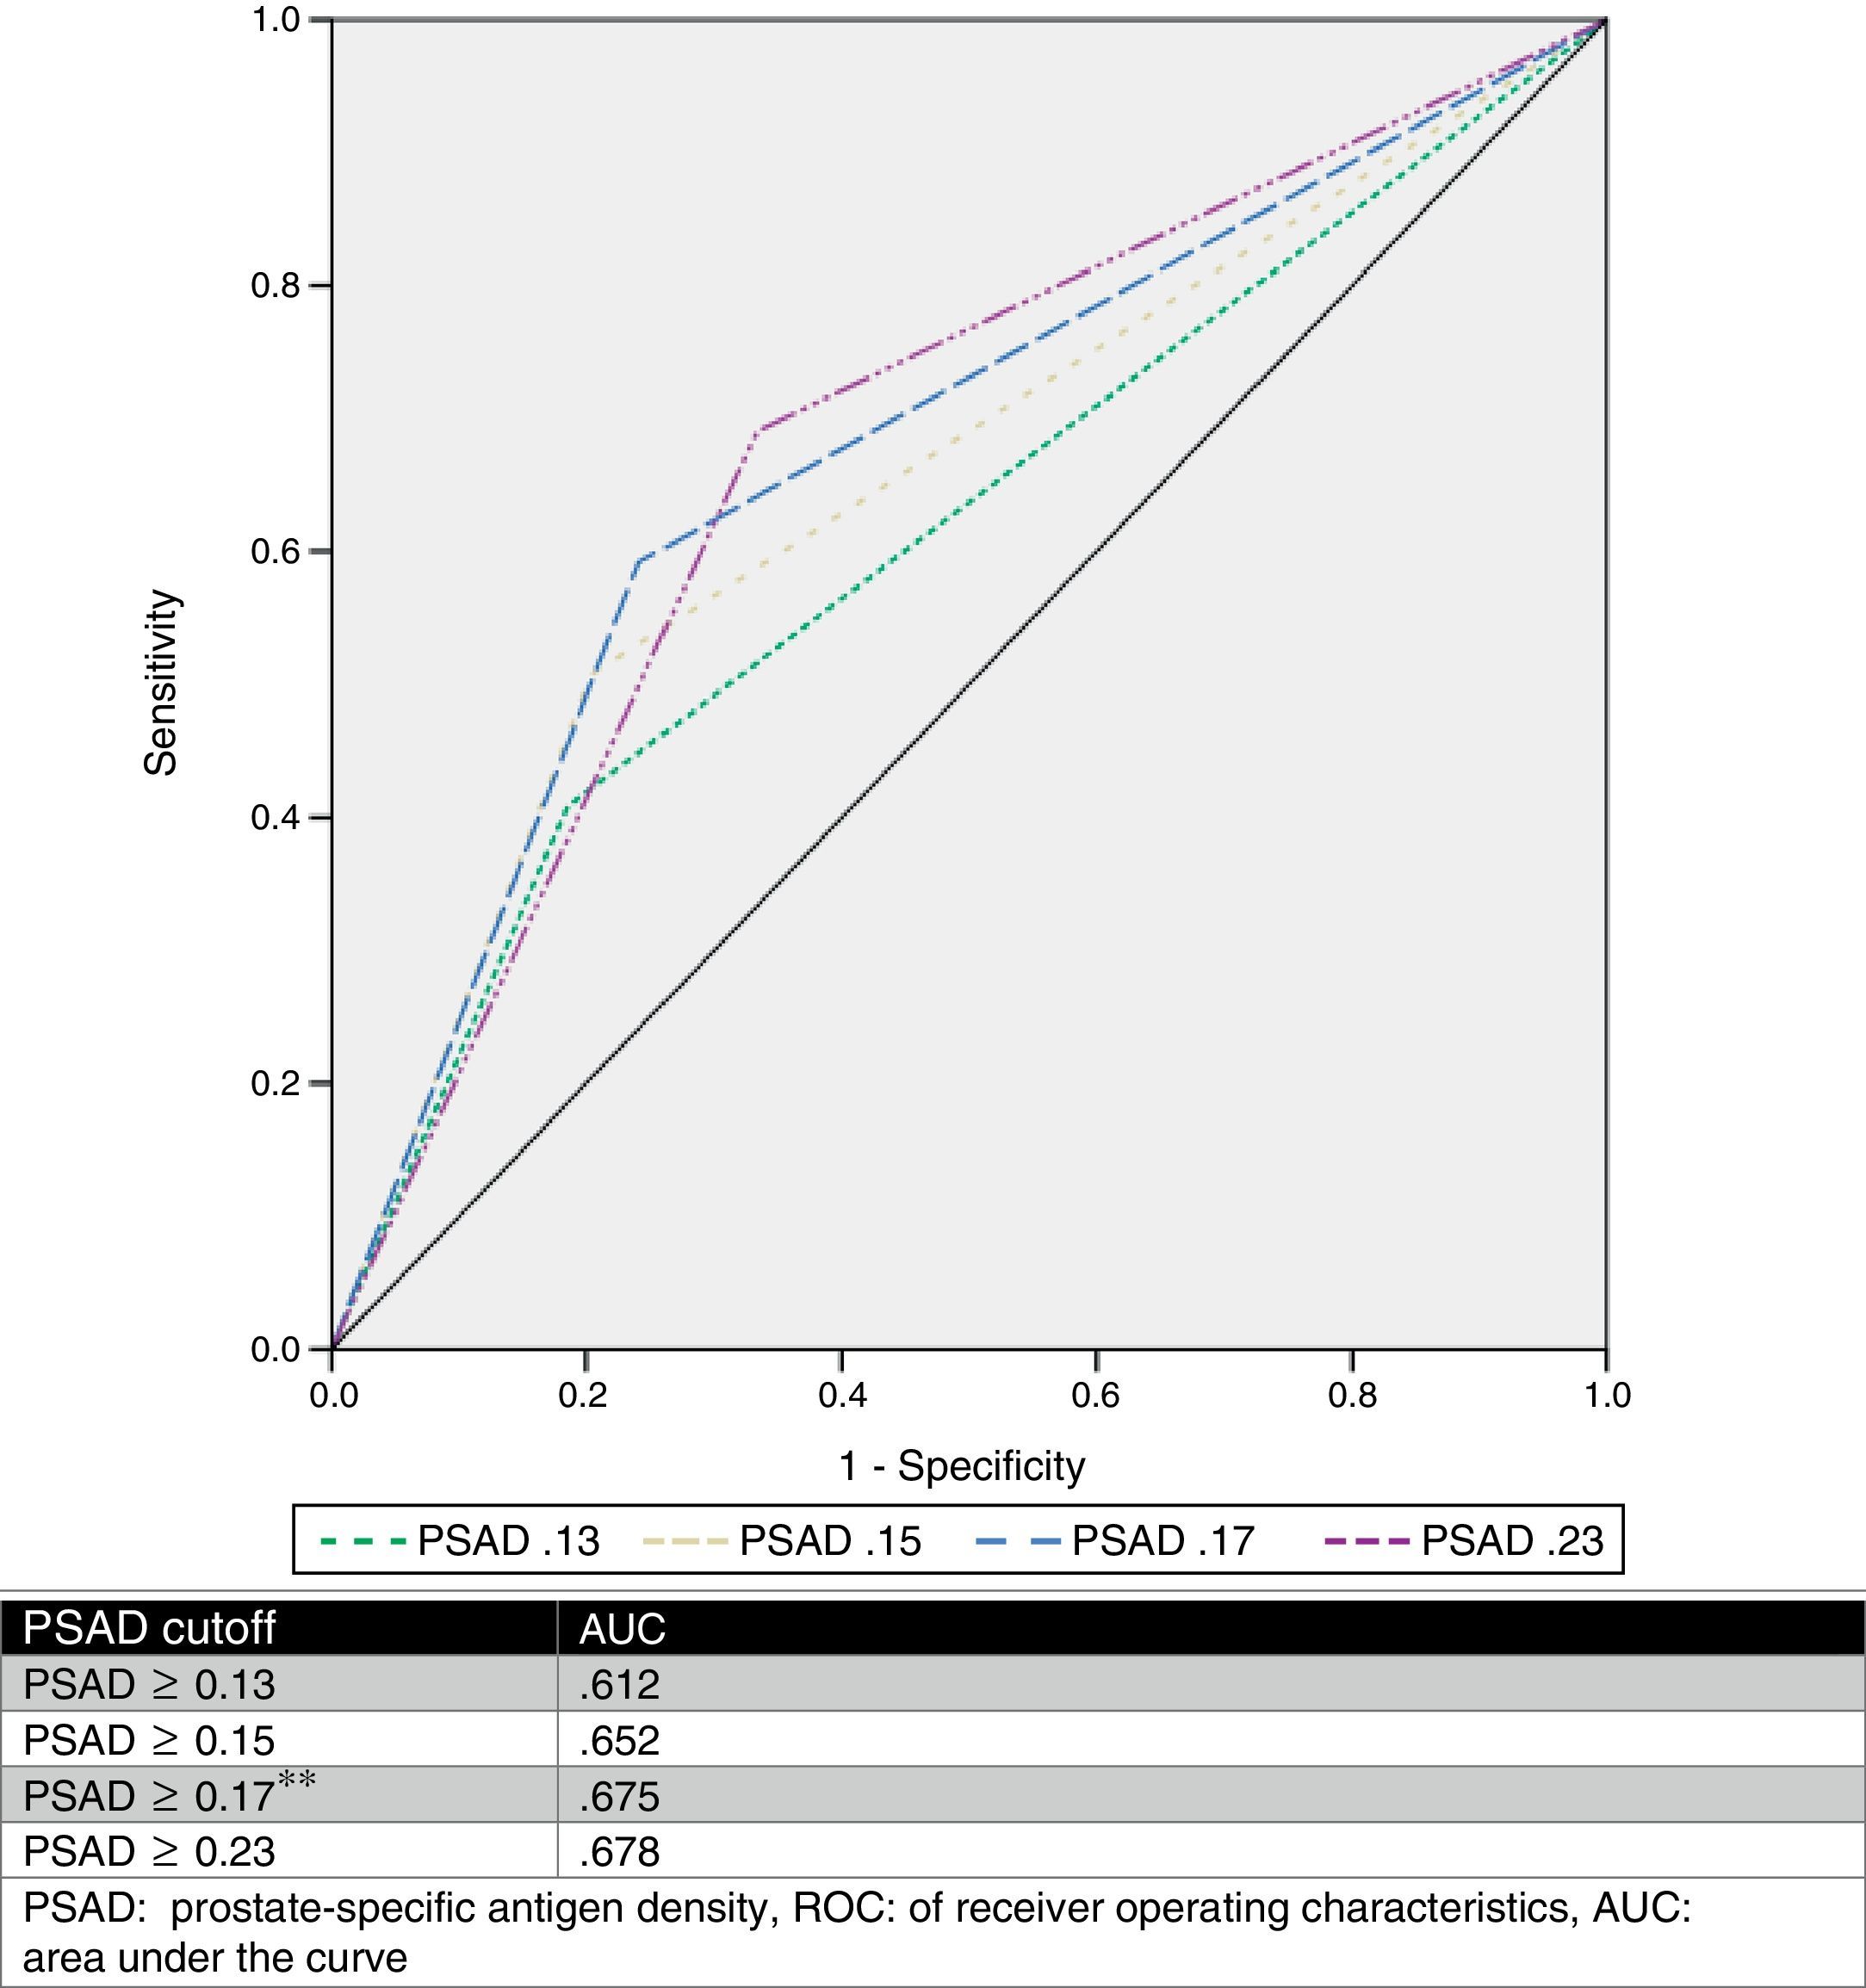
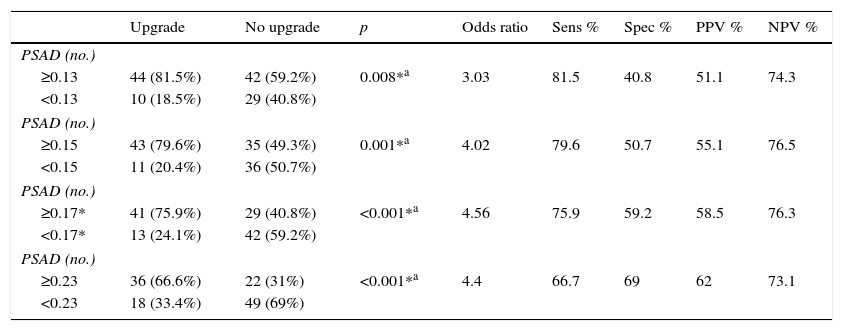
We estimated an optimal PSAD cut-off point of 0.17ng/ml2 through ROC analysis, with an AUC of 0.675 (p=0.001, 95%CI .580–.770), and then analyzed the cut-off values proposed by other authors and compared them. Table 2 and Fig. 1 show those results.
Analysis of different cutoff values of PSAD as a predictor of GS upgrade.
| Upgrade | No upgrade | p | Odds ratio | Sens % | Spec % | PPV % | NPV % | |
|---|---|---|---|---|---|---|---|---|
| PSAD (no.) | ||||||||
| ≥0.13 | 44 (81.5%) | 42 (59.2%) | 0.008*a | 3.03 | 81.5 | 40.8 | 51.1 | 74.3 |
| <0.13 | 10 (18.5%) | 29 (40.8%) | ||||||
| PSAD (no.) | ||||||||
| ≥0.15 | 43 (79.6%) | 35 (49.3%) | 0.001*a | 4.02 | 79.6 | 50.7 | 55.1 | 76.5 |
| <0.15 | 11 (20.4%) | 36 (50.7%) | ||||||
| PSAD (no.) | ||||||||
| ≥0.17* | 41 (75.9%) | 29 (40.8%) | <0.001*a | 4.56 | 75.9 | 59.2 | 58.5 | 76.3 |
| <0.17* | 13 (24.1%) | 42 (59.2%) | ||||||
| PSAD (no.) | ||||||||
| ≥0.23 | 36 (66.6%) | 22 (31%) | <0.001*a | 4.4 | 66.7 | 69 | 62 | 73.1 |
| <0.23 | 18 (33.4%) | 49 (69%) | ||||||
PSAD: prostate-specific antigen.

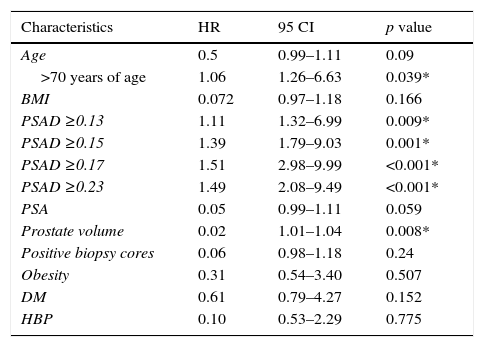
Table 3 shows the results from the univariate regression for the detection of independent predictors of upgrading.
Independent predictors of upgrading (univariate regression).
| Characteristics | HR | 95 CI | p value |
|---|---|---|---|
| Age | 0.5 | 0.99–1.11 | 0.09 |
| >70 years of age | 1.06 | 1.26–6.63 | 0.039* |
| BMI | 0.072 | 0.97–1.18 | 0.166 |
| PSAD ≥0.13 | 1.11 | 1.32–6.99 | 0.009* |
| PSAD ≥0.15 | 1.39 | 1.79–9.03 | 0.001* |
| PSAD ≥0.17 | 1.51 | 2.98–9.99 | <0.001* |
| PSAD ≥0.23 | 1.49 | 2.08–9.49 | <0.001* |
| PSA | 0.05 | 0.99–1.11 | 0.059 |
| Prostate volume | 0.02 | 1.01–1.04 | 0.008* |
| Positive biopsy cores | 0.06 | 0.98–1.18 | 0.24 |
| Obesity | 0.31 | 0.54–3.40 | 0.507 |
| DM | 0.61 | 0.79–4.27 | 0.152 |
| HBP | 0.10 | 0.53–2.29 | 0.775 |
BMI: body mass index; PSA: prostate-specific antigen; PSAD: prostate-specific antigen density; DM: diabetes mellitus; HBP: high blood pressure.
Several studies have found a lack of concordance between the GS report from the prostate biopsy and the radical prostatectomy report. In a recent meta-analysis including 14,839 patients, the authors estimated a GS upgrade in 30% of the patients, with only 63% remaining unchanged after prostatectomy.22 Gleason upgrade has been found in 29–58% of cases,23 and is worse in the sub-group of patients with a biopsy GS 3+3 (up to 63.3%).14 In our hospital center, we found a GS upgrade in 42.1% of all patients that underwent radical prostatectomy and in 43.2% of the patients with a biopsy Gleason score of 3+3.
Many authors have tried to find predictors of GS upgrade, particularly with the currently increasing popularity of the AS protocols. Previously described predictors are age >60 years, PSA value >5.0ng/ml, and >25% of positive cores during biopsy.24
PSAD has been analyzed and several cut-off values have been described (such as ≥0.13ng/ml, ≥0.15ng/ml, and ≥0.23ng/ml).11,13,16,17 Nevertheless, there is no consensus on the use of this value to accurately predict a GS upgrade. Based on our results, we proposed a cut-off value of ≥0.17ng/ml, which had an AUC of 0.675, sensitivity of 75.9%, specificity of 59.2%, PPV of 58.5%, and NPV of 76.3% for the prediction of GS upgrade. We selected this cut-off point, because when analyzing other proposed values in relation to our case series, the best AUC was obtained with a value ≥0.23ng/ml (0.678), but it had a worse sensitivity and a high false negative rate (33.33%). On the other hand, when we used the ≥0.13ng/ml and ≥0.15ng/ml values, they had a false positive rate of 59% and 49%, respectively. The false negative rate and false positive rate of the cut-off proposed by our team was 24% and 41%, respectively, which we considered the most useful. Fig. 2 displays a graph of our population.

Our study included only patients with a biopsy GS of 3+3, because of the importance of this variable when considering a patient for AS. Given that there are other factors taken into consideration for active surveillance, we cannot declare that the risk of GS upgrade and PSAD are determining variables for proposing a therapeutic strategy, but we definitely believe they should be discussed before making a decision. A second biopsy could be indicated for patients with a PSAD ≥0.17ng/ml, considering the risk of under-classification, in order to corroborate the GS. Prostate MRI and MRI-guided fusion biopsies have shown high sensitivity and specificity for locating unidentified significant cancer.25 However, these options are not widely available in Mexico, so transrectal ultrasound-guided saturation or template biopsy could be a more viable option to increase diagnostic accuracy.
Recent evidence has suggested an association between the different components of metabolic syndrome and prostate cancer, increasing the risk of presenting with the disease and dying from it,21 as well as a higher rate of biochemical recurrence after radical treatment.22 However, in our study we could not demonstrate an association with Gleason score upgrade.
Prostate volume, which is directly related to age, could be a distracting element. When a random ultrasound-guided biopsy is carried out in a large prostate there is a potential risk of leaving larger under-sampled areas, which represents a higher risk of missing a significant tumor.
AS has provided promising results in patients with low-risk prostate cancer, with improvements in quality of life, preservation of erectile function and urinary continence, and in other complications associated with radical treatments.6 However, there is a risk of misdiagnosing an aggressive cancer and delaying opportune treatment, affecting patient prognosis. There are many criteria for selecting AS candidates, and the D’Amico risk classification26 and Epstein criteria27 are the most widely used for this purpose. The former does not include PSAD, but in the Epstein criteria the use of a cut-off value ≥0.15ng/ml is suggested. In our hospital, we use very strict criteria and the PSAD cut-off value ≥0.17ng/ml will be included as part of the discussion when selecting a possible candidate for AS.
The retrospective character of our study was its principal limitation. The potential sample was reduced even further due to incomplete data in the clinical case records. Another limitation was the fact that we did not have all the data from the biopsy samples, so we could not analyze patients with the full AS criteria. However, with the amount of patients included in the study, significant results were obtained and these can be used to consider the risk of GS upgrade in patients with GS 3+3.
ConclusionsWe conclude that it is important to use as many tools as possible to make accurate decisions and to identify the patients at high risk of pathologic upgrading that might benefit from more meticulous evaluation and/or aggressive treatment. PSAD should be routinely used to identify patients with apparently low-risk cancer at risk of GS upgrade, resulting in a more accurate selection of candidates for AS. According to our data, we can avoid a potentially incorrect GS staging in approximately 43% of the cases.
We found a high frequency of GS upgrade in our population. In our study, PSAD values were significantly associated with upgrading and the most accurate cut-off value was 0.17ng/ml2. We recommend that a local review of GS upgrade risk and its potential predictors be carried out at all hospital centers before offering active surveillance to potential candidates.
Ethical disclosuresProtection of human and animal subjectsThe authors declare that no experiments were performed on humans or animals for this study.
Confidentiality of dataThe authors declare that no patient data appear in this article.
Right to privacy and informed consentThe authors declare that no patient data appear in this article.
FundingNo endorsement of any kind was received to undertake this article.
Conflict of interestThe authors declare that they have no conflict of interest, not have they received any sponsorship for the study.