

Electromyography is a useful tool in orthodontics to evaluate and monitor muscle activity for diagnosis and during treatment
ObjectivesThe aim of this study was to determine changes in electric muscular activity during different phases of orthodontic treatment.
Material and methodsWe performed a cohort study and measured bilateral electromyographic activity (EMG) for 30 seconds in maximum intercuspation. EMG activity was measured monthly for 15 months during 4 phases in orthodontic treatment: preatreatment (P0), splint wear (P1); leveling and aligning (P2); space closure (P3); and finishing stage (P4). EMG was measured using a digital electromyograph developed by our group (hardware and software) to determine μV every 0.002 seconds. The root mean square (RMS) value was estimated as a mean value of EGM. Patients were treated at the Orthodontics Department and the Physiology Laboratory of UNAM during 2014-2016. We performed a descriptive, bivariate analysis and a random effects linear regression model for repeated measurements adjusted by age, gender, malocclusion and extractions.
ResultsOur pilot study included 10 patients (6 female and 4 male); mean age was 20 years. At baseline, maximum median EMG was recorded (median 239 μV, IQR 143 μV-561 μV), Multivariate analysis showed that EMG measurements decreased at P1 (regression coefficient [Coef]. -180.97; 95% CI -330.37, -31.56; p = 0.018), P3 (Coef. -168; 95% CI -332.36; -3.76; p = 0.045) and P4 (Coef. -184.21; 95% CI -326.91, -41.5; p = 0.011).
ConclusionsEMG changes decreased randomly during orthodontic phases and not constantly as generally believed.
La electromiografía es una herramienta útil en la ortodoncia para evaluar y monitorear la actividad muscular.
ObjetivoDeterminar los cambios en la actividad eléctrica muscular durante las diferentes fases del tratamiento ortodóntico.
Material y métodosSe realizó un estudio de cohorte y se midió la actividad electromiográfica bilateral (EMG) durante 30 segundos en máxima intercuspidación. Se realizaron 15 mediciones mensuales de la EMG durante cuatro fases en el tratamiento ortodóncico: basal (P0); uso de la férula (P1); nivelación y alineación (P2); cierre de espacios (P3); y la etapa de finalización (P4). Se usó un electromiógrafo (EMG) digital, desarrollado por nuestro grupo (hardware y software) para determinar μV cada 0.002 segundos y el valor medio cuadrático (RMS) fue estimado como un valor medio de EGM. Los pacientes fueron tratados en el Departamento de Ortodoncia y el Laboratorio de Fisiología en la UNAM durante 2014-2016. Se realizó un análisis descriptivo, un modelo de regresión lineal de efectos aleatorios para medidas repetidas ajustadas univariado y otro multivariado ajustado por variables confusoras.
ResultadosSe incluyó a 10 pacientes, con edad promedio de 20.6 años. La medición basal de EMG fue de 239 μV (RIC 143-561). El modelo multivariado mostró una disminución de la EMG en P1 (coeficiente de regresión [Coef.] -180.97; IC 95% -330.37, -31.56; p = 0.018), P3 (Coef. -168; IC 95% -332.36; -3.76; p = 0.045) y P4 (Coef. -184.21; IC 95% -326.91, -41.5; p = 0.011), en comparación con la basal.
ConclusionesLos cambios EMG disminuyeron durante las fases ortodóncicas aleatoriamente durante las etapas de tratamiento no de manera constante como generalmente se asume.
Electromyography (EMG), is the recording and study of the intrinsic electrical properties of the skeletal muscle. Electromyographic activity of the muscle is recorded via the use of electrodes that are placed on the skin, one in the origin and the other in the insertion of the muscle.1–3 Although Dubois-Raymond developed electromyography in 1849, the applications in orthodontics are rare, even when the muscular component is of paramount importance for the diagnosis, planning and treatment of malocclusions.4,5 One of the first specific applications was described by Jenkelson through the concept of miocentric position, which unlike the concepts of maximum occlusion and centric relation highlights the importance of muscular activity to achieve an adequate relationship of the occlusal, muscular and bony components. 6,7 However, in comparison with other study topics in the area of orthodontics there are few studies on applied electromyography. It is true however that there are some indexes or classifications to identify the presence of temporomandibular disorders or the presence of myofascial pain, for example, the Helkimo index or the pain map among others.8 Most of these methods are subjective because they depend on the training of the clinician to evaluate and properly record the degree of alteration. As a result, these indices do not represent the best alternative to study muscle activity and muscle activity changes throughout the different phases of the treatment.9 The use of electromyography, can represent a more objective method to evaluate muscle activity at the time of diagnosis, subsequent to the use of occlusal splints, prior to orthodontic treatment and the behavior of the electromyographic activity through the different phases of orthodontic treatment.
Together, the Physiology Laboratory of the Division of Post-Graduate Studies and Research (DEPeI) of the Faculty of Dentistry at the National Autonomous University of Mexico (UNAM) and the working group of the CINVESTAV Bioelectronics Laboratory of the National Polytechnic Institute (IPN) developed a device for recording electromyographic activity and a software for the analysis and interpretation of the information of the electromyographic activity.
In clinical practice the orthodontist assumes that there is an adaptation of the activity of the muscles of mastication, however it is unknown whether this represents an increase or decrease in muscle activity.10 The aim of this study was to compare the synchronous electromyographic activity of each of the masseters at maximum intercuspation prior to orthodontic treatment, subsequent to the use of a occlusal splint and during different phases of orthodontic treatment.
MATERIAL AND METHODSA pilot study was developed using a methodology of prospective cohort study to compare changes in the muscle activity of the masseter muscles during the different phases of orthodontic treatment with regard to the basal measurement.
The study was carried out in the Department of Orthodontics of the Iztacala Faculty of Higher Studies (FES-Iztacala) of the National Autonomous University of Mexico (UNAM) and the electromyographic measurements were performed in the Physiology Laboratory of the Division of Post-Graduate Studies and Research (DEPeI) of the Faculty of Dentistry of the UNAM. The period for patient recruitment was between January and March of 2015 and the followup evaluation of the last patient was conducted in February 2017.
The inclusion criteria were: 1) patients in an age range between 15 and 30 years, 2) patients accepted for treatment in the Department of Orthodontics of the FES-Iztacala, 3) without prior treatment of orthodontics or orthopedics, 4) patients without previous extractions, 5) patients with no systemic anomalies. Exclusion criteria were: 1) presence of severe myofascial pain, 2) previous diagnosis of temporomandibular disorder (TMD), 3) presence of any craniofacial syndrome, 4) reduced mouth opening (less than 15 mm). Elimination criteria were: 1) patients who declined participation in the study for any reason or circumstance, 2) patients who reported severe myofascial pain, 3) or presented reduced mouth opening (less than 15 mm), 4) abandonment or suspension of orthodontic treatment.
The selection of the sample was by convenience. Appointments for treatment and clinical evaluation of orthodontic treatment were performed at least once a month, while electromyographic evaluation was performed between one and three months. For each individual 15 measurements were considered throughout the treatment, one at baseline and 14 during treatment.
The dependent variable was the mean quadratic value or RMS (root mean square), and represents the average of the square values of the electromyographic activity. The RMS has only positive values ranging between zero and infinity, where zero represents a null activity and the higher the RMS value the higher will be the average of the electromyographic activity of the masseter muscle. The characteristics of the electromiograph have been previously described,11 but we will briefly describe some features. RMS is recorded via the use of three electrodes, one placed in the muscular origin, another in the insertion and finally one in the retroauricular area as the neutral electrode. The registration of RMS is done in maximum intercuspation and skeletal muscle contraction was carried out by a nervous stimulus that generates an action potential, which is expressed in energy that is recorded in microvolts (millionth of a volt) and is reported as a relationship of microvolts per second (μv/s). The RMS represents an average value of the variation between the highest and the lowest point of the wavelength of the electromyographic activity. The measurement of RMS is performed during a period of 30 seconds.
The independent variables were the different stages of orthodontic treatment, which were classified as follows: 1) baseline, which is the first measurement prior to the use of the splint or orthodontic treatment; 2) use of splint, any measurement performed at 30 days after the use of the occlusal splint but prior to the start of orthodontic treatment; 3) alignment and leveling phase, any measurement performed later at the start of the orthodontic treatment where only round archwires were used; 4) space closure or transition, any measurement performed during space closure in cases on which extractions were performed or in cases without extractions were Ni-Ti or thermal square or rectangular arches were used prior to the placement of rectangular steel archwires; 5) finishing stage, any measurement performed subsequent to the placement of the first rectangular steel archwires until the completion of the treatment.
As confounding variables, the following were considered: 1) side of measurement, the side on which the assessment of the masseter was performed, either right or left; 2) treatment with extractions, 3) use of elastics, during the period of measurements but not during the measurement; 4) type of skeletal malocclusion, class II or III; and as indicators of the vertical dimension, in order to control for a possible muscle elongation, 5) posterior facial height, the distance between point Sella and Gonion point measured in millimeters; and 6) anterior facial height, the distance between Nasion and Pogonion measured in millimeters.
Measurement of the electromyographic activity of the superficial masseterAt each evaluation appointment, records of the electromyographic activity in a position of maximum intercuspation (MY) were obtained simultaneously for each of the superficial masseters. For the assessment of the electromyography a device designed, evaluated and patented by researchers of the CU-UNAM and CINVESTAV-IPN previously described was used.11
Each electromyographic record performs simultaneously a measurement for each side every 0.0002 seconds for 30 seconds, which is 150.000 measurements per record in maximum intercuspation or without posterior occlusal contacts. In total, for this study, we analyzed more than 33 million data in relation to electromyographic activity.
Record of the clinical informationAll clinical information from the first appointment to the last clinical review was recorded in detail in the clinical history and was subsequently registered in a database for later analysis. In the same way the cephalometric analysis required to determine the classification of the malocclusion and the vertical dimension was drawn by hand by the principal investigator (RCCI) and the information was integrated into the database to integrate a unique basis. A senior orthodontist reviewed the cephalometric tracing in order to guarantee the correct identification of the points for obtaining the corresponding measurements.
Statistical analysisA descriptive analysis of the main clinical characteristics of the study population was conducted. The mean and standard deviation or the median and interquartile range were reported according to whether or not it had a normal distribution. Through a regression analysis of random effects for repeated measuremrents, first only univariate and subsequently the multivariate model, changes in the electromyographic activity were assessed throughout the different phases of treatment and compared to the basal measurement, considering the confounding effect of the measurement side, treatment with extractions, use of elastics, type of malocclusion and measurements of the vertical dimension. Both models, the univariate as well as the multivariate, considered the individual as a conglomerate to control the covariance between the electromyographic activity of the left and right masseter of each person.
Ethical considerationsAll patients signed an informed consent form prior to their participation in the study. Patient care was not conditional on the acceptance and participation in the study. Since it was a prospective but observational study there was no intervention indicated by the study, and in accordance with the rules of procedure of the General Health Law in the field of Health Research, it is considered as research with minimal risk. The protocol was accepted and evaluated by the authorities and committees of the FES Iztacala.
RESULTSThe total sample consisted of 10 patients, of whom six were male. The average age was 17 years (± 3.5 years) between the ages of 15 and 30 years. In relation to the diagnosis of skeletal classification, six patients were diagnosed as class II and 4 as class III. With regard to orthodontic treatment in 58.5% of casesEste documentosome kindes ofelaboradomild temporomandibularMedigraphic disorder was observed. It was noted that in 60.0% of the cases premolar extractions were performed, while in 41.5% of the treatments intermaxillary elastics were used in some phase. With respect to the prescription of the bracket three cases were treated with each of the following prescriptions: edgewise, bioprogressive (Ricketts) and Protorque; while two cases were treated with MBT, two with Alexander and three with Roth.
6.9% of the samples were at basal measurement, 20.6% during the use of physiological splint, 26.7% during the leveling and alignment phase, 32.2% during space closure and transition and 13.7% at the finishing phase.
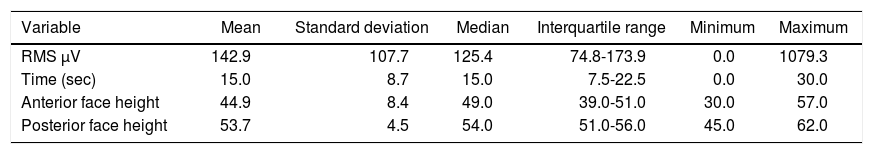
The results of the electromyographic activity and the posterior and anterior face height are described in detail in table I. Regarding the electromyographic activity of the superficial masseter muscles it was noted that the measurements did not have a normal distribution, and reported a mean value of electromyographic activity of 125 μV with quartile values of 25 and 75 of 74.8 μV and 173.8 μV respectively. In relation to posterior face height an average of 44.9 mm was observed, with a standard deviation (S.D.) of 8.3 mm, while the posterior face height had an average of 53.7 mm and a SD of 4.5 mm.
Description of the electromyographic activity values, measurement time and vertical dimension values.
| Variable | Mean | Standard deviation | Median | Interquartile range | Minimum | Maximum |
|---|---|---|---|---|---|---|
| RMS μV | 142.9 | 107.7 | 125.4 | 74.8-173.9 | 0.0 | 1079.3 |
| Time (sec) | 15.0 | 8.7 | 15.0 | 7.5-22.5 | 0.0 | 30.0 |
| Anterior face height | 44.9 | 8.4 | 49.0 | 39.0-51.0 | 30.0 | 57.0 |
| Posterior face height | 53.7 | 4.5 | 54.0 | 51.0-56.0 | 45.0 | 62.0 |
μV = microvolts; interquartile range = 25 quartile and 75 quartile.
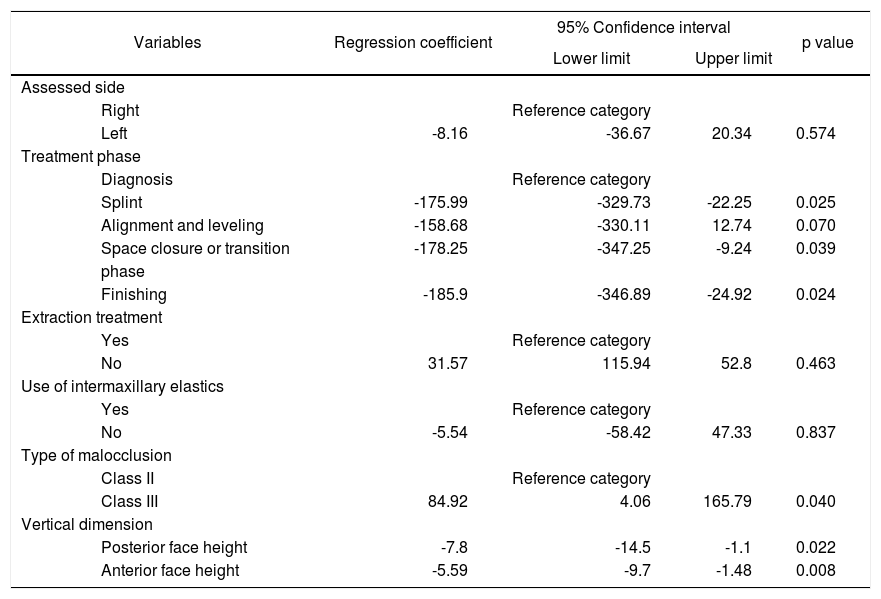
emspTable II shows the univariate analysis results, i.e. the relationship only between the electromyographic activity and each one of the variables considered in the study. According to the results of the analysis, there was a decrease in electromyographic activity of the masseter muscles during the different phases of orthodontic treatment of use of physiological splint -175.99 microvolts (95% CI -329.73, -22.25; p = 0.025), during space closure or transition of -178.25 μV (95% 0.039 -347.25, -9.24 and during the finishing stage, of -185.9 μV (95% -346.89, -24.92; p = 0.024) in comparison with the measurement of basal muscle activity. On the other hand only statistically significant differences were found in the activity of class III patients who showed a greater electromyographic activity: 84.92 μV (IC 95% 4.06, 165.79; p = 0.040) compared with class II patients; and in the variables of vertical dimension where it was observed that, for every mm of posterior or anterior facial height increase, the electromyographic activity decreases in -7.8 microvolts (95% -14.5, -1.1; p = 0.022) and -5.59 microvolts (95%-9.7, -1.48; p = 0.008).
Results of the random effects simple regression model.
| Variables | Regression coefficient | 95% Confidence interval | p value | |
|---|---|---|---|---|
| Lower limit | Upper limit | |||
| Assessed side | ||||
| Right | Reference category | |||
| Left | -8.16 | -36.67 | 20.34 | 0.574 |
| Treatment phase | ||||
| Diagnosis | Reference category | |||
| Splint | -175.99 | -329.73 | -22.25 | 0.025 |
| Alignment and leveling | -158.68 | -330.11 | 12.74 | 0.070 |
| Space closure or transition | -178.25 | -347.25 | -9.24 | 0.039 |
| phase | ||||
| Finishing | -185.9 | -346.89 | -24.92 | 0.024 |
| Extraction treatment | ||||
| Yes | Reference category | |||
| No | 31.57 | 115.94 | 52.8 | 0.463 |
| Use of intermaxillary elastics | ||||
| Yes | Reference category | |||
| No | -5.54 | -58.42 | 47.33 | 0.837 |
| Type of malocclusion | ||||
| Class II | Reference category | |||
| Class III | 84.92 | 4.06 | 165.79 | 0.040 |
| Vertical dimension | ||||
| Posterior face height | -7.8 | -14.5 | -1.1 | 0.022 |
| Anterior face height | -5.59 | -9.7 | -1.48 | 0.008 |
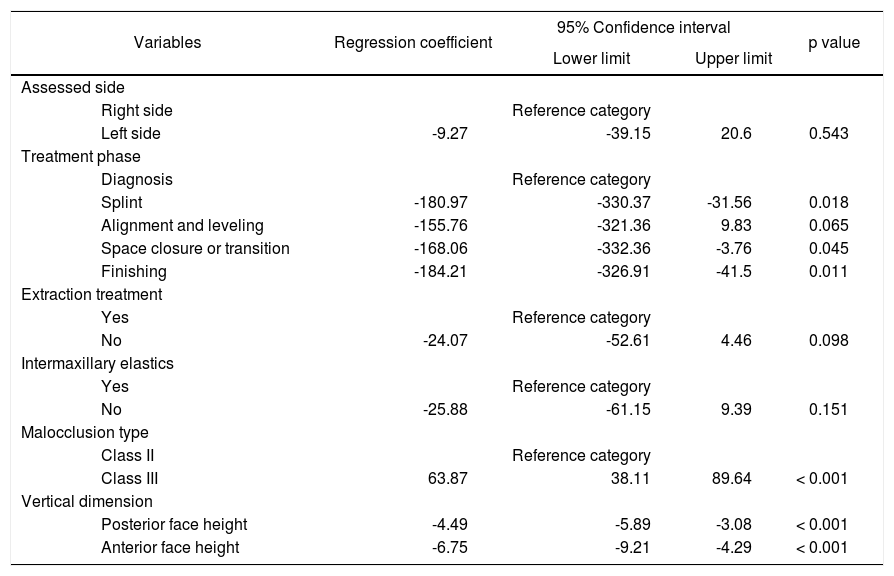
As a result of the multivariate model (Table IIITable III) it was possible to identify a decrease of 180.97 microvolts (95% -330.3, -31.56; p = 0.018) in muscle activity associated with the phase of physiological splint; a mean decrease of -168.0697 microvolts (95% -332-36, -3.76; p = 0.018) in the space closure or transition phase and during the finishing phase, -184.21 microvolts (95% CI -326.91, 5.633; p = 0.011) compared with the muscle activity recorded at basal measurement. Likewise, it was possible to identify that class III patients had a mean electromyographic activity of 63.87 microvolts (95% CI 38.11, 89.64; p < 0.001) more than class II patients. With respect to the vertical dimension it was observed that for every millimeter that the posterior or anterior facial height increased, the electromyographic activity of the masseter muscles surface decreased on average -4.49 microvolts (95% CI -5.89, 24.817; p < 0.001) and -6.75 microvolts (95% CI -9.21, -4.29; p < 0.001). In contrast, there was no statistically significant difference between the right and left sides, between extraction and non-extraction treatments and whether intermaxillary elastics were used or not during treatment.
Results of the random effects multivariate regression model.
| Variables | Regression coefficient | 95% Confidence interval | p value | |
|---|---|---|---|---|
| Lower limit | Upper limit | |||
| Assessed side | ||||
| Right side | Reference category | |||
| Left side | -9.27 | -39.15 | 20.6 | 0.543 |
| Treatment phase | ||||
| Diagnosis | Reference category | |||
| Splint | -180.97 | -330.37 | -31.56 | 0.018 |
| Alignment and leveling | -155.76 | -321.36 | 9.83 | 0.065 |
| Space closure or transition | -168.06 | -332.36 | -3.76 | 0.045 |
| Finishing | -184.21 | -326.91 | -41.5 | 0.011 |
| Extraction treatment | ||||
| Yes | Reference category | |||
| No | -24.07 | -52.61 | 4.46 | 0.098 |
| Intermaxillary elastics | ||||
| Yes | Reference category | |||
| No | -25.88 | -61.15 | 9.39 | 0.151 |
| Malocclusion type | ||||
| Class II | Reference category | |||
| Class III | 63.87 | 38.11 | 89.64 | < 0.001 |
| Vertical dimension | ||||
| Posterior face height | -4.49 | -5.89 | -3.08 | < 0.001 |
| Anterior face height | -6.75 | -9.21 | -4.29 | < 0.001 |
Based on the results of the study it was possible to identify a differential behavior throughout the different phases of orthodontic treatment in relation to the activity recorded before the start of treatment. For example, there was a decrease in electromyographic activity associated with the use of physiological splint, space closure or transition and at the finishing stage of the case.
The results of this study suggest that the muscular activity of the superficial masseter muscles does not have a tendency towards decrease or normalization of the electromyographic activity as it is assumed in a widespread manner between orthodontists. In contrast there are periods of variation that suggest that muscular activity is normalized or decreases when the occlusal contacts are distributed more evenly as it occurs when using the physiological splint or in the finishing stages of the case, where the best occlusal settlement is expected to be achieved. The latter finding coincides to what has been reported in other investigations regarding the use of the physiological splint or regarding occlusal stability after orthodontic treatment. There are not many studies available to study the changes in muscular activity subsequent to orthodontic treatment and as far as we know there is no study that reports more than five measurements of electromyographic activity throughout the different phases of orthodontic treatment. Similarly it is important to note that in this study it was possible to make adjustments for other clinical characteristics of the patients such as skeletal class, vertical dimension, treatment with extractions and use of elastics.
One of the strengths of the study is that it is prospective and the main limitation is the small sample size, however, even though the number of patients is small, the unit of analysis is the electromyographic activity recorded every 0.002 seconds so the measurements represent more than 3 million analyzed values which increases the statistical power to identify differences between the stages or phases of treatment. Another strength is that most of the previous studies only report Pearson or Spearman correlations and none has reported a repeated measurements analysis using the individual as a conglomerate that adjusts by measuring the covariance of the interand intra-individual measurement along repeated measurements. In other words it represents that it is considered that the right and left measurements come from the same individual and several measurements of that individual which decreases the possible error of reporting results attributed more to the electromyographic activity associated with the phase of treatment when in fact it represents a bias due to an unusual activity in certain individuals that leads to reporting biased results and from them, obtain the wrong conclusions.
One of the main limitations of the study is the diversity of treatment plans. The use of various bracket prescriptions increases the variability and makes it impossible to determine the effect of different philosophies of treatment on stability, standardization or changes in electromyographic activity of the masseter muscles throughout treatment. On the other hand, in spite of the strengths of the study it is necessary to perform a study with a bigger sample size with the aim of assessing if the results of the study are reproducible and consistent in other populations.
CONCLUSIONSBased on the results of the study, it is possible to identify that there are changes in muscular activity associated with different stages of treatment, which contrasts with the popular belief of an adaptation of the muscle activity throughout treatment. The results derive from a pilot study so that there is a need for further large-scale studies with the aim of generating more evidence on the subject.
Funding
This project was financed by the Proyecto PAPIIT: IT201817, UNAM.