

To describe the distribution of the central corneal thickness (CCT) measurements on a healthy Hispanic sample population and its correlation with age, mean simulated keratometry (SimK), and mean refractive spherical equivalent (MRSE).
MethodsRetrospective analysis on the records of healthy patients from the Ophthalmology and Visual Sciences Institute, Tecnologico de Monterrey, January 2015 to August 2015. CCT data, age, gender, corneal curvature, and spherical equivalent was obtained. A descriptive analysis and correlation by the Spearman method was performed. The sample was divided by age subgroups: <20 years old, ≥20 and ≤40 years, and >than 40 years old and correlation analysis with CCT values was determined.
ResultsA total of 93 (186 eyes) patients were included. Mean age: 32.54±12.04 years. 43% were women. Mean CCT: 545.69±36.88μm, mean SimK: 43.56±1.90D and MRSE: −2.54±3.15D. No correlation was registered between CCT and the variables when analyzed with the Anderson–Darling (p=0.006), Shapiro–Wilk (p=0.043), and Kolmogorov–Smirnov (p=0.01). CCT showed a bimodal distribution with higher density at 540μm. Age groups <20 and >40 years showed significant difference in CCT (p=0.016), a positive correlation with CCT was observed in the group <20 (ρ=0.596, p=0.001).
ConclusionsThe findings regarding the lack of normality, the bimodal distribution (540μm), and the correlation between age and CCT in younger patients, may lead us to redefine the “normal” CCT value in our population in order to be used properly for clinical purposes.
Describir la distribución de las mediciones del grosor central corneal (GCC) en una población sana de hispanos y analizar su correlación con la edad, queratometría simulada promedio (SimK) y el equivalente esférico refractivo (EE).
MétodosAnálisis retrospectivo, pacientes sanos del Instituto de Oftalmología y Ciencias Visuales, Tecnológico de Monterrey (enero de 2015 a agosto de 2015). Se obtuvo GCC, edad, género, SimK y EE. Se realizó análisis descriptivo de las variables y se utilizó el método de Spearman para correlaciones. La muestra se dividió en 3 subgrupos (<20 años, ≥20 y ≤40, y>40 años) para analizar la correlación entre GCC y edad.
ResultadosSe incluyeron un total de 93 pacientes (186 ojos). Edad promedio: 32.54±12.04 años, 43% mujeres. GCC promedio: 545.69±36.88μm, SimK promedio: 43.56±1.90 D y el EE promedio: -2.54±3.15 D. No había correlación entre GCC y edad, género, SimK o EE con análisis Anderson-Darling (p=0.006), Shapiro-Wilk (p=0.043) y Kolmogorov-Smirnov (p=0.01). GCC mostró distribución bimodal, pico principal en 540μm. Los subgrupos <20 años y >40 años, mostraron diferencia significativa (p=0.016) al comparar GCC. Se observó correlación positiva entre grupo <20 años y GCC (ρ=0.596, p=0.001).
ConclusionesLa falta de normalidad en la distribución del GCC, la distribución bimodal (540μm) y la tendencia a observar mayor GCC en jóvenes, llevan a redefinir los valores «normales» de GCC en nuestra población, con la finalidad de ajustar su uso para propósitos clínicos.
Central corneal thickness (CCT) is one of the major parameters for measuring corneal health.1,2 Its measurement is essential in the assessment, management and follow up of corneal ectatic diseases (i.e. keratoconus, post-LASIK ectasia) and corneal endothelium dysfunction, since the changes in the corneal thickness are directly associated with the severity of the disease.3–6 CCT measurement is also essential in the management of glaucoma patients, given that applanation tonometry underestimates the intraocular pressure (IOP) in eyes with thin corneas and it overestimates this in thick corneas.7,8 CCT has also been used as a predictor of graft survival and cell density measurement after penetrating keratoplasty, thicker corneas have shown a tendency to develop graft failure within 5 years post-surgery.3 Thin corneas, along with low residual stromal bed thickness (<300μm), deep ablation and abnormal corneal topography, have been considered as preoperative risk factors in corneal refractive surgery for developing corneal ectasia.9–11 However, there is ongoing debate surrounding the precept that “thinner” corneas are indeed “weaker” corneas with biomechanical liability, since the influence of CCT over the long-term stability of LASIK procedures has not been demonstrated.12,13
Normal CCT values have been established by different research groups.7 However, a large variability among different ethnic groups has been reported.14–17 Age,7,18,19 gender,20 the transition from lower to higher humidity, UV radiation exposure, hereditability,21,22 genetics,23,24 altitude have also been associated with changes and variability in CCT.25,26 Additionally, the correlation of different ocular parameters with CCT has been studied, including corneal radius and curvature,27 anterior chamber depth, axial length,28 the spherical equivalent,29 visual acuity, and IOP.30
All the factors mentioned before and the controversial results regarding the use of CCT as a predictive parameter for different ocular procedures indicate that the “normality” concept for CCT needs to be re-evaluated so it can be used appropriately as a clinical parameter. In this study, we aimed to measure the CCT among healthy Hispanic patients, and to determine its correlation with age, gender, curvature, and spherical equivalent.
Materials and methodsA retrospective analysis of pachymetric measurements conducted between February 2012 and November 2012 at the Ophthalmology and Visual Sciences Institute (Tecnologico de Monterrey, School of Medicine, Monterrey, Mexico) was performed. Data from 93 healthy patients were obtained after calculating the optimal sample size using Raosoft® (Raosoft, Inc., Seattle, WA, USA) with a confidence interval (CI) of 90% and an error margin of 5% in a population of 600 patients. Patients with abnormal topography (inferior steepening, irregular pattern, non-orthogonal bowtie), contact lens users or with history of refractive surgery were excluded. The CCT was obtained using ultrasonic pachymetry (AccuPach VI; Accutome, Inc., Malvern, PA, USA). Briefly, the cornea was anesthetized with topical 1% tetracaine and the patient was asked to adopt a face up position on the examination chair and solicited to fixate a target on the ceiling. The pachymeter probe was brought in contact with the cornea centrally and perpendicularly over the visual axis. CCT was recorded as the average of 9 consecutive acquisitions. This process was repeated for every individual CCT measurement.
Age, gender, mean simulated keratometry (SimK) (Orbscan II Software version 4.1, Bausch&Lomb, Rochester, NY, USA), and spherical equivalent data were also obtained. Patients with any ocular or corneal pathology as well as history of ocular surgery were excluded. Patients with diagnosis of cataract, but who did not have surgery, were included. Statistical analysis was performed using IBM SPSS® version 21 (IBM Corporation, Armonk, NY, USA). A descriptive analysis and Spearman's correlation of the variables were performed. The mean of the CCT values and their distribution were established via the Anderson–Darling, Shapiro–Wilk, and Kolmogorov–Smirnov tests. The sample was divided by the following age groups: <20 years, ≥20 and ≤40 years, and >than 40 years to perform a descriptive and comparative analysis by analysis of variance (ANOVA), as well as to conduct an independent samples t-test.
ResultsA total of 93 patients (186 eyes) were included in the study, 43% (n=40) were female. The mean age of the patients was 32.54±12.04 years (range 21–54 years). The mean keratometry was 43.56±1.90 diopters (D) and the mean spherical equivalent was −2.54±3.15D.
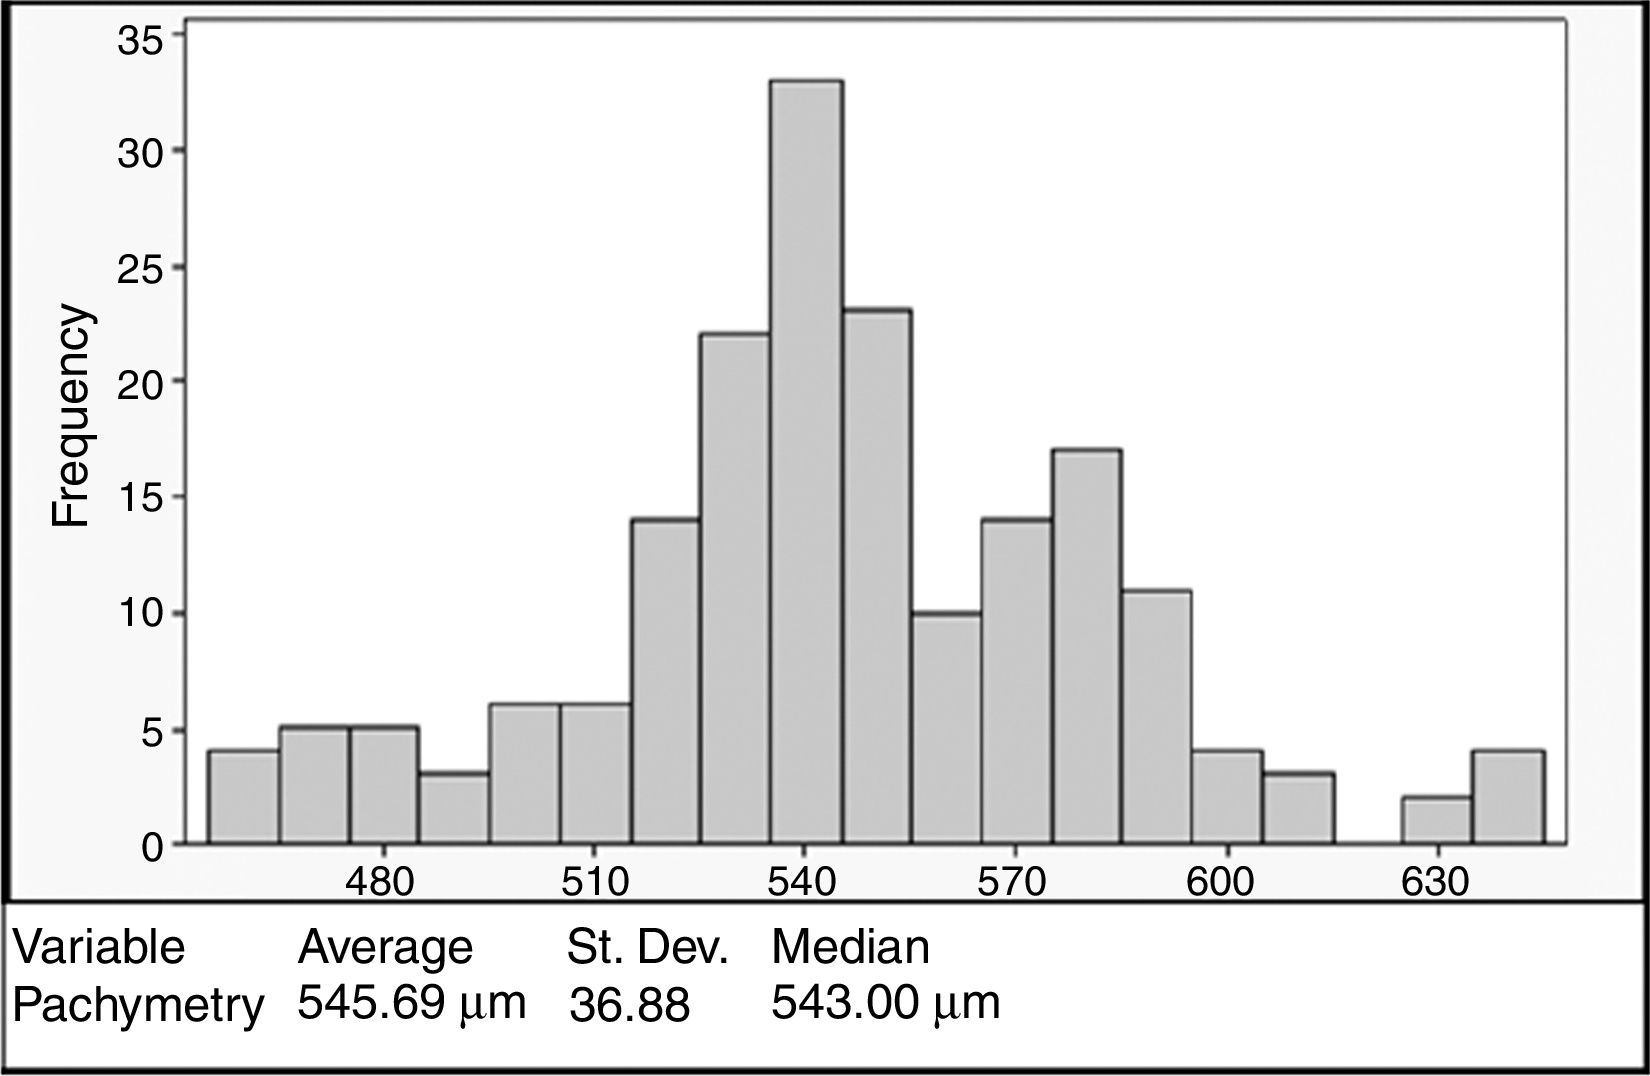
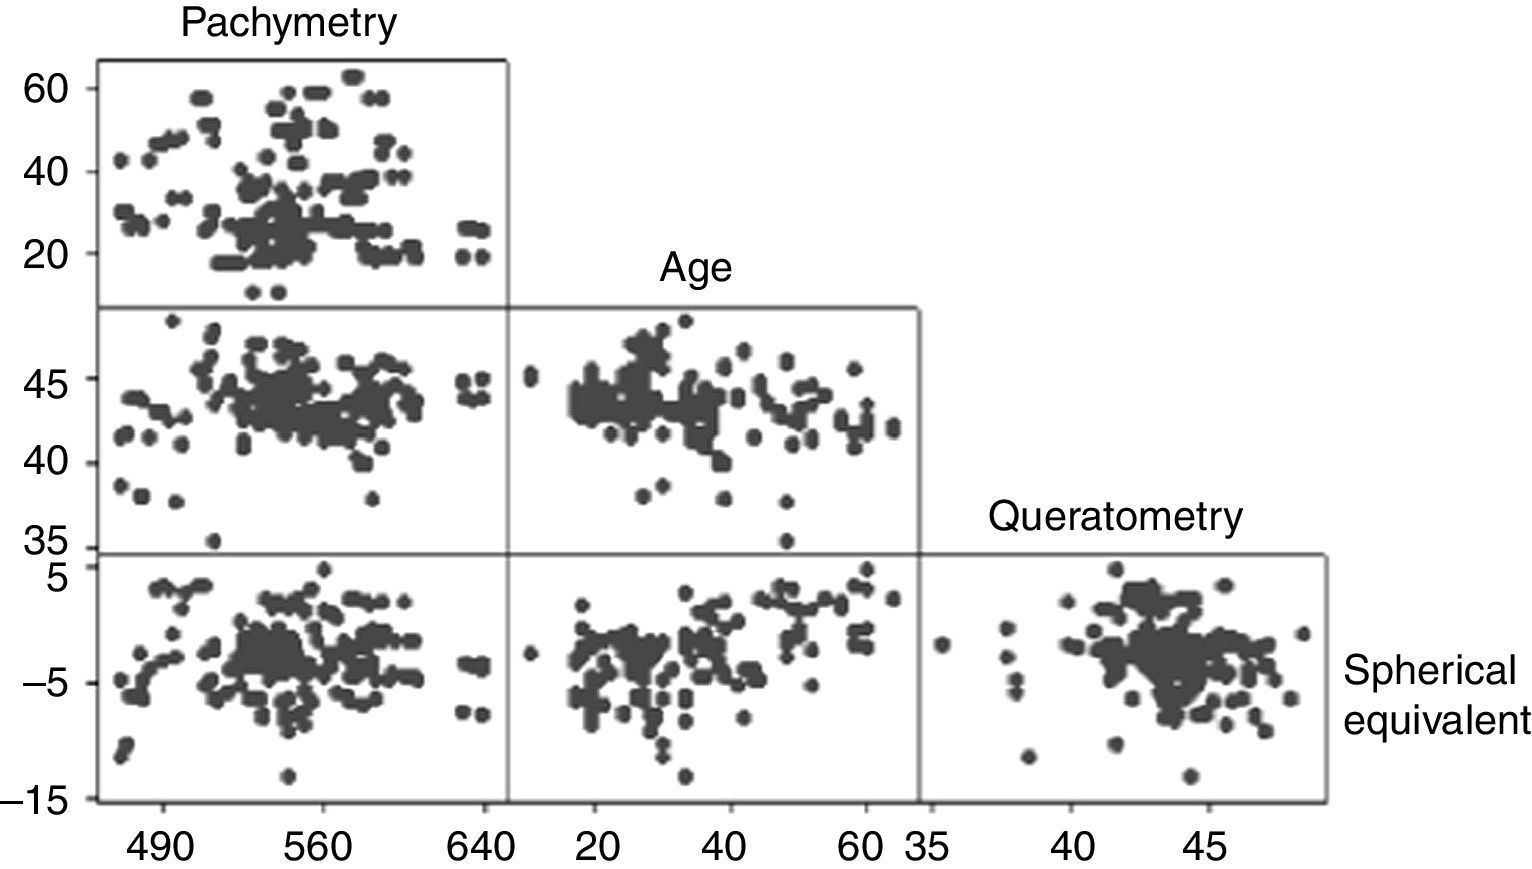
The mean CCT was 545.69±36.88μm (range 458–640μm). The CCT showed a bimodal distribution with the first peak occurring at 540μm and the second at 580μm (Fig. 1). No association was observed between the pachymetry measurements and the mean keratometry, spherical equivalent, and age when analyzed with the Anderson–Darling (p=0.006), Shapiro–Wilk (p=0.043), and Kolmogorov–Smirnov (p=0.01) tests. Pearson's test showed a correlation of −0.08 between pachymetry and age, 0.099 between pachymetry and keratometry, and 0.033 between pachymetry and the spherical equivalent. The correlation between age and keratometry was −0.259 and the correlation between age and the spherical equivalent was −0.2 (Fig. 2).


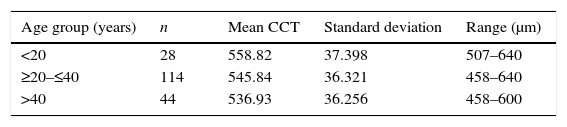
The sample was divided in three age groups: <20 years, from 20 to 40 years, and >40 years (Table 1). Although the mean CCT for the group <20 years was 558.82±37.398μm, 42.8% (n=12) of the eyes in this group had a CCT ≥580μm, while 14.4% (n=17) and 14.2% (n=6) of the eyes in the groups from 20 to 40 years and over 40 years had CCT ≥580μm. The mean CCT between age groups <20 years and >40 years showed a significant difference (p=0.016). No difference was detected between the age groups <20 years and 20–40 years (p=0.094), and >40 years (p=0.17). A positive correlation with CCT was observed in the group <20 years (ρ=0.596, p=0.001), a negligible correlation between CCT and age was detected in for the age group ≥20 and ≤40 years (ρ=0.091, p=0.326) and a non-significant positive correlation in the group over 40 years (ρ=0.255, p=0.103).
DiscussionCCT is a critical parameter in the assessment of IOP in glaucoma patients, and its measurement is also compulsory in patients undergoing corneal refractive surgery and during the postoperative follow up of corneal transplant. It is known that CCT values vary between ethnic groups, and that there are several factors either extrinsic (i.e. UV radiation, altitude, humidity) and intrinsic (age, gender, ethnicity, hereditability and genetics) have an effect influence it.17,22,24,25,31,32
We observed an average CCT of 545.69±36.88μm, similar to that of previous studies conducted with Hispanic subjects. Hahn et al.19 in 2003 reported a mean CCT of 546.9μm; Erickson et al.33 in 2010 obtained a mean CCT of 541.8μm; and recently, Valbon et al.34 found a CCT of 547.5μm. Our sample also exhibited a wide range of CCT values (ranging from 458 to 640μm), this was superior to the ranks reported by Hahn et al. (479.7–613.4μm) and Valbon et al. (490–647μm). Additionally, our results showed a bimodal distribution with the first peak reflecting the mean CCT for the whole sample (545.69μm) and the second peak attributed to the eyes (n=35) with thick corneas (CCT ≥580μm), primarily at the expense of the younger group of patients <20 years (42.8%). Other authors have made similar observations with regard to a trend over a higher prevalence of thicker corneas in younger ages.27,35
The wide range of CCT values, as well as the high frequency in values around 540μm, might lead us to redefine the concept of “normality” for corneal thickness in our population. Frequently, corneas below 510μm are considered as thin and, and therefore as corneas with biomechanical liability or weakness for excimer laser refractive procedures (LASIK, PRK).10–12,36,37 However, there is increasing evidence with regards to the safety and effectiveness of LASIK surgery in patients with CCT values <500μm.13,38,39 Since collagen tension disruption affects corneal biomechanics in refractive surgery,40,41 this contradictory evidence leads us to believe that there are other factors that impact corneal structural stability independently of CCT. In this respect, it has been suggested that ultrastructural changes observed in ectatic corneas are related to mechanical stress, which leads to greater modifications in collagen fibrils and not directly to the CCT.42,43 Hence, in order to consider a cornea as “normal”, the entire topography (topographic pattern, pachymetry map and elevation maps) along with the expected CCT for a given population, should be taken into account.
In agreement with other reports,28,29 we did not observe a correlation between CCT and the variables age, keratometry, and spherical equivalent. However, when the population was subdivided into age groups, a significant difference was noticed between the CCT of individuals under 20 years and those over 40 years. Younger patients registered thicker corneas with a mean difference of 20μm from those patients over 40 years, and a positive correlation was observed for both groups (only significant for the group <20 years). This is in accordance with numerous studies that have reported decreasing values of CCT in relation to older age.14,44 In a meta-analysis that included populations from different ethnicities, Doughty and Zaman,7 reported an inverse relationship between age and CCT for non-white population. This age/CCT correlation could be explained by the decrease in interfibrillar spacing due to age-related non-enzymatic crosslinking, which has been suggested to cause reductions in stromal thickness.35,45
ConclusionA bimodal distribution in the CCT was observed in this cross-sectional study, with the first peak at 540μm and a second minor peak at 580μm, the latter attributed mainly to younger patient measurements. No association between age, corneal curvature and spherical equivalent was observed, but when analyzed by age groups a positive correlation was detected for age group <20 years and age group >40 years. To our knowledge, this is the first study that describes pachymetric values and their correlation with other factors in this specific population. The findings regarding the lack of normality, the higher frequency of the samples in the first peak, and the relationship between age and decreasing CCT, may lead us to redefine the “normal” pachymetric parameters in our population so they can be used properly for clinical purposes.
Ethical disclosuresProtection of human and animal subjectsThe authors declare that no experiments were performed on humans or animals for this investigation.
Confidentiality of dataThe authors declare that no patient data appears in this article.
Right to privacy and informed consentThe authors declare that no patient data appears in this article.
FundingNo endorsement of any kind received to conduct this study/article.
Conflict of interestThe authors declare no conflicts of interest.
English-language editing of this manuscript was provided by Journal Prep.
Partial results of this research have been presented as a poster at ARVO, May 5, 2013, Seattle, WA.
