

The distribution patterns of the freshwater fish within Tabasco wetlands have not being yet studied at a regional scale. We implemented an ecological niche modeling approach to: 1) identify the potential richness distribution patterns of native fish; 2) evaluate the relative importance of climatic and topographic variables in fish distribution, and 3) analyze if the natural protected areas correspond to areas with higher potential species richness. We used occurrence records of 41 native fish species and 22 interpolated surfaces that represent topographic features and annual, seasonal and extreme trends of temperature and precipitation to generate niche-based potential geographic distribution maps using the GARP and MaxEnt algorithms. Our results show that habitat affinities can be detected at the regional scale using macro-climatic and topographic variables. Despite the apparent evenness of the system, species’ distributions were not homogenous at the regional scale. The classification tree analysis showed that the mean temperature of the driest quarter was the most influential variable for clustering species. We found that areas with the highest potential species richness are not included in the natural protected areas network. This information can be used for the development of new and better native fish conservation strategies, like expanding the current ones or establishing new natural protected areas.
Los patrones de distribución de los peces dulceacuícolas de los humedales de Tabasco no han sido estudiados a escala regional. En este estudio, obtuvimos modelos de nicho ecológico para: 1) identificar los patrones de distribución potencial de riqueza de peces nativos; 2) evaluar la importancia relativa de las variables climáticas y topográficas en su distribución y 3) analizar si las áreas naturales protegidas coinciden con las áreas de mayor riqueza potencial. Utilizamos registros de presencia de 41 especies de peces nativos y 22 superficies interpoladas que representan las características topográficas y las tendencias anuales, estacionales y extremas de temperatura y precipitación para generar mapas de distribución potencial basados en los algoritmos GARP y MaxEnt. Nuestros resultados muestran que las afinidades de hábitat pueden ser detectadas a escala regional utilizando variables macroclimáticas y topográficas. A pesar de la aparente uniformidad del sistema, la distribución de especies no fue homogénea a escala regional. El análisis de árbol mostró que la temperatura media del trimestre más seco es la variable más influyente en el agrupamiento de especies. Además, las áreas con mayor riqueza potencial no están incluidas en la red de áreas naturales protegidas. Esta información puede utilizarse para desarrollar nuevas y mejores estrategias de conservación de peces, como la ampliación o el establecimiento de nuevas áreas naturales protegidas.
Ecological niche modeling is a useful tool in biogeography, ecology and conservation, and it has been used to predict potential geographic distributions in terrestrial and aquatic species at different scales (Contreras, Martínez-Meyer, Valiente, & Zambrano, 2009; McNyset, 2005; Peterson et al., 2011). Fish distribution modeling can be used to develop conservation programs and address questions regarding invasive fish species and their capacity for dispersion (Chen, Wiley, & Mcnyset, 2007; McNyset, 2005; Zambrano, Martínez-Meyer, Menezes, & Peterson, 2006). Additionally, these models have helped researchers understand the negative effects of anthropogenic activities on native fish species distributions and ecosystems (Domínguez-Domínguez, Martínez-Meyer, Zambrano, & Pérez-Ponce de León, 2006).
Ecological niche modeling is a popular method for studying the distributional patterns of species, but it has also been used to infer the processes involved in their distribution (Jackson, Peres-Neto, & Olden, 2001; Maestre, 2006). For example, this approach has shown that survival of aquatic species within a region is partially determined by physicochemical factors, such as depth, hydraulic regime, water temperature, dissolved oxygen concentration, pH, and salinity (Matthews, 1998). However, local species occurrences can be constrained by factors operating at larger temporal and spatial scales, such as climate, dispersal barriers, and historical biogeography (Pont, Hugueny, & Oberdorff, 2005). Thus, a closer look at the environmental variables that drive species distributions can provide an ecological sense to the biogeographic patterns (Huston, 1999; Tonn, Magnuson, Rask, & Toivonen, 1990). Therefore, ecological niche modeling can be used to infer the physiological tolerances to such variables and to understand the limiting factors at a regional scale (Pont et al., 2005).
Even though environmental conditions and resources are not uniformly distributed in space, certain factors that are highly heterogeneous at the local scale may appear homogeneous at the regional scale (García, 2006; Jackson, Peres-Neto, & Olden, 2001). At regional scales, the freshwater fish distribution depends on factors such as the size of the river, surface of the drainage basin, topographical features and macro-climatic conditions (Buisson, Thuiller, Lek, Lim, & Grenouillet, 2008; Oberdorff, Guégan, & Hugueny, 1995). These factors can influence the dispersal ability of fish because they are constrained by the hydrographic network structure (Grant, Lowe, & Fagan, 2007). Previous studies have shown that macro-climatic and topographic variables can provide useful information for modeling fish species at both the landscape and regional scales (Domínguez-Domínguez et al., 2006; Kang, Deng, Huang, Chen, & Feng, 2013; Zambrano et al., 2006), and can be a good predictor of local and regional conditions (Stewart-Koster et al., 2013). However, in apparent homogeneous systems, the question of whether these variables are sufficiently sensitive to model the potential distribution of fish remains unclear. In this sense, Tabasco, the state that holds the largest wetland system in México, represents an excellent model due to its apparent environmental homogeneity and high fish species richness.
To our knowledge, no previous studies have been conducted regarding the distributional patterns of the ichthyofauna of Tabasco at a regional scale. In this apparent homogenous system we implemented an ecological niche modeling approach to: (1) identify the potential richness distribution patterns of native fish; (2) evaluate the relative importance of climatic and topographic variables in the native fish distribution; (3) analyze if natural protected areas correspond to areas with higher potential species richness.
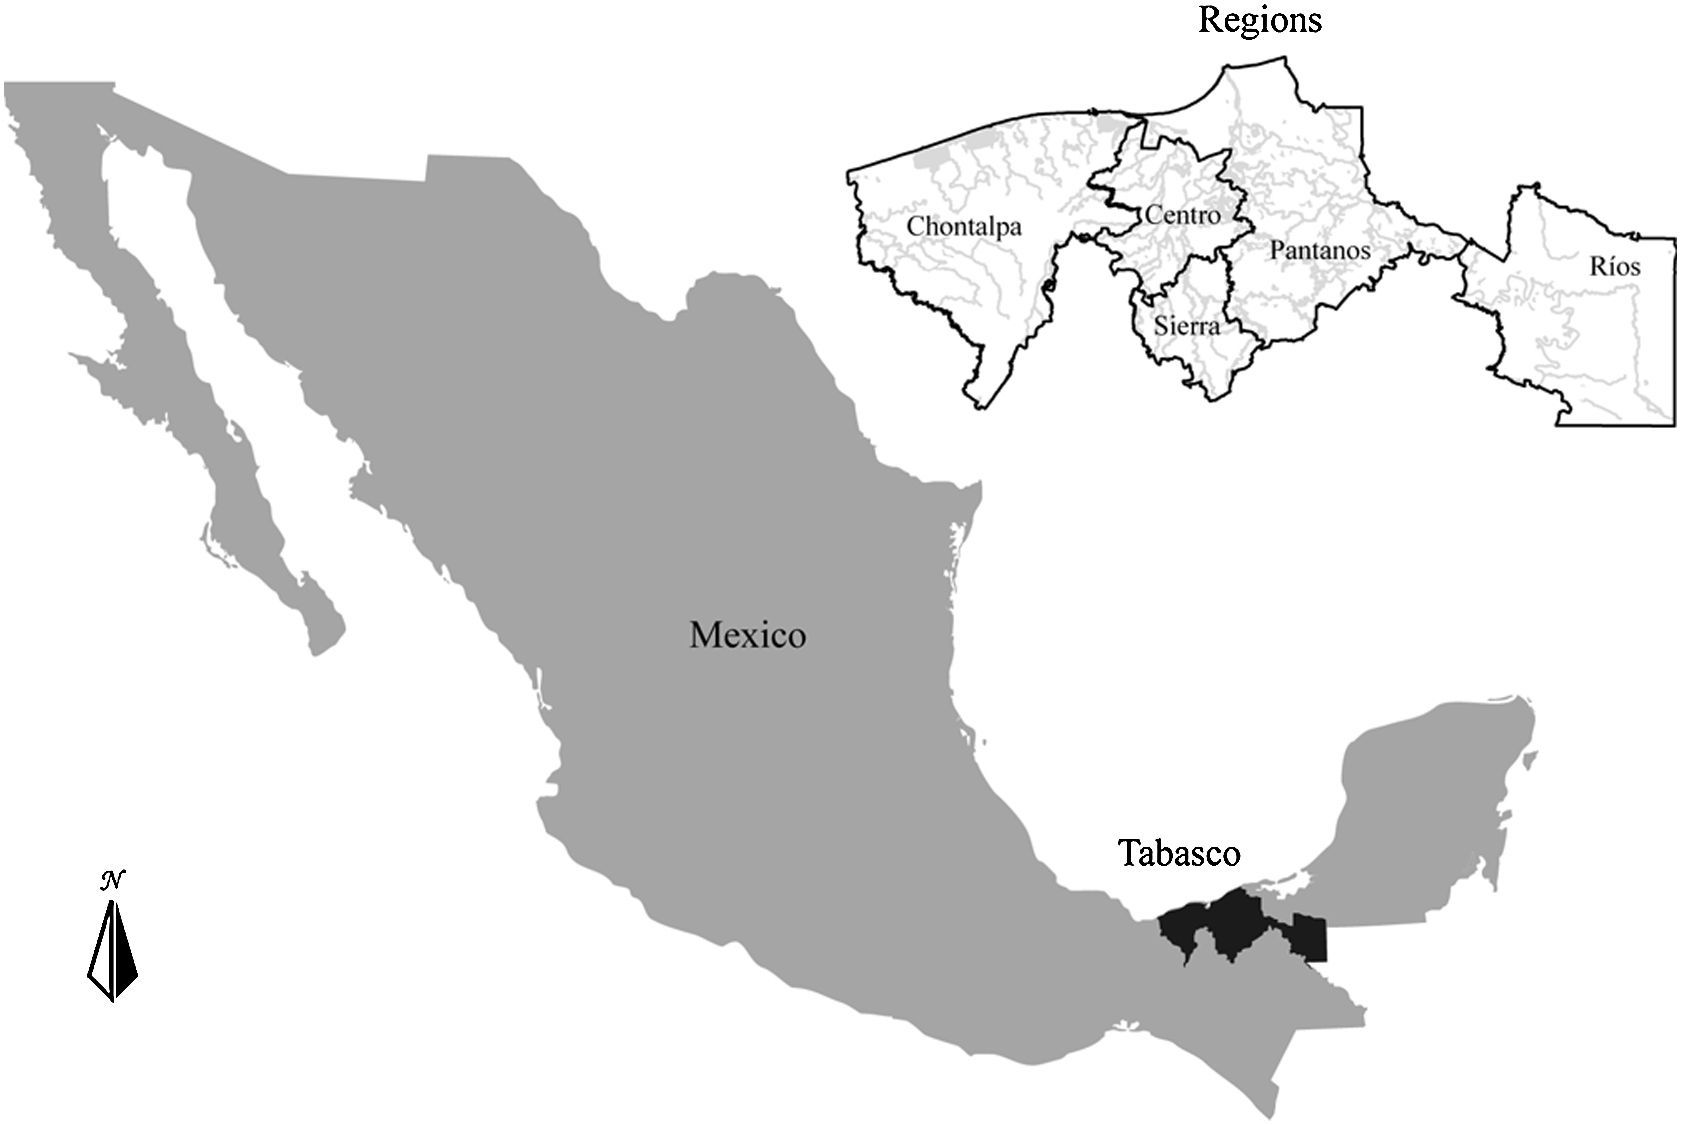
Materials and methodsThe State of Tabasco (24,661km2) is located in southeastern Mexico in the coastal plain of the Gulf of Mexico (Fig. 1). It has a uniform and mainly flat topography, with a small elevation (most hills do not exceed 30masl), a mean annual temperature of 27°C and an average annual precipitation of 2,550mm, with a maximum of 4,000mm (Velásquez-Villegas, 1994). This region contains 53% of the country wetlands area. This coastal wetland is produced by the confluence of 2 major rivers, the Grijalva, and the Usumacinta. These rivers generate a system of marshes, deltaic plains, estuaries and lagoons, where at least 95 species of fish coexist (Barba-Macías, Rangel-Mendoza, & Ramos-Reyes, 2006; Inegi, 1986; Sánchez & Barba, 2005). Furthermore, the 2 rivers have their own dynamics and are strongly influenced by rain seasonality and basin processes and thus produce a complex hydrologic system.

Since the 17th century, human settlements and activities have dealt with recurrent floods by modifying the natural dynamics of rivers and altering their intensity, length and inundation cycles (Sánchez & Barba, 2005). These alterations have produced habitat fragmentation and reduced the connectivity with unknown, but likely deep consequences to fish distribution (Sánchez & Barba, 2005). Tabasco can be classified in 5 regions based on morphological, hydrologic and socio-economic variables: Centro, Pantanos, Sierra, Chontalpa, and Ríos (Fig. 1). Centro is the smallest region, covering 7% of the state, but it has the highest human population density. Sierra covers 16% of the state and has both the highest elevations (above 1,000m asl) and the highest annual average rainfall (3,711mm). Chontalpa is located at the western part of the state and occupies 34% of the territory. Pantanos covers 38% of Tabasco and includes the Pantanos de Centla Biosphere Reserve, which has an area of 302,706ha and represents 12.27% of the total area. Finally, Ríos occupies 42% of the state and is almost completely flat (less than 40m asl). This region comprises part of the water network of the Usumacinta River system.
Data collectionFrom the 95 species of continental fish reported for Tabasco, we modeled only the species that presented at least 4 unique occurrence records, which was the limit for producing informative models based on previous testing. After excluding exotic species, a total of 41 native species were modeled (Table 1). The occurrence data were obtained from the Global Biodiversity Information Facility (GBIF, 2009) and from the following scientific collections: Colección Nacional de Peces (CNPE), UNAM, Colección Nacional de Peces Dulceacuícolas de México (ENCB-IPN), Colección de Peces de Chiapas – El Colegio de la Frontera Sur, Unidad Villahermosa and Departamento de Aprovechamiento y Manejo de Recursos Acuáticos (DAMRA). The number of occurrence records per species ranged from 4 to 85.
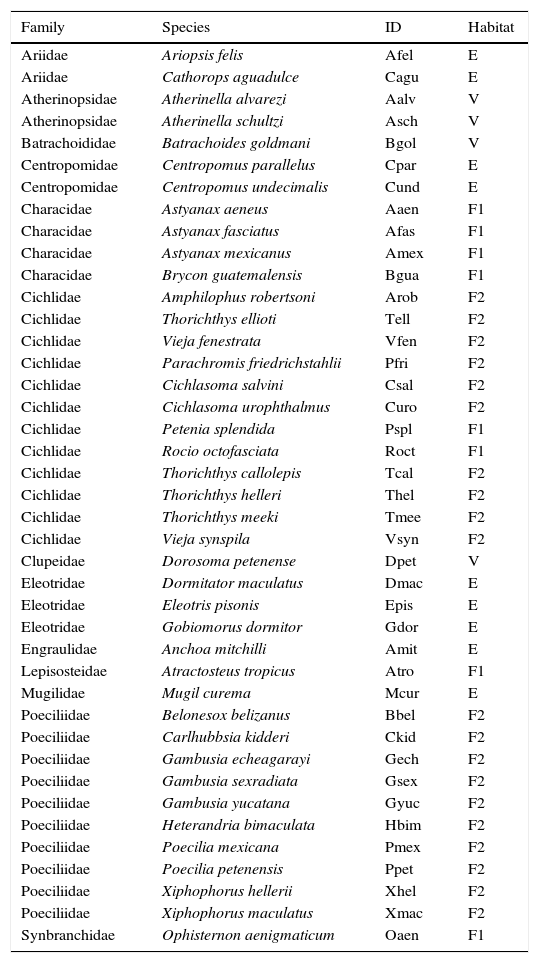
Native fish species analyzed in this study and their habitat.
| Family | Species | ID | Habitat |
|---|---|---|---|
| Ariidae | Ariopsis felis | Afel | E |
| Ariidae | Cathorops aguadulce | Cagu | E |
| Atherinopsidae | Atherinella alvarezi | Aalv | V |
| Atherinopsidae | Atherinella schultzi | Asch | V |
| Batrachoididae | Batrachoides goldmani | Bgol | V |
| Centropomidae | Centropomus parallelus | Cpar | E |
| Centropomidae | Centropomus undecimalis | Cund | E |
| Characidae | Astyanax aeneus | Aaen | F1 |
| Characidae | Astyanax fasciatus | Afas | F1 |
| Characidae | Astyanax mexicanus | Amex | F1 |
| Characidae | Brycon guatemalensis | Bgua | F1 |
| Cichlidae | Amphilophus robertsoni | Arob | F2 |
| Cichlidae | Thorichthys ellioti | Tell | F2 |
| Cichlidae | Vieja fenestrata | Vfen | F2 |
| Cichlidae | Parachromis friedrichstahlii | Pfri | F2 |
| Cichlidae | Cichlasoma salvini | Csal | F2 |
| Cichlidae | Cichlasoma urophthalmus | Curo | F2 |
| Cichlidae | Petenia splendida | Pspl | F1 |
| Cichlidae | Rocio octofasciata | Roct | F1 |
| Cichlidae | Thorichthys callolepis | Tcal | F2 |
| Cichlidae | Thorichthys helleri | Thel | F2 |
| Cichlidae | Thorichthys meeki | Tmee | F2 |
| Cichlidae | Vieja synspila | Vsyn | F2 |
| Clupeidae | Dorosoma petenense | Dpet | V |
| Eleotridae | Dormitator maculatus | Dmac | E |
| Eleotridae | Eleotris pisonis | Epis | E |
| Eleotridae | Gobiomorus dormitor | Gdor | E |
| Engraulidae | Anchoa mitchilli | Amit | E |
| Lepisosteidae | Atractosteus tropicus | Atro | F1 |
| Mugilidae | Mugil curema | Mcur | E |
| Poeciliidae | Belonesox belizanus | Bbel | F2 |
| Poeciliidae | Carlhubbsia kidderi | Ckid | F2 |
| Poeciliidae | Gambusia echeagarayi | Gech | F2 |
| Poeciliidae | Gambusia sexradiata | Gsex | F2 |
| Poeciliidae | Gambusia yucatana | Gyuc | F2 |
| Poeciliidae | Heterandria bimaculata | Hbim | F2 |
| Poeciliidae | Poecilia mexicana | Pmex | F2 |
| Poeciliidae | Poecilia petenensis | Ppet | F2 |
| Poeciliidae | Xiphophorus hellerii | Xhel | F2 |
| Poeciliidae | Xiphophorus maculatus | Xmac | F2 |
| Synbranchidae | Ophisternon aenigmaticum | Oaen | F1 |
Habitat: primary freshwater (F1), secondary freshwater (F2), vicarian (V) and estuarine sporadic (E).
Fish species were classified based on their survival capacities at different salinity concentrations as follows: principally freshwater (F1), secondary freshwater (F2), vicarian (V) and estuarine-sporadic (E) (Briggs, 1984; Castro-Aguirre, Espinosa-Pérez, & Schmitter-Soto, 1999; Myers, 1938). Primary freshwater fish species are strictly found in freshwater systems and are physiologically intolerant to salinity (Myers, 1966). Secondary freshwater fish are mostly found in freshwater systems but have some tolerance for salty waters and are thus capable of occasional dispersal through marine environments (Myers, 1938). Vicarian fish are marine species that reproduce in estuaries (Castro-Aguirre et al., 1999). Finally, estuarine-sporadic fish are marine species that can stay in freshwater during some part of their life cycle (Castro-Aguirre et al., 1999).
In total, we used 22 interpolated environmental surfaces for Mexico. Nineteen of these surfaces represented annual, seasonal and extreme trends of temperature and precipitation during the period 1898–1995 (Téllez, Hutchinson, Nix, & Jones, 2011) and 3 topographic variables from the Hydro 1k database (USGS, 2001). All of the variables were resampled to a 0.01° (∼1km2) resolution. We analyzed the following variables: daily oscillation of temperature; annual precipitation; annual oscillation of temperature; isothermality; temperature seasonality; precipitation seasonality; annual range of temperature; mean precipitation of the wettest month; mean precipitation of the driest month; mean maximum temperature of the warmest quarter; precipitation of the wettest quarter; mean minimum temperature of the coldest quarter; precipitation of the driest quarter; precipitation of the warmest quarter; mean temperature of the wettest quarter; precipitation of the coldest quarter; mean temperature of the driest quarter; mean temperature of the warmest quarter; mean temperature of coldest quarter; elevation; slope, and topographic index.
Data analysisWe modeled niche-based potential geographic distribution maps for each species using 2 methods: the genetic algorithm for rule-set production (GARP) and maximum entropy (MaxEnt) (Phillips, Anderson, & Schapire, 2006; Stockwell & Peters, 1999). We used both algorithms because sometimes they show contrasts in performance (Elith et al., 2006; Graham et al., 2007) and it has been shown that using different approaches generally produces more reliable results (Araújo & New, 2007; González et al., 2011). In terms of species potential distribution, GARP often overpredicts and MaxEnt may overfit (Peterson, Papes, & Eaton, 2007; Phillips et al., 2006). GARP was parameterized to run 100 independent models for each species using 1000 iterations and a convergence limit of 0.01. From the totality of the models, we selected a subset of 20 with the lowest omission error and then a final subset of 10 models with intermediate size of the predicted area to avoid overprediction and overfitting (Anderson, Lew, & Townsend, 2003). The 10 best subset models were summed in a GIS resulting in a consensus map with values ranging from 0 to 10, where 0 represents areas where the species were predicted absent by all 10 models, 1 represents areas where one out of 10 models predicted the presence of the species, and so on, until 10, which are areas where all 10 models predicted the presence of the species. The consensus map was then converted into a binary map (presence/absence) using as threshold the minimum training presence value. MaxEnt was run under the default features settings, allowing extrapolation and with the raw output format to avoid the prevalence problem detected for the logistic output (Merow, Smith, & Silander, 2013). Under the raw format, MaxEnt produces a continuous map that has been interpreted as an environmental suitability score (Merow et al., 2013). This map was also converted to a binary map using the minimum training presence value as a threshold.
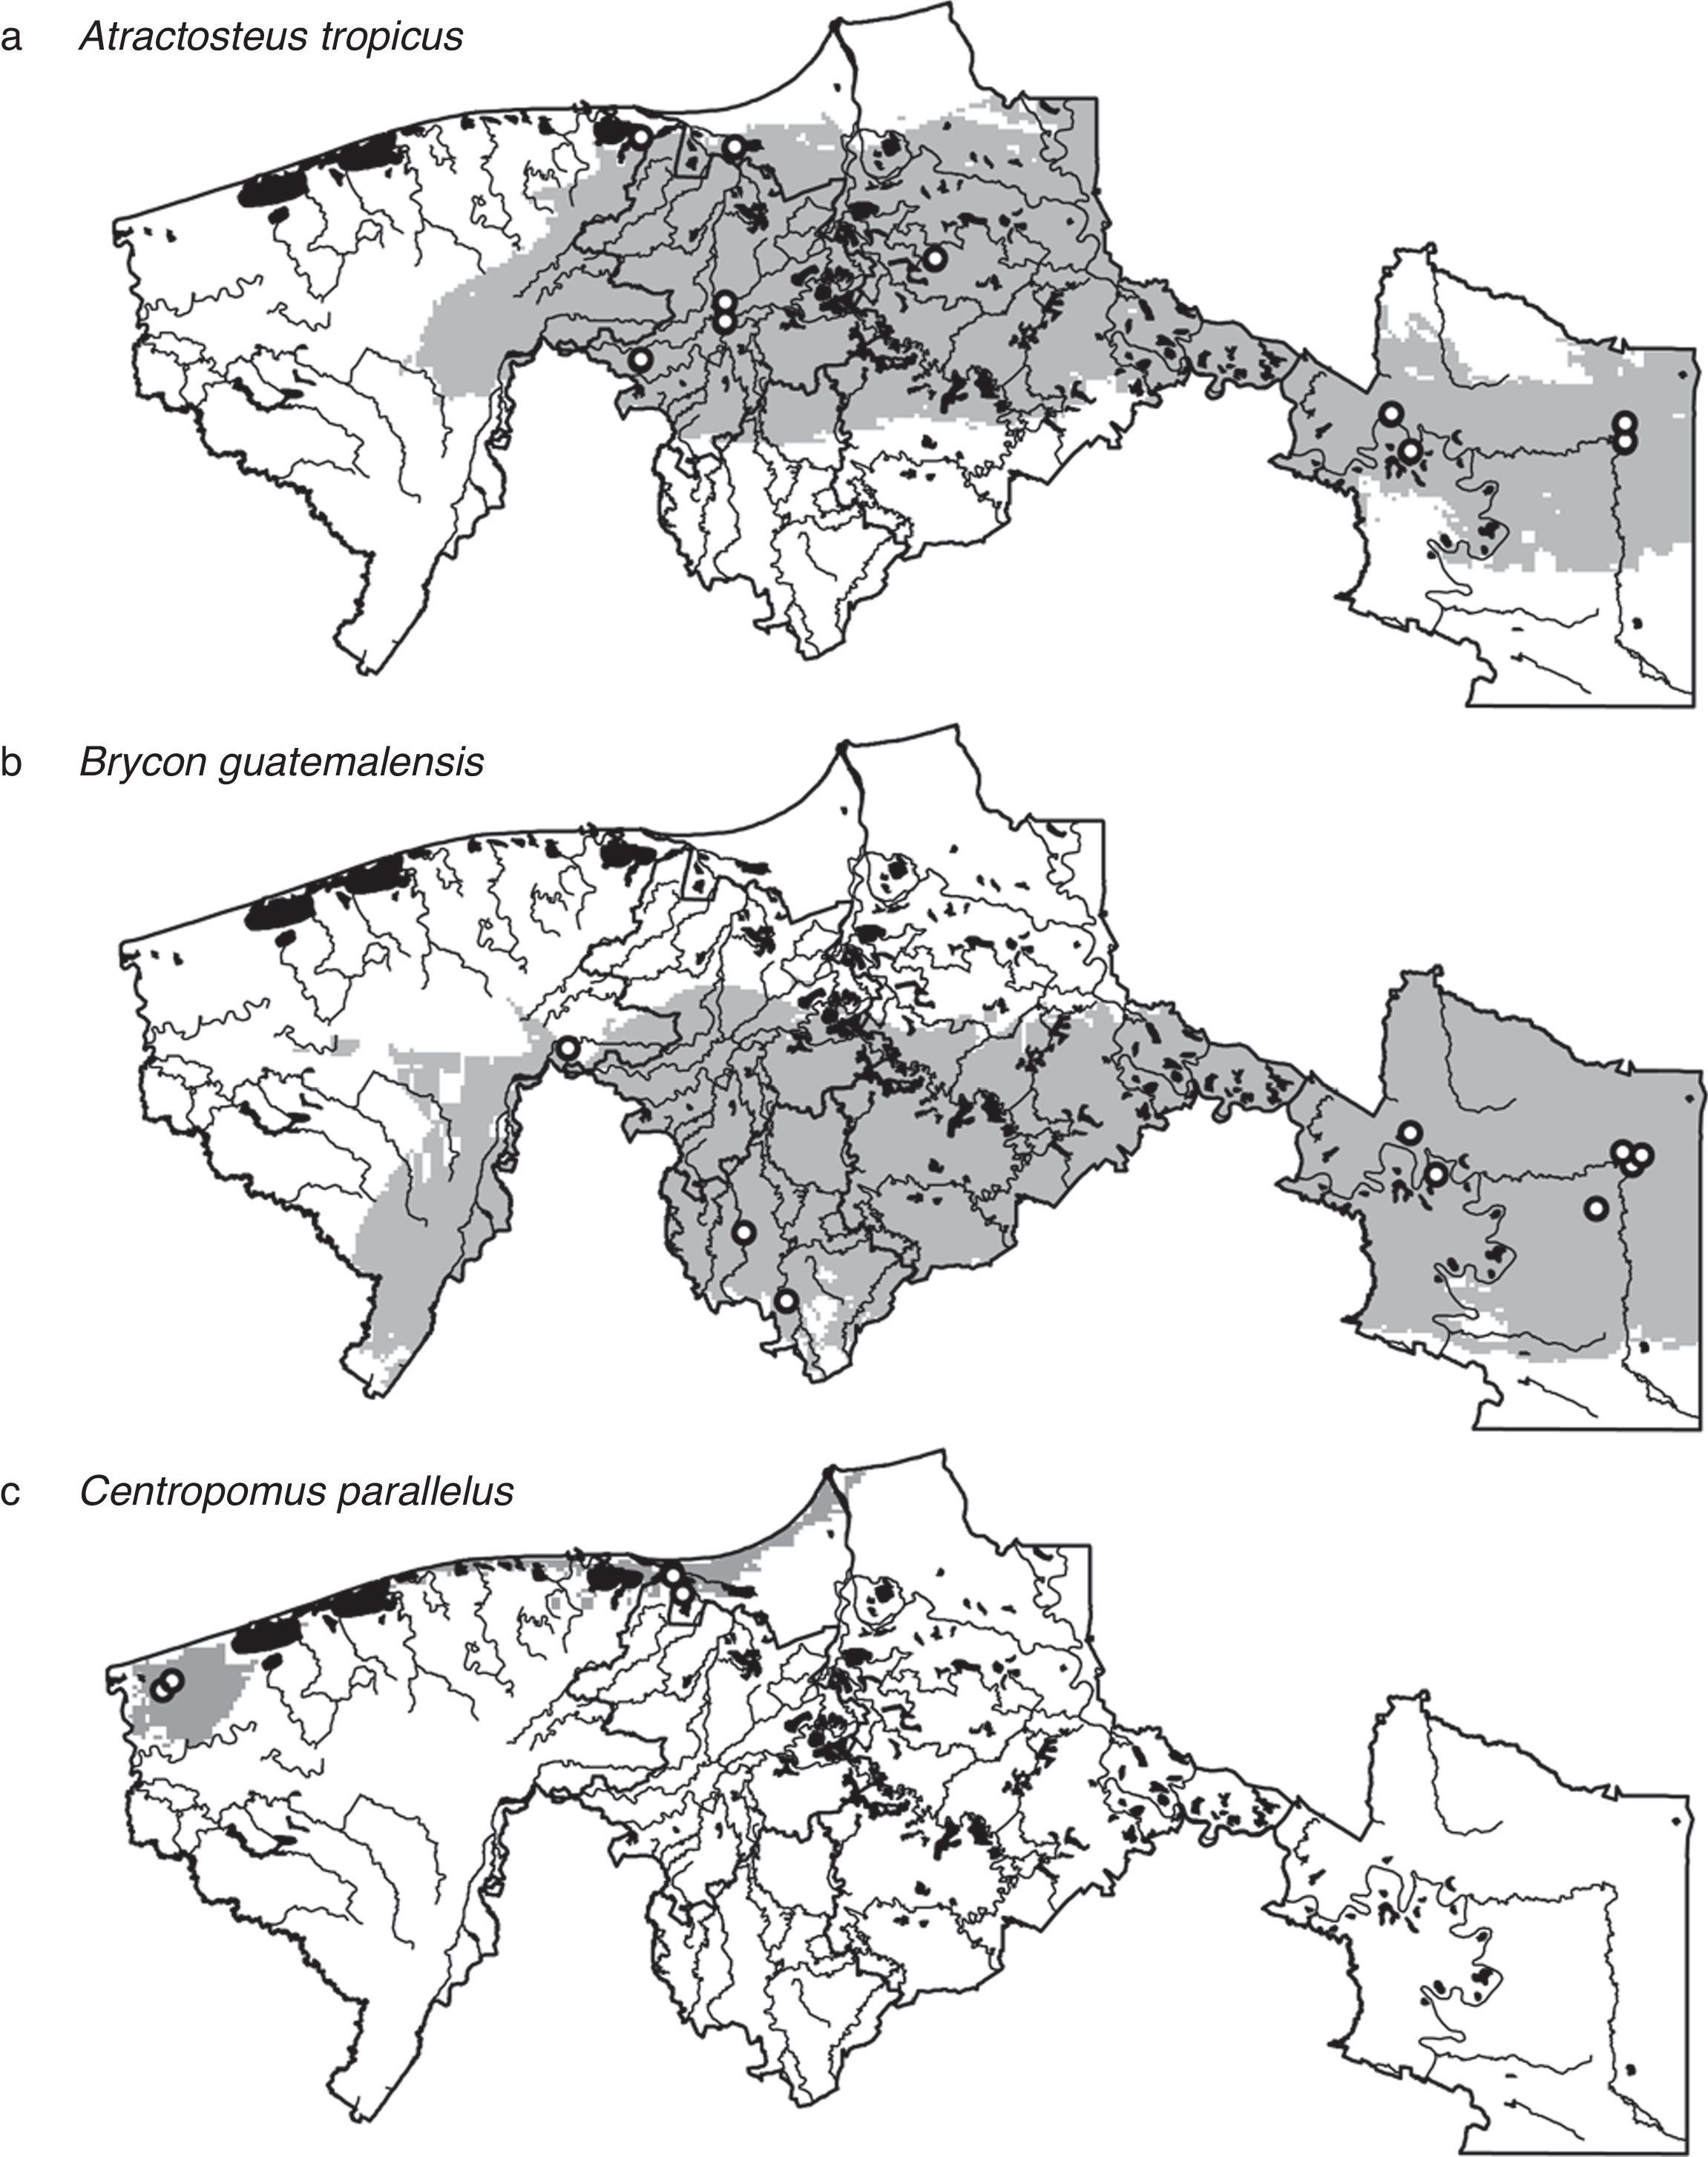
To be conservative, we considered the coincident area of the binary maps of GARP and MaxEnt as the estimated potential distribution of species (Araújo & New, 2007; González et al., 2011). We present the ecological niche model-based distributional predictions for 3 important economic and ecological species: the tropical gar (Atractosteus tropicus), the South American trout (Brycon guatemalensis) and the snook (Centropomus parallelus).
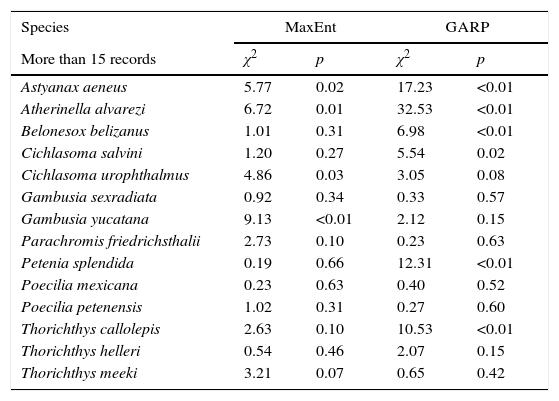
To evaluate the predictive performance of the models we divided species in 2 groups according to the number of records (more and less than 15). For species with more than 15 occurrence points we split the dataset in a 70:30 proportion for calibration and validations respectively. We applied a chi-square test for the validation data to estimate whether models predicted better than random expectations. For species with less than 15 records we implemented the jackknife method with the binomial test for small sample sizes proposed by Pearson, Raxworth, Nakamura, and Peterson (2007).
As part of the modeling process, MaxEnt identifies the relevant variables and their relative contribution to the model development. Six of the 22 variables did not achieve 6% of the contribution in any of the models and were excluded from all analyses (isothermality, mean maximum temperature of the warmest quarter, mean temperature of the wettest quarter, annual precipitation, precipitation of the wettest quarter and topographic index). We thus used the 16 most informative variables to classify species using a multivariate cluster analysis (Zuur, Ieno, & Smith, 2007). We performed a classification tree analysis to determine which variables better discriminated between the groups obtained from the cluster analysis (Thuiller, Araújo, & Lavorel, 2003; Zuur et al., 2007).
ResultsFrom the 41 species modeled, 7 were primary freshwater, 20 secondary freshwater, 4 vicarian, and 10 sporadic estuarine (Table 1). Considering both GARP and MaxEnt, the predictive performances of the models were significantly better than random in 51% of all models (Table 2). Despite the apparent homogeneousness of the system, the species’ distributions were not homogenous at the regional scale. There were widespread species, such as Atractosteus tropicus, a principally freshwater species, which occupied the whole northern region (Fig. 2a), and Brycon guatemalensis, another principally freshwater species, which occupied most of the southern portion of the system (Fig. 2b). Other species, such as Centropomus parallelus, an estuarine-sporadic species, were restricted to small areas near the northwest coast (Fig. 2c).
Predictive performance of MaxEnt and GARP models by species.
| Species | MaxEnt | GARP | ||
|---|---|---|---|---|
| More than 15 records | χ2 | p | χ2 | p |
| Astyanax aeneus | 5.77 | 0.02 | 17.23 | <0.01 |
| Atherinella alvarezi | 6.72 | 0.01 | 32.53 | <0.01 |
| Belonesox belizanus | 1.01 | 0.31 | 6.98 | <0.01 |
| Cichlasoma salvini | 1.20 | 0.27 | 5.54 | 0.02 |
| Cichlasoma urophthalmus | 4.86 | 0.03 | 3.05 | 0.08 |
| Gambusia sexradiata | 0.92 | 0.34 | 0.33 | 0.57 |
| Gambusia yucatana | 9.13 | <0.01 | 2.12 | 0.15 |
| Parachromis friedrichsthalii | 2.73 | 0.10 | 0.23 | 0.63 |
| Petenia splendida | 0.19 | 0.66 | 12.31 | <0.01 |
| Poecilia mexicana | 0.23 | 0.63 | 0.40 | 0.52 |
| Poecilia petenensis | 1.02 | 0.31 | 0.27 | 0.60 |
| Thorichthys callolepis | 2.63 | 0.10 | 10.53 | <0.01 |
| Thorichthys helleri | 0.54 | 0.46 | 2.07 | 0.15 |
| Thorichthys meeki | 3.21 | 0.07 | 0.65 | 0.42 |
| Less than 15 records | Success rate | p | Success rate | p |
|---|---|---|---|---|
| Amphilophus robertsoni | 0.78 | 0.50 | 0.78 | 0.50 |
| Anchoa mitchilli | 0.50 | 0.01 | 0.50 | <0.01 |
| Ariopsis felis | 0.33 | 0.10 | 0.00 | 1.00 |
| Astyanax fasciatus | 0.73 | 0.98 | 0.73 | 0.99 |
| Astyanax mexicanus | 0.75 | 0.03 | 0.75 | 0.03 |
| Atherinella schultzi | 0.83 | <0.01 | 0.83 | <0.01 |
| Atractosteus tropicus | 0.75 | <0.01 | 0.75 | <0.01 |
| Batrachoides goldmani | 0.67 | 0.65 | 0.67 | 0.54 |
| Brycon guatemalensis | 0.67 | 0.09 | 0.78 | 0.01 |
| Carlhubbsia kidderi | 0.56 | 0.25 | 0.56 | 0.25 |
| Cathorops aguadulce | 0.50 | 0.02 | 0.67 | <0.01 |
| Centropomus parallelus | 0.75 | <0.01 | 0.25 | 0.09 |
| Centropomus undecimalis | 0.25 | 0.83 | 0.25 | 0.83 |
| Dormitator maculatus | 0.82 | 0.21 | 0.82 | 0.14 |
| Dorosoma petenense | 0.93 | 0.02 | 0.93 | 0.05 |
| Eleotris pisonis | 0.67 | <0.01 | 0.67 | <0.01 |
| Gambusia echeagarayi | 0.43 | 0.51 | 0.57 | 0.11 |
| Gobiomorus dormitor | 0.67 | 0.95 | 0.75 | 0.83 |
| Heterandria bimaculata | 0.75 | 0.01 | 0.75 | 0.01 |
| Mugil curema | 0.33 | 0.13 | 0.33 | 0.13 |
| Ophisternon aenigmaticum | 0.75 | <0.01 | 0.75 | <0.01 |
| Rocio octofasciata | 0.91 | 0.04 | 0.82 | 0.19 |
| Thorichthys ellioti | 0.43 | 0.55 | 0.43 | 0.55 |
| Vieja fenestrata | 0.85 | <0.01 | 0.85 | <0.01 |
| Vieja synspila | 0.55 | 0.28 | 0.55 | 0.34 |
| Xiphophorus hellerii | 0.50 | 0.26 | 0.50 | 0.26 |
| Xiphophorus maculatus | 0.82 | 0.23 | 0.82 | 0.21 |
 Atractosteus tropicus, (b) Brycon guatemalensis, (c) Centropomus parallelus. White circles indicate species’ occurrence data and black areas water bodies.")
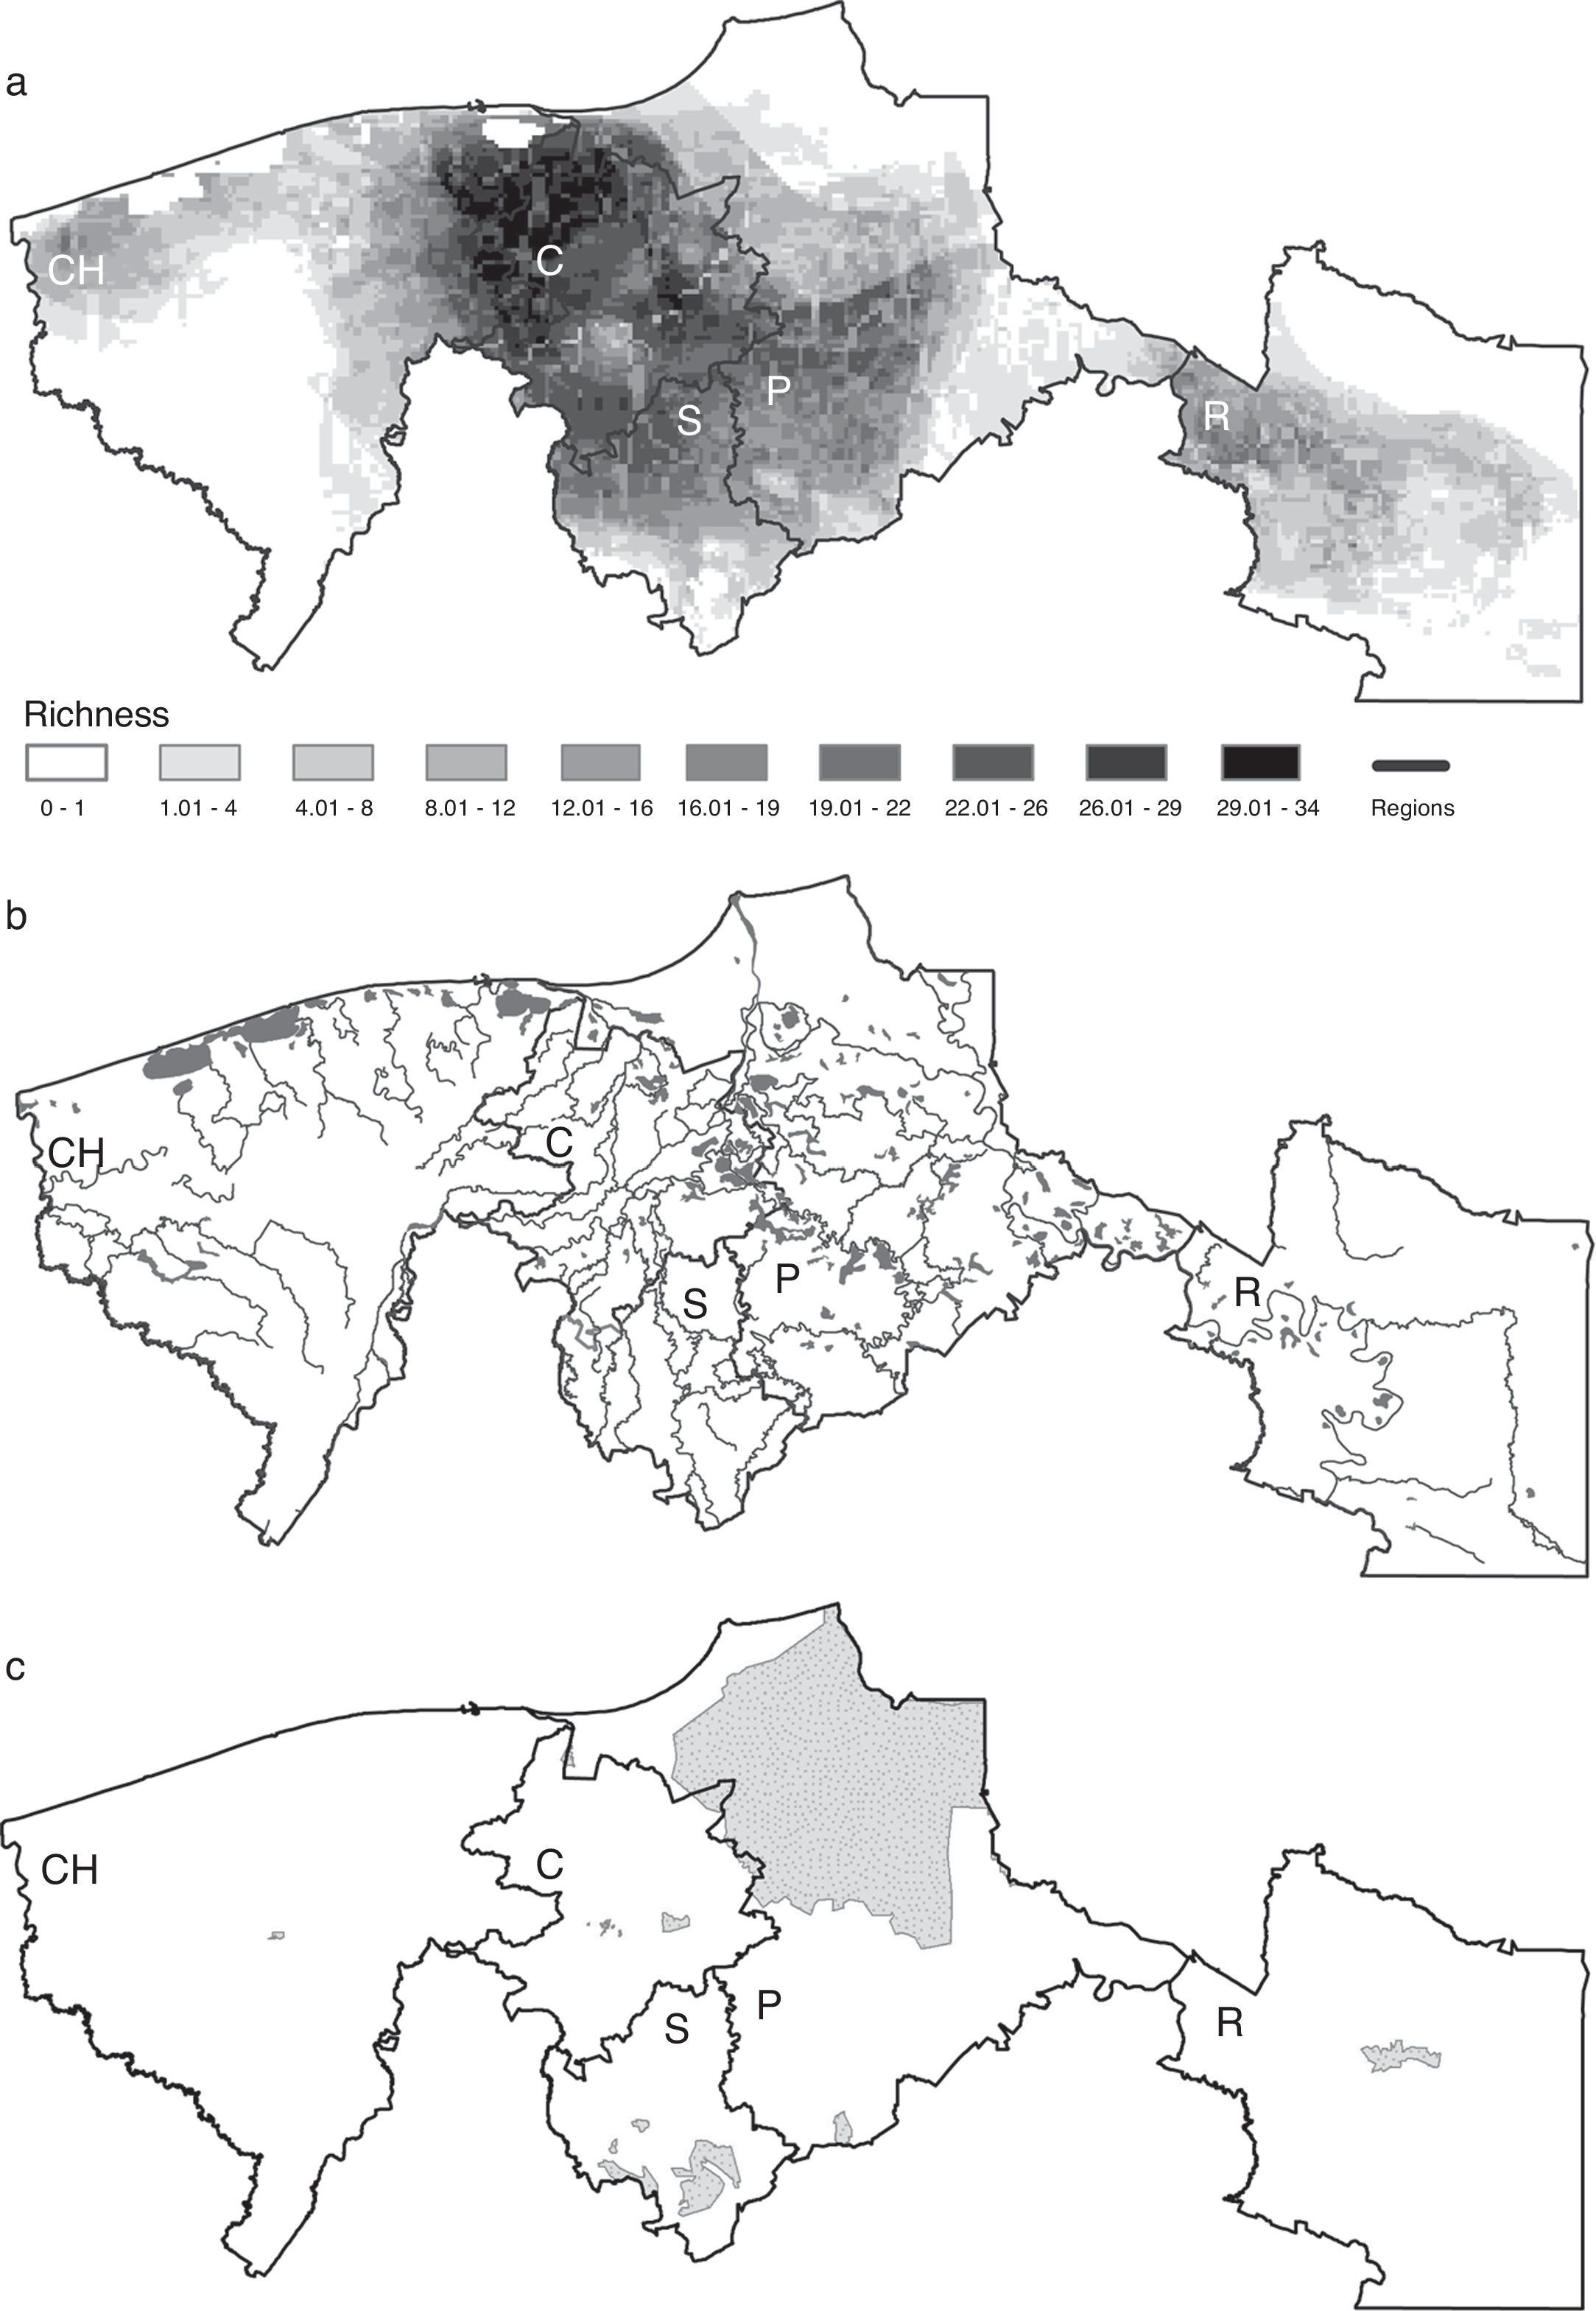
The regions Centro and Sierra held the highest potential richness, with an average of 23 and 13 species per pixel, respectively, followed by Pantanos with 9, Chontalpa with 7 and Ríos with 4 species (Fig. 3a). Interestingly, the coastal areas, where all types of species (primary, secondary, vicarian and sporadic) may converge, were not the richest ones. The areas that had the highest potential richness corresponded to areas with the higher density of rivers, including the Grijalva and Usumacinta rivers, with the highest hydraulic runoff (Fig. 3b). The species richest areas did not match the location of natural protected areas in the region (Fig. 3c).
 Ecological niche model-based distributional predictions for all species, (b) water bodies, (c) map of natural protected areas. The 5 regions are indicated in each map, CH: Chontalpa; C: Centro; S: Sierra; P: Pantanos; R: Ríos.")
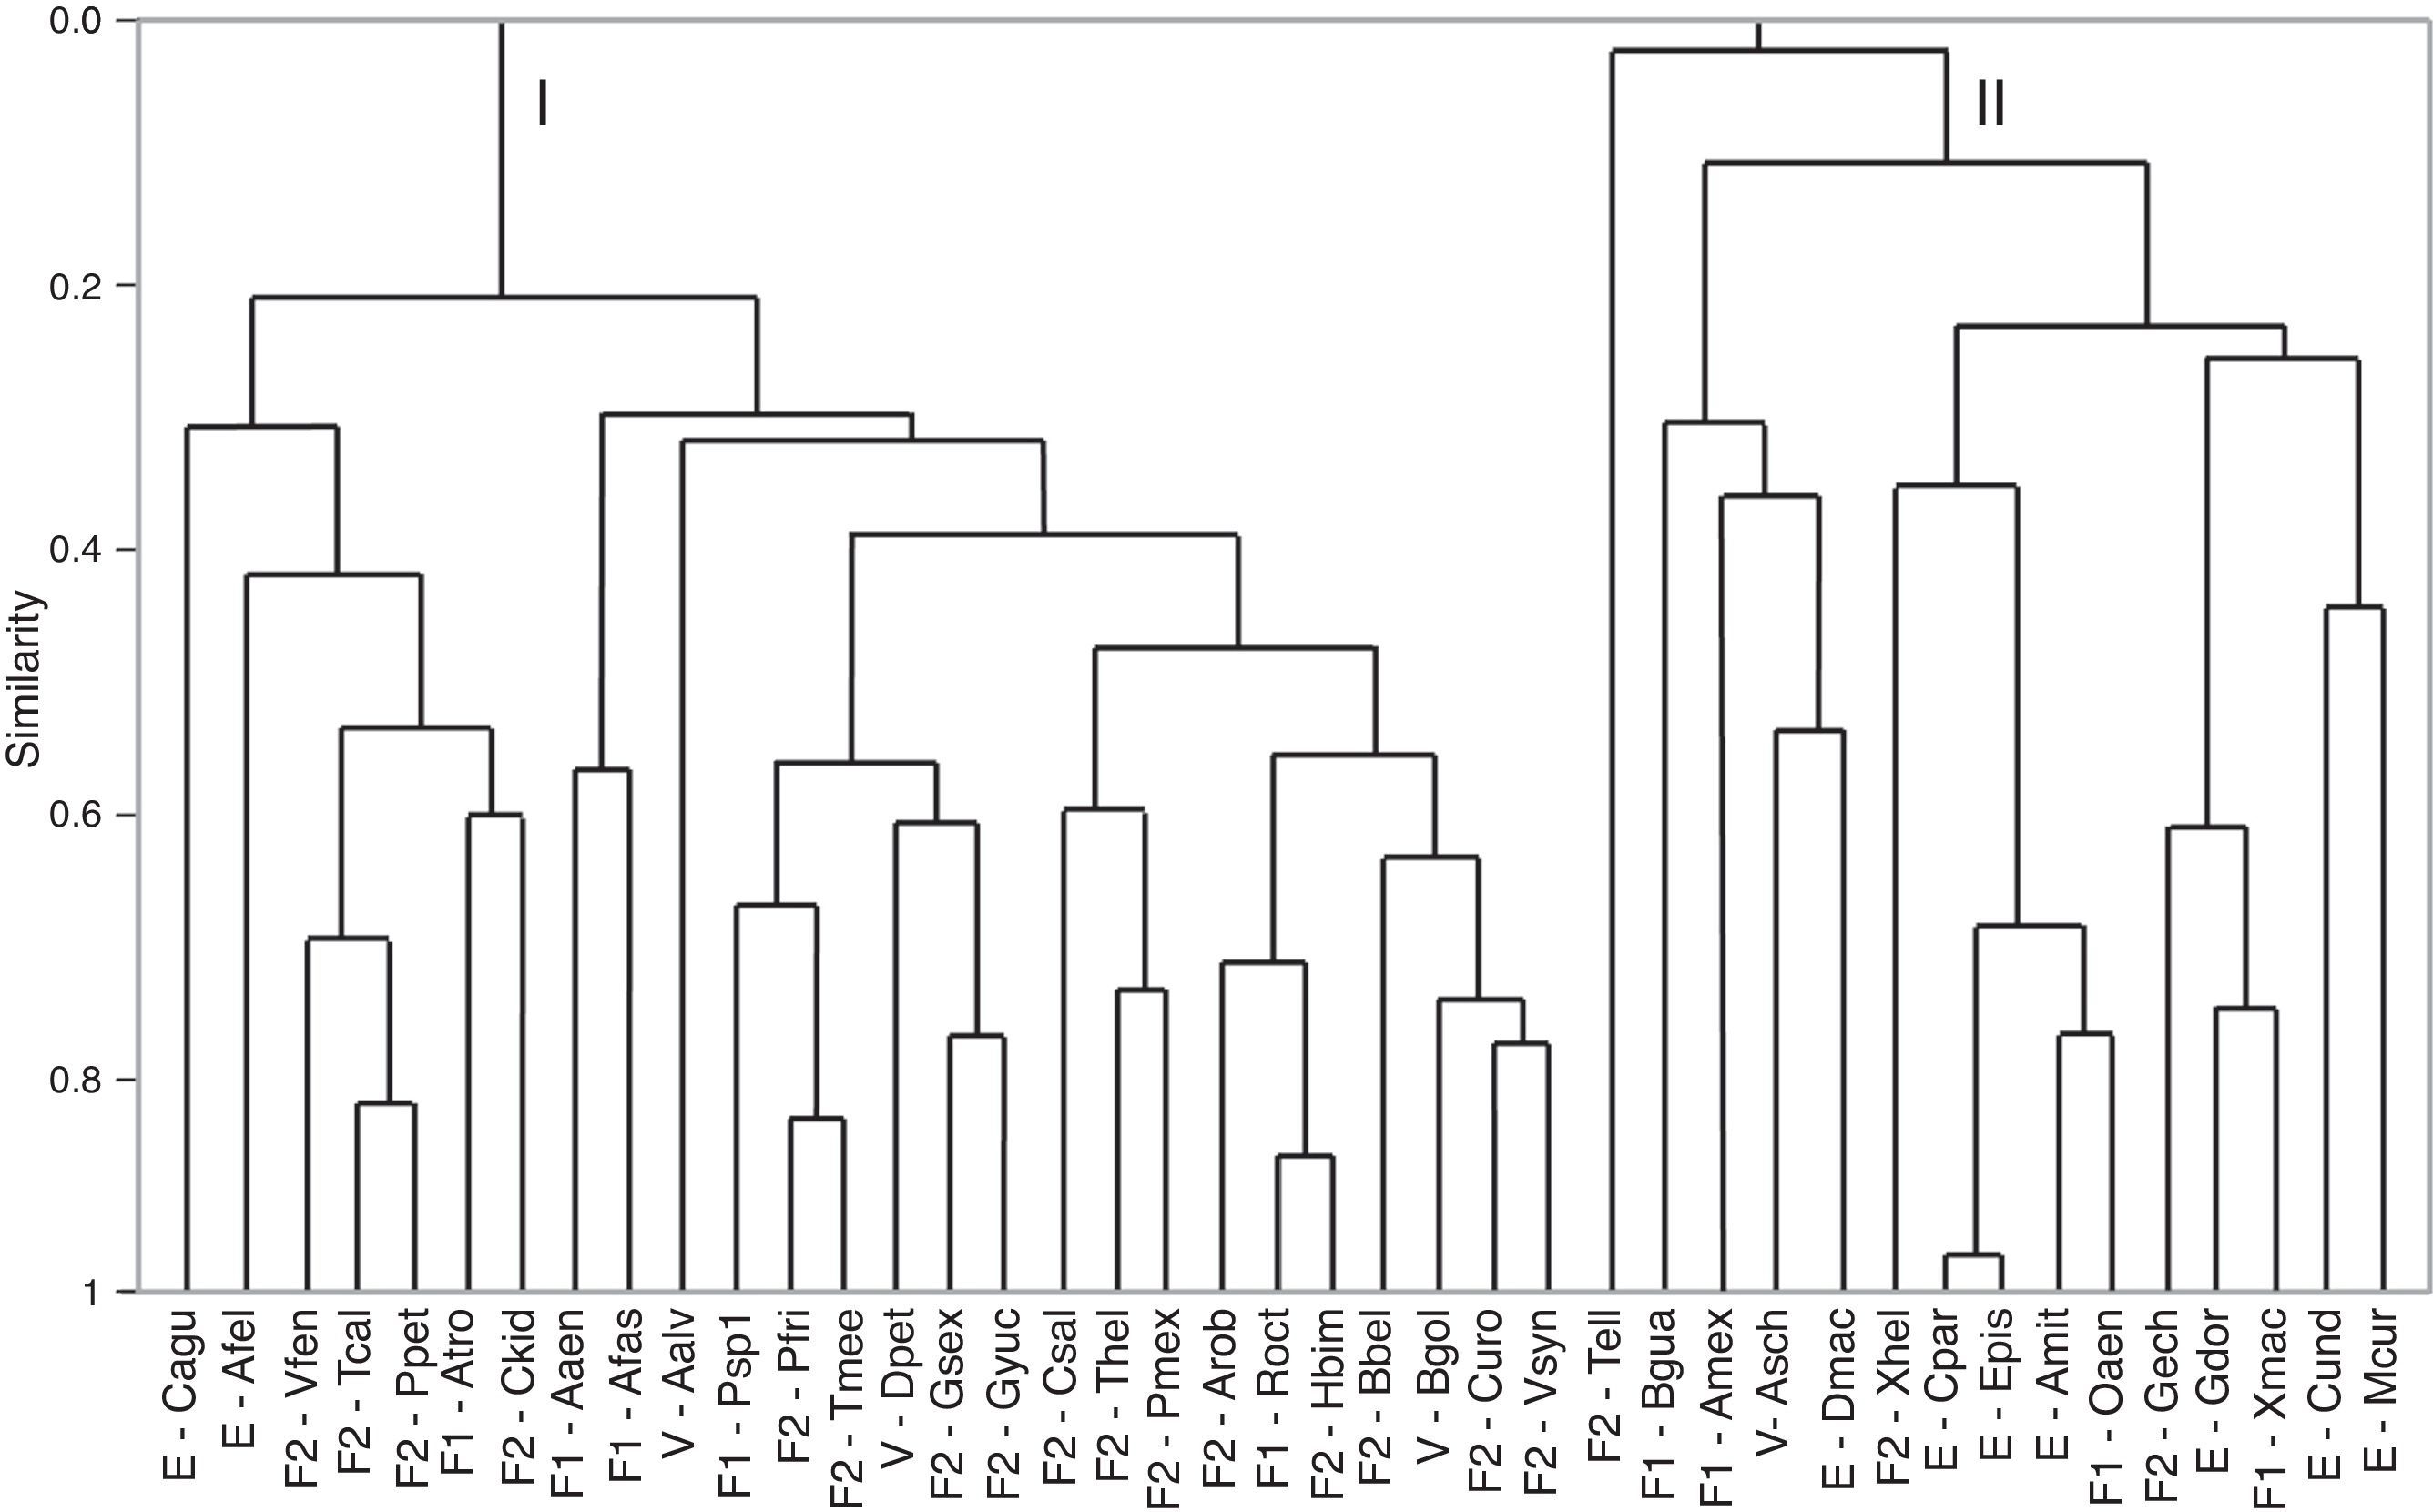
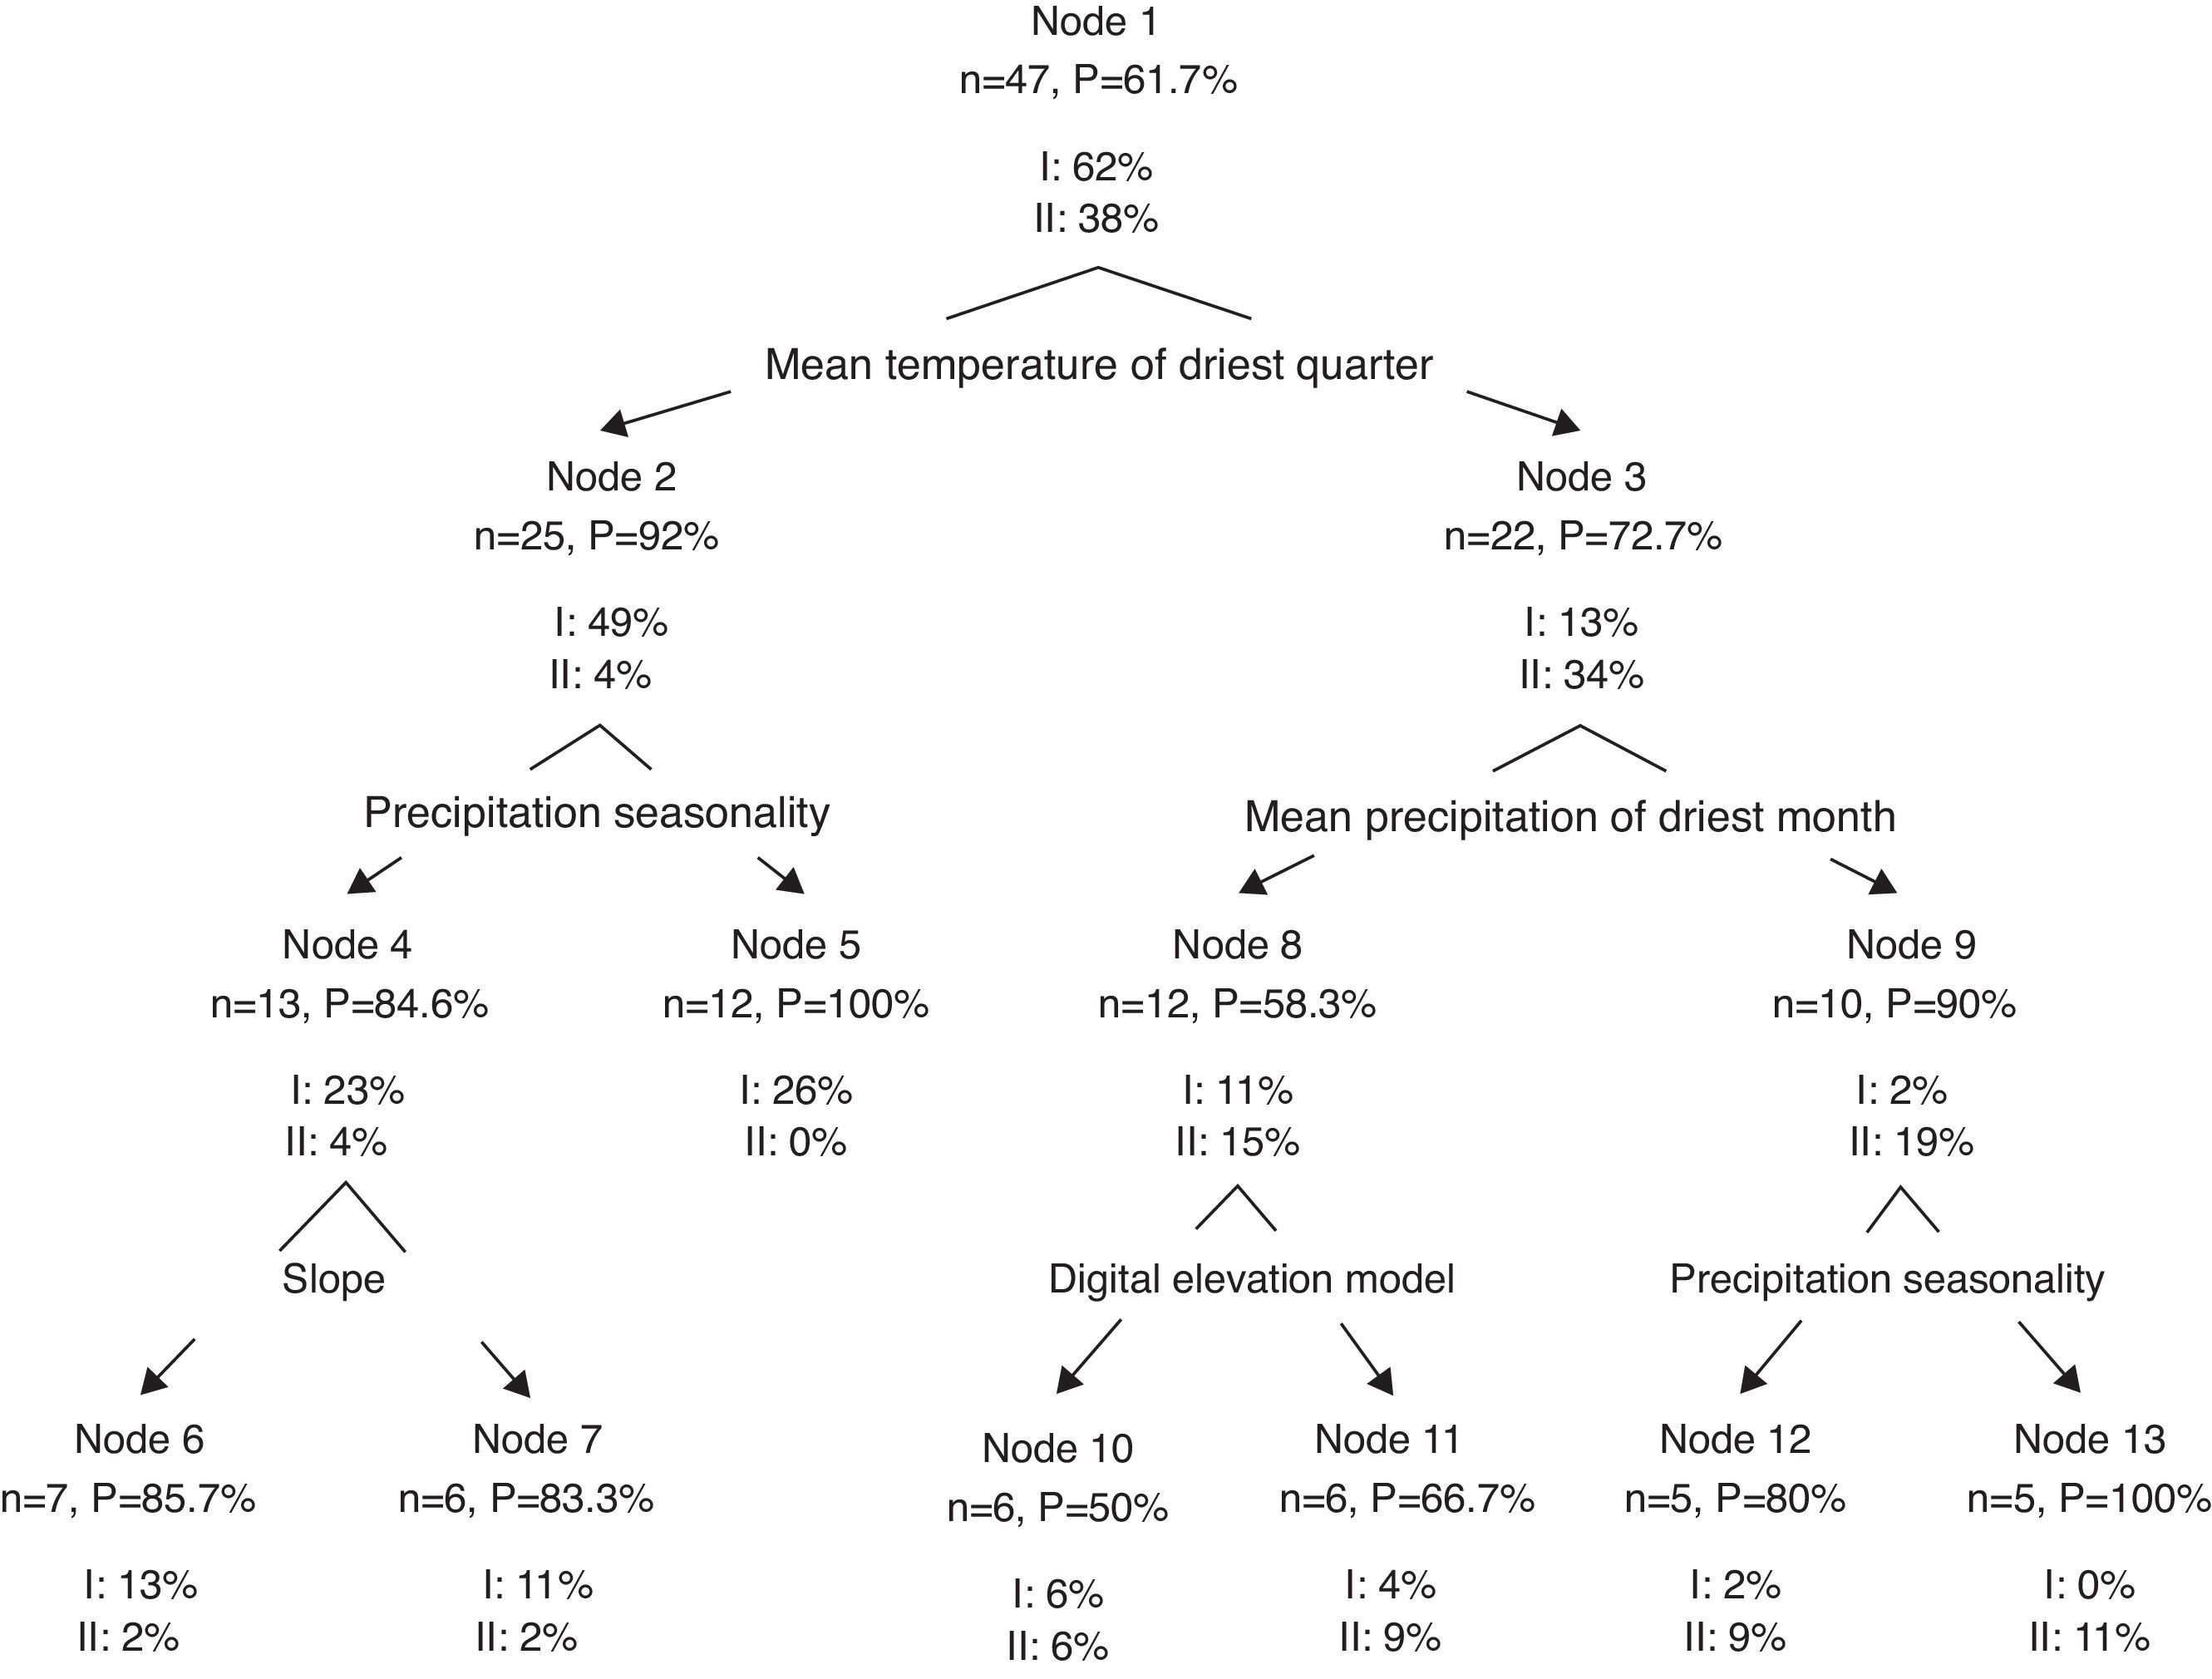
The cluster analysis for species based on environmental variables showed 2 clear groups (Fig. 4). The first group included 30 species, most of which freshwater. The second group was composed of 18 species, which were mostly estuarine and vicarian. The classification tree analysis showed that the mean temperature of the driest quarter was the variable that split the 2 groups (Fig. 5). For the first group, the most influential variables were precipitation seasonality (49%) and slope (23%). For the second group, the mean precipitation of the driest month (34%), precipitation seasonality (19%) and elevation (15%) were the most influential.
. Species’ nomenclature is consistent with Table 1. F1: primary freshwater; F2: secondary freshwater; V: vicarian; E: estuarine-sporadic.")
Cluster dendrogram using Spearman's correlation coefficient for native species showing 2 main groups (I and II). Species’ nomenclature is consistent with Table 1. F1: primary freshwater; F2: secondary freshwater; V: vicarian; E: estuarine-sporadic.

Our results showed that habitat affinities can be detected at the regional scale using macro-climatic and topographic variables. Furthermore, we found that some variables disproportionately influenced the distribution of species. For example, the mean temperature of the driest season was the most influential variable for the freshwater fish group. This variable can be related with drought, which has effects on population declines, loss of habitat, changes in community structure and in water quality (Matthews & Marsh-Matthews, 2003). Additionally, high temperatures reduced both the water level and the oxygen concentration (Jackson et al., 2001; Matthews, 1998). These harsh conditions may act as an environmental filter and determine the presence of tolerant species (HilleRisLambers, Adler, Harpole, Levine, & Mayfield, 2012).
Interestingly, the slope was identified as a distribution driver for several species. This physical factor may play a central role in fish distribution because it can facilitate and/or prevent dispersion within the hydrographic network (Buisson et al., 2008; Pont et al., 2005). For example, slope is a determining factor for connectivity between habitats, thus it can act as a landscape filter and may determine the subset of species that can occur at the local scale (Mugodo et al., 2006). Tabasco is a mostly flat; thus, the slope may influence the current systems. Furthermore, these changes in currents can influence microclimatic conditions, such as small variations in temperature affecting the fish distribution on rivers (Matthews, 1998). Another possibility is the speed current related to the slope. It is possible that some fish species cannot survive in rivers in which stronger currents are produced by higher slopes.
Another important variable for freshwater species was seasonal precipitation. Tabasco is a region with high precipitation levels (2,550mm/year), which affects the current system, water level and sediment concentration in water bodies. In addition, the presence of small temporal and permanent ponds causes a complex interconnection system that certainly plays a role in the distribution and dispersion of species (Escalera-Vázquez & Zambrano, 2010). The fish group conformed by vicarian and estuarine species, with a life cycle linked to salinity concentration, were primarily influenced by the mean precipitation in the driest months and by the mean precipitation. During the dry season, the water level decreases, and salinity concentrates. Estuaries have large fluctuations in salinity, depending on the amount of both freshwater and seawater influx. Thus, the amount of rain in the dry season plays a central role in these dynamics (Matthews, 1998).
The predictive performances in 49% of the models were low. This could be related to the generally low number of records in the area, which shows the general need for more and better record data of Tabasco ichthyofauna. However, the 2 groups classified based on cluster and tree analyses showed that macro-climatic and topographic variables were useful in analyzing the habitat affinities of fish species at the regional scale. These results are consistent with the hypothesis that different species may have similar responses to regional environmental constraints (Pont et al., 2005). For example, geology and climate can influence aquatic ecosystems by affecting stream hydrology, sedimentation, nutrient inputs and channel morphology (Mugodo et al., 2006; Richards, Johnson, & Host, 1996). Accordingly to Stewart-Koster et al. (2013), large-scale variables can explain much of the distribution of fish species; however, the addition of local-scale variables may improve the estimation of species distribution. The understanding of large-scale and local-scale variables that influence fish distribution is crucial for the implementation of new and appropriate management plans (Heino, Virkkala, & Toivonen, 2009).
In this study, we found that areas with the highest potential species richness are not included in the natural protected areas network. This information can be used to develop new and better native fish conservation strategies, such as expanding the current or establishing new natural protected areas. Based on the most influential variables and the long history of hydraulic changes in Tabasco, it is reasonable to assume that the distribution of fish has been changing since the 17th century. Villahermosa city, which is the largest human settlement in the state, was settled in this hydrologic system, and has had a deep influence on the system dynamics. Floods are common in Villahermosa, and hydraulic structures continue to expand. The pollution caused by drainage discharges is also increasing. This situation impacts the distribution and survival of species in several ways (Sánchez & Barba, 2005). The analyses presented here may be useful in developing conservation strategies in light of the hydraulic development and infrastructure of the region.
We thank A. Townsend Peterson for his help during the development of the models. PACT thanks the Posgrado en Ciencias Biológicas of the National Autonomous University of Mexico (UNAM) for the logistic support during her Master's degree. She received a scholarship from the Mexican Council of Science and Technology (Conacyt).
Peer Review under the responsibility of Universidad Nacional Autónoma de México.