


Cancer is the leading cause of death worldwide, with 8.2 million deaths in 2012: 4.7 million (57%) male deaths and 3.5 million (43%) female deaths. In Mexico, it ranks second as a cause of death (2007).
ObjectiveTo describe the most common types of cancers, as well as their trends over the 1990–2012 period.
MethodsMortality rates were standardised (ASMR) by age and gender. The annual percent change (APC) was calculated using Poisson regression model and by means of analysing time trends and variability on a regional level. The Years of Potential Life Lost (YPLL) were calculated.
ResultsASMR increased from 9.7 to 12.2, from 1990 to 2012. In men, the most common types of cancer were: prostate, lung and stomach (ASMR 10.4, 8.0 and 5.8, respectively); APC was of 2.9, −0.6 and −0.1, and in women: breast (ASMR 9.8 and APC 2.7), cervical (ASMR between 12.6 and 6.6 and APC −2.0) and liver (ASMR 4.9, APC 1.3). The highest ASMR was observed in the North of Mexico, mainly for lung, prostate, breast, colon, ovarian and pancreatic cancer.
DiscussionIn Mexico, cancer is a major public health problem. Although mortality is an indicator of the access and effectiveness of medical care, it is necessary to create population-based cancer registries to have basic information in the planning and quality assessment of medical services such as prevention, early diagnosis and treatment, as well as to develop strategies to allocate resources and necessities to fulfil the population's demand for medical assistance.
El cáncer es la primera causa de muerte a nivel mundial, con 8.2 millones de defunciones en el 2012: 4.7 millones (57%) en hombres y 3.5 millones (43%) en mujeres. En México, el cáncer ocupa el segundo lugar como causa de muerte (2007).
ObjetivoDescribirlas principales causas de mortalidad por cáncer y su tendencia durante el periodo 1990-2012.
MétodosSe estandarizaron las tasas de mortalidad (ASMR)por edad y sexo. Analizandosu tendencia temporal y variabilidad regional, se evaluóel porcentaje anual de cambio (APC) mediante el modelo de regresión log-lineal de Poisson. Se calculó el índice de años de vida potencialmente perdidos (IAVPP).
ResultadosLaASMRincrementó de 9.7 a 12.2, de 1990 al 20012. Los tipos decáncermás frecuentes en el hombre fueron próstata, pulmón y estómago (ASMR de 10.4, 8.0 y 5.8 respectivamente); el APCfue de 2.9, -0.6, y -0.1, y en la mujer, el de mama (ASMRde 9.8 y APC de 2.7), el cervicouterino (ASMR de 12.6 a 6.6 y APC de -2.0) y el de hígado (ASMR de 4.9, APC 1.3). En el Norte del país se observaron mayores ASMRprincipalmente para cáncer de pulmón, próstata, mama, colon, ovario y páncreas.
DiscusiónEn México, el cáncer es un importante problema de salud pública. Aunque la mortalidad es un indicador del acceso y eficacia de la atención médica, es necesaria la creación de los registros de cáncer de base poblacional, para contar con información básica en la planificación y evaluación de la calidad de los servicios médicos, tales como la prevención, diagnóstico y tratamiento precoz, así como el desarrollo de estrategias para la distribución de los recursos y necesidades para satisfacer la demanda de atención médica de la población.
Since last century, cancer has been considered a common disease that became a major public health problem on a global scale.1 In addition to causing a high number of deaths each year, it creates huge economic, social and emotional burdens. Data from the World Health Organization (WHO) affirms cancer is the leading cause of death across the world and the second one, after cardiovascular diseases, in underdeveloped countries (Africa, Asia, Central America and South America) where it accounts for more than 70% of registered deaths. This is associated to strategy deficiencies for the prevention, diagnosis and treatment2 of the disease.3,4 According GLOBOCAN data from 2012, there were 14.1 million new cancer cases across the world and 8.2 million deaths, which represented 13% of the total of deaths. Projections indicate that the number of deaths caused by cancer in America will rise from 1.3 million to 2.1 million in 2030. Likewise, the number of new cases is expected to rise by 67% in Latin America and the Caribbean (1.8 million per year); this estimates are higher than the ones for North America (41%).5,6
In the last report, “Cancer in the Americas: Country profiles 2013”, carried out by the Pan American Health Organization (PAHO) and the World Health Organization (WHO), it is reported that mortality caused by all types of cancer is decreasing in at least nine countries of America (Argentina, Brazil, Canada, Chile, United States, Mexico, Nicaragua, Paraguay and Venezuela); in the rest, the trends in mortality due to some types of cancer is still on the rise.7
Most deaths in Latin America are caused by lung, prostate, breast and colorectal cancer. There are some variations evident, depending on the affected subregion. For instance, in North America lung cancer is the main cause of death in women, whereas in Central America one of the types of cancer with the highest mortality rates is cervical cancer (which caused over 35,600 deaths in 2012); in the Caribbean, the incidence and mortality rates due to prostate cancer are significantly higher than in other subregions; stomach cancer is the fifth cause of death for both genders in Latin American and the Caribbean countries, whereas in North America it is not even listed within the first 15 causes of death.5,6
In Mexico, the historical behaviour of cancer mortality has had a rising trend. Since 1999, the numbers have already been considered alarming, given that there were 53.6 deaths reported for every 100,000 inhabitants. This number rose to 55.2 in 2001, almost triple what was reported in 1931 (19.9 deaths every 100,000 inhabitants). For this year, cancer was already placed as the second leading cause of death and it comprised 11.8% of the total of deaths.8,9
According to the data published by the National Institute of Statistics and Geography (Instituto Nacional de Estadistica y Geografia, INEGI) in 2007, cancer was still the second leading cause of death in the country (some reports placed it as third cause), after diabetes mellitus and before heart ischaemic diseases.10 Cancer was the leading cause of death in women between the age of 30 and 59, but it was second in women between the age of 15 and 29. It was the third cause of death in men over the age of 30.11
According to the data published in the Histopatologic Register of Malignant Neoplasms (Registro Histopatologico de Neoplasias Malignas, RHNM) in 2011, cancer incidence nationwide maintained a rising trend among deaths from 1980 to 1989 (41.8 to 51.1 per 105), with a fall in 1990 (49.0 per 105); its rise soared from 1994 to 2008, with rates that went from 51.4 to 66.6 per 105, causing 71,074 deaths.12
In 2012, Aldaco-Sarvide et al.13 reported that a total of 592,018 people passed away in the year 2010. Out of these deaths, 74,685 were caused by cancer. This corresponds to 12.6% of the total of deaths.
Recently, according to the 2013 PAHO/WHO report, cancer mortality rates in Mexico decreased during the years 2009 and 2010.4 33,263 male deaths and 34,745 female deaths were registered, with distinct rising trends within the population over the age of 30 and elevated death rates for the majority of the types of cancer.
Although the problem cancer represents on a global scale can be seen in a general way through international registries, data from Mexico is paltry and access to be able to determine its real impact on health more precisely is difficult. For this reason, and given the need to have more information available that supports the understanding of the evolution and state of cancer in our country, this study has been carried out. It describes the trend and epidemiologic behaviour of the ten leading causes of death by cancer within the Mexican population from 1990 to 2012.
MethodsData on deaths due to malignant tumours was gathered from official databases from 1990 to 2012, which were obtained from death certificates validated by the National Institute of Statistics and Geography (INEGI)14 and published by the National Health Information System (NHIS).15 The 2010–2050 projections for the population of Mexico were also taken into account for this period, which were published by the National Population Council (Consejo Nacional de Poblacion, CONAPO)16 and the International Classification of Diseases was also used (CIE-10).17 A descriptive, univariate analysis was carried out by gender, age, state and type of cancer as cause of mortality, and a bivariate analysis to compare mortality rates by gender, age group and state. The national annual mortality rate was calculated from 1990 to 2012, as well as the global cancer mortality rate for the same period. The mortality ratio between men and women was calculated. The evolution of mortality was obtained by calculating the ratio between rates; subsequently, the standardisation of rates was performed by age (ASMR) for the ten leading causes of death by cancer by year and by gender, via the direct method18 and Doll et al. population, modified by Segui.19 All mortality rates were calculated by 100,000 inhabitants. The evolution of cancer mortality over time and the interstate fluctuation was expressed as the annual percentage change (APC) using the Poisson regression model. To determine the magnitude of the leading causes of death due to cancer by state for the study period, the ASMR was classified into levels, very high, high, medium and low according to the quartile method. The results are provided with their confidence intervals (CI) to 95%. To make comparisons between states and to assess premature mortality due to cancer, the Years of Potential Life Lost (YPLL) was calculated.20,21 Microsoft Access 2003 and INTERCOOLED STATA 12 statistical packages for Windows were used for the calculations.
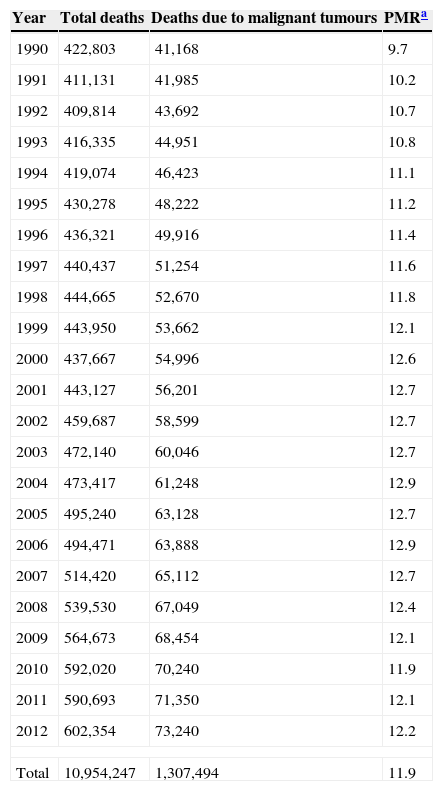
ResultsDuring the study period, out of 10,954,247 deaths registered nationwide, 1,307,494 (11.9%) were caused by some type of cancer. As shown in Table 1, deaths caused by cancer rose in absolute numbers from 41,168 (9.7%) in 1990 to 73,240 (12.2%) in 2012.
Proportional mortality rate due to malignant tumours, Mexico 1990–2012.
| Year | Total deaths | Deaths due to malignant tumours | PMRa |
|---|---|---|---|
| 1990 | 422,803 | 41,168 | 9.7 |
| 1991 | 411,131 | 41,985 | 10.2 |
| 1992 | 409,814 | 43,692 | 10.7 |
| 1993 | 416,335 | 44,951 | 10.8 |
| 1994 | 419,074 | 46,423 | 11.1 |
| 1995 | 430,278 | 48,222 | 11.2 |
| 1996 | 436,321 | 49,916 | 11.4 |
| 1997 | 440,437 | 51,254 | 11.6 |
| 1998 | 444,665 | 52,670 | 11.8 |
| 1999 | 443,950 | 53,662 | 12.1 |
| 2000 | 437,667 | 54,996 | 12.6 |
| 2001 | 443,127 | 56,201 | 12.7 |
| 2002 | 459,687 | 58,599 | 12.7 |
| 2003 | 472,140 | 60,046 | 12.7 |
| 2004 | 473,417 | 61,248 | 12.9 |
| 2005 | 495,240 | 63,128 | 12.7 |
| 2006 | 494,471 | 63,888 | 12.9 |
| 2007 | 514,420 | 65,112 | 12.7 |
| 2008 | 539,530 | 67,049 | 12.4 |
| 2009 | 564,673 | 68,454 | 12.1 |
| 2010 | 592,020 | 70,240 | 11.9 |
| 2011 | 590,693 | 71,350 | 12.1 |
| 2012 | 602,354 | 73,240 | 12.2 |
| Total | 10,954,247 | 1,307,494 | 11.9 |
With respect to mortality due to cancer and age (grouped into five-year periods), in the year 2012 there was a rising trend as people got older, which became more evident for people over the age of 40. When comparing the risk of death between men and women by age group, this was higher for men in early stages of life (under the age of 30) and over the age of 65. Conversely, the risk of death for women was higher between the ages of 30 and 64 (Fig. 1).

When analysing the leading causes of death by gender, there was a significant rise in mortality rates within the male population over the age of 60 and within the female population over the age of 40 (Fig. 2).

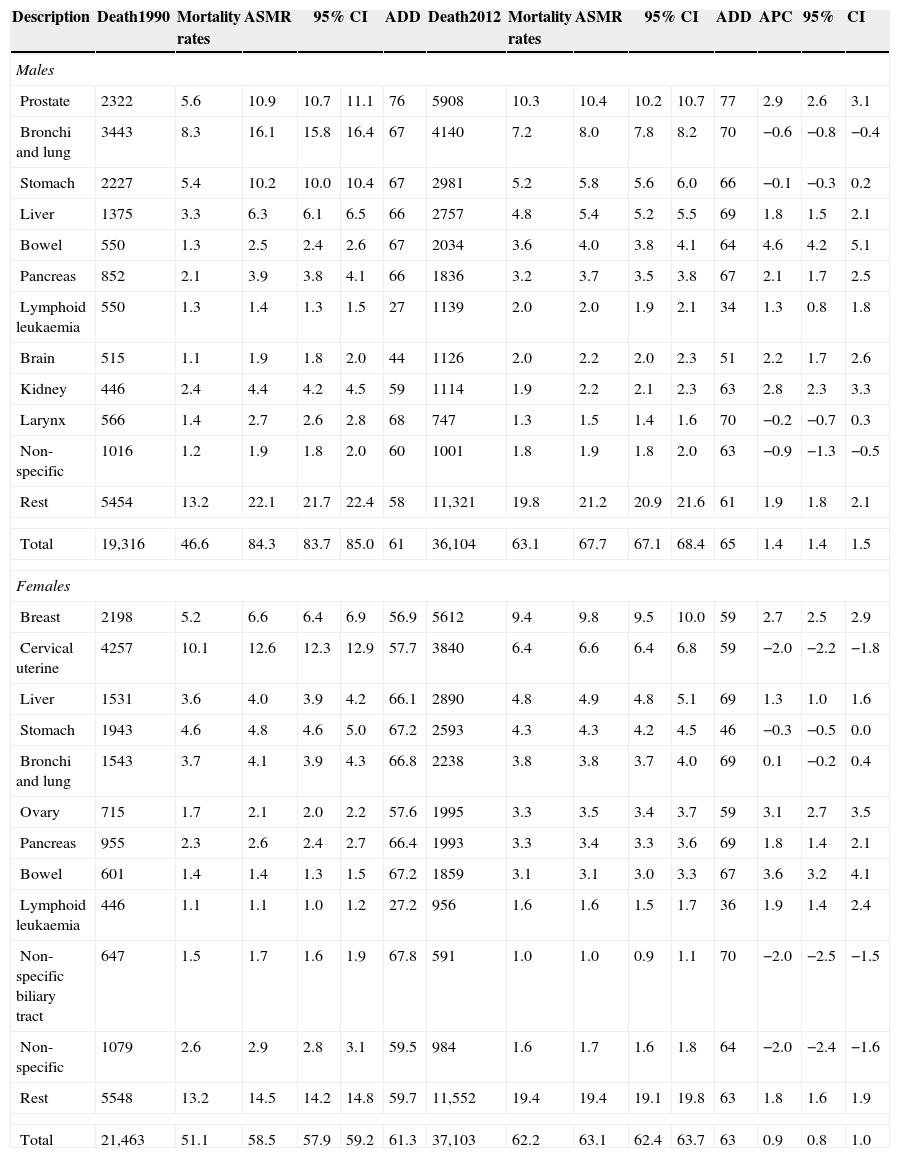
In the comparative analysis (1990 vs 2012) the results were the following. The male mortality rate from 1990 rose in 2012 from 46.6 to 63.1 per 105; this situation changed after standardising the rates by age. There was a fall in the ASMR from 84.3 (95% CI, 61.00–85.0) to 67.7 per 105 (95% CI, 67.1–68.4). The average life expectancy rose from age 61 to 65 and the APC was of 1.4 (95% CI, 1.4–1.5). The ten leading causes of death in males were: prostate cancer with an ASMR of 10.4 per 105, lung and bronchi cancer with an ASMR of 8.0 per 105, stomach cancer with an ASMR of 5.8 per 105, liver cancer with an ASMR of 5.4 per 105, colon cancer with an ASMR of 4.0 per 105, pancreas cancer with an ASMR of 3.7 per 105, lymphoid leukaemia, brain cancer, kidney cancer and larynx cancer with an ASMR of 2.0, 2.2, 2.2 and 1.5 per 105, respectively. The first five leading causes comprised 49% of the total of deaths and the subsequent five 17% of the deaths. Thus, the ten types of cancer mentioned above comprised 66% of total deaths.
The ASMR trends during the study period fluctuated according to the type of cancer. Colon cancer ASMR (4.0 per 105), brain cancer ASMR (2.2 per 105) and lymphoid leukaemia ASMR (2.0 per 105) were higher in 2012 than in 1990. Conversely, lung and bronchi cancer ASMR (16.1 per 105), stomach cancer ASMR (10.2 per 105) and larynx cancer ASMR (2.7 per 105) declined almost by 50% in 2012 (8.0, 5.8, 1.5 per 105, respectively). The types of cancer that remained with very similar mortality rates were prostate cancer (ASMR from 10.9 to 10.4 per 105) and pancreas cancer (ASMR from 3.9 to 3.7 per 105) (Table 2).
Mortality due to malignant tumours, Mexico 1990–2012.
| Description | Death1990 | Mortality rates | ASMR | 95% CI | ADD | Death2012 | Mortality rates | ASMR | 95% CI | ADD | APC | 95% | CI | ||
|---|---|---|---|---|---|---|---|---|---|---|---|---|---|---|---|
| Males | |||||||||||||||
| Prostate | 2322 | 5.6 | 10.9 | 10.7 | 11.1 | 76 | 5908 | 10.3 | 10.4 | 10.2 | 10.7 | 77 | 2.9 | 2.6 | 3.1 |
| Bronchi and lung | 3443 | 8.3 | 16.1 | 15.8 | 16.4 | 67 | 4140 | 7.2 | 8.0 | 7.8 | 8.2 | 70 | −0.6 | −0.8 | −0.4 |
| Stomach | 2227 | 5.4 | 10.2 | 10.0 | 10.4 | 67 | 2981 | 5.2 | 5.8 | 5.6 | 6.0 | 66 | −0.1 | −0.3 | 0.2 |
| Liver | 1375 | 3.3 | 6.3 | 6.1 | 6.5 | 66 | 2757 | 4.8 | 5.4 | 5.2 | 5.5 | 69 | 1.8 | 1.5 | 2.1 |
| Bowel | 550 | 1.3 | 2.5 | 2.4 | 2.6 | 67 | 2034 | 3.6 | 4.0 | 3.8 | 4.1 | 64 | 4.6 | 4.2 | 5.1 |
| Pancreas | 852 | 2.1 | 3.9 | 3.8 | 4.1 | 66 | 1836 | 3.2 | 3.7 | 3.5 | 3.8 | 67 | 2.1 | 1.7 | 2.5 |
| Lymphoid leukaemia | 550 | 1.3 | 1.4 | 1.3 | 1.5 | 27 | 1139 | 2.0 | 2.0 | 1.9 | 2.1 | 34 | 1.3 | 0.8 | 1.8 |
| Brain | 515 | 1.1 | 1.9 | 1.8 | 2.0 | 44 | 1126 | 2.0 | 2.2 | 2.0 | 2.3 | 51 | 2.2 | 1.7 | 2.6 |
| Kidney | 446 | 2.4 | 4.4 | 4.2 | 4.5 | 59 | 1114 | 1.9 | 2.2 | 2.1 | 2.3 | 63 | 2.8 | 2.3 | 3.3 |
| Larynx | 566 | 1.4 | 2.7 | 2.6 | 2.8 | 68 | 747 | 1.3 | 1.5 | 1.4 | 1.6 | 70 | −0.2 | −0.7 | 0.3 |
| Non-specific | 1016 | 1.2 | 1.9 | 1.8 | 2.0 | 60 | 1001 | 1.8 | 1.9 | 1.8 | 2.0 | 63 | −0.9 | −1.3 | −0.5 |
| Rest | 5454 | 13.2 | 22.1 | 21.7 | 22.4 | 58 | 11,321 | 19.8 | 21.2 | 20.9 | 21.6 | 61 | 1.9 | 1.8 | 2.1 |
| Total | 19,316 | 46.6 | 84.3 | 83.7 | 85.0 | 61 | 36,104 | 63.1 | 67.7 | 67.1 | 68.4 | 65 | 1.4 | 1.4 | 1.5 |
| Females | |||||||||||||||
| Breast | 2198 | 5.2 | 6.6 | 6.4 | 6.9 | 56.9 | 5612 | 9.4 | 9.8 | 9.5 | 10.0 | 59 | 2.7 | 2.5 | 2.9 |
| Cervical uterine | 4257 | 10.1 | 12.6 | 12.3 | 12.9 | 57.7 | 3840 | 6.4 | 6.6 | 6.4 | 6.8 | 59 | −2.0 | −2.2 | −1.8 |
| Liver | 1531 | 3.6 | 4.0 | 3.9 | 4.2 | 66.1 | 2890 | 4.8 | 4.9 | 4.8 | 5.1 | 69 | 1.3 | 1.0 | 1.6 |
| Stomach | 1943 | 4.6 | 4.8 | 4.6 | 5.0 | 67.2 | 2593 | 4.3 | 4.3 | 4.2 | 4.5 | 46 | −0.3 | −0.5 | 0.0 |
| Bronchi and lung | 1543 | 3.7 | 4.1 | 3.9 | 4.3 | 66.8 | 2238 | 3.8 | 3.8 | 3.7 | 4.0 | 69 | 0.1 | −0.2 | 0.4 |
| Ovary | 715 | 1.7 | 2.1 | 2.0 | 2.2 | 57.6 | 1995 | 3.3 | 3.5 | 3.4 | 3.7 | 59 | 3.1 | 2.7 | 3.5 |
| Pancreas | 955 | 2.3 | 2.6 | 2.4 | 2.7 | 66.4 | 1993 | 3.3 | 3.4 | 3.3 | 3.6 | 69 | 1.8 | 1.4 | 2.1 |
| Bowel | 601 | 1.4 | 1.4 | 1.3 | 1.5 | 67.2 | 1859 | 3.1 | 3.1 | 3.0 | 3.3 | 67 | 3.6 | 3.2 | 4.1 |
| Lymphoid leukaemia | 446 | 1.1 | 1.1 | 1.0 | 1.2 | 27.2 | 956 | 1.6 | 1.6 | 1.5 | 1.7 | 36 | 1.9 | 1.4 | 2.4 |
| Non-specific biliary tract | 647 | 1.5 | 1.7 | 1.6 | 1.9 | 67.8 | 591 | 1.0 | 1.0 | 0.9 | 1.1 | 70 | −2.0 | −2.5 | −1.5 |
| Non-specific | 1079 | 2.6 | 2.9 | 2.8 | 3.1 | 59.5 | 984 | 1.6 | 1.7 | 1.6 | 1.8 | 64 | −2.0 | −2.4 | −1.6 |
| Rest | 5548 | 13.2 | 14.5 | 14.2 | 14.8 | 59.7 | 11,552 | 19.4 | 19.4 | 19.1 | 19.8 | 63 | 1.8 | 1.6 | 1.9 |
| Total | 21,463 | 51.1 | 58.5 | 57.9 | 59.2 | 61.3 | 37,103 | 62.2 | 63.1 | 62.4 | 63.7 | 63 | 0.9 | 0.8 | 1.0 |
Population estimations; National Population Consensus (CONAPO), Mexico 1990–2012.
Mortality rate, rate per 105; ASMR, age-standardised mortality rates in people greater than 20 years; 95% CI, 95% confidence intervals; ADD, mean age of death; APC, annual percentage change.
In women, the mortality rate rose from 51.1 to 62.2 deaths per 105. A similar trend was seen when standardising rates by age: the ASMR rose from 58.5 to 63.1 (95% CI, 62.4–63.7) deaths per 105.
The average life expectancy rose from age 61 to 63 with an APC of 0.9. The most common types of cancer in 2012 were: breast cancer with an ASMR of 9.8 per 105, cervical cancer with an ASMR of 6.6 per 105, liver cancer with an ASMR of 4.9 per 105, stomach cancer with an ASMR of 4.3 per 105, lung and bronchi cancer with an ASMR of 3.8 per 105, ovarian cancer with an ASMR of 3.5 per 105, pancreas cancer, colon cancer and lymphoid leukaemia with an ASMR of 3.4, 3.1 and 1.6 per 105 cases, respectively. The pattern was very similar to the one seen in men: the first five causes of death mentioned above represented 46% of the total of deaths in 2012, and the subsequent ones represented 18%. Overall, they comprised 66% of the total of deaths from cancer in women.
In 2012, there was a rising trend in mortality in women for the following types of cancer: breast cancer (ASMR from 6.6 to 9.8 per 105), which after being in second place in 1990 placed first in 2012; ovarian cancer (ASMR from 2.1 to 3.5 per 105), colon cancer (ASMR from 1.4 to 3.1 per 105), pancreas cancer (ASMR from 2.6 to 3.4 per 105) and lymphoid leukaemia (ASMR from 1.1 to 1.6 per 105). There was a decreasing trend for: cervical cancer (ASMR from 12.6 to 6.6 per 105), which went from the first to the second place; stomach cancer (ASMR from 4.8 to 4.3 per 105), and lung and bronchi cancer (ASMR from 4.1 to 3.8 per 105).
As for mortality by state, there was no homogeneous distribution in the ASMRs. The following states had higher mortality rates in men: Sonora, Baja California Sur, Chihuahua, Nuevo Leon and Sinaloa with an ASMR of 95.47, 94.83, 84.11, 82.88, 82.53, cases per 105, respectively. Tlaxcala ranked last with an ASMR of 53.43 cases per 105 and the national death rate was of 94.83 per 105 inhabitants.
There were also some differences in the distribution of rates by state and gender. In women, the higher mortality rates were for Colima (78.24 cases per 105), Sonora (71.82 cases per 105), Coahuila (71.02 cases per 105), Baja California (70.42 cases per 105) and Nuevo Leon (70.24 cases per 105). Durango ranked last with an ASMR of 50.69 cases per 105. The national rate was of 123.53 deaths per 105 inhabitants.
ASMR distribution of the main types of cancer by state (2012) is shown in Figs. 3 and 4.

ASMR* geographical distribution of principal malignant tumours in males, Mexico 2012. *Mortality rate standardised by age.

ASMR* geographical distribution of malignant tumours in females, Mexico 2012. *Mortality rate standardised by age.
Calculated by age, the national rate for prostate cancer was 10.4 cases per 105 men, and the states with the highest ASMR of 2012 were: Aguascalientes (15.8), Nayarit (14.2), Jalisco (13.7), Colima (13.5) and Sinaloa (13.4). The lowest rates were for the states of Hidalgo (7.9), Yucatan (7.2) and Quintana Roo (6.7).
The states with the highest ASMR for breast cancer (national rate of 9.8) were: Mexico City (14.7), Nuevo Leon (14.0), Baja California (13.6), Baja California Sur and Colima (13.3); the lowest rates were for Guerrero (5.8), Campeche (4.9) and Oaxaca (4.3).
The states with the highest ASMR for lung and bronchi cancer (national rate of 8.0 for men) were Baja California Sur (19.1), Sinaloa (18.1), Sonora (17.7), Chihuahua (14.1) and Nuevo Leon (13.0); and the states with the lowest rates were Oaxaca (3.7), Hidalgo (3.6) and Tlaxcala (2.8).
The states with the highest ASMR for cervical cancer (national rate of 6.6) were: Colima (12.5), Chiapas (9.4), Yucatan and Sonora (8.4), Campeche (8.2) and Morelos (8.1), mainly. The lowest rates were for the states of Durango (3.9), Zacatecas (3.6) and Hidalgo (3.5).
The states with the highest ASMR for stomach cancer (national rate of 5.8 for men and 4.3 for women) were the following: for men and women, Chiapas (9.5 and 7.0), Sonora (8.3 and 4.3), Oaxaca (7.4 and 5.7), Mexico City (7.4 and 5.9) and Campeche (7.4 and 5.7); the lowest rates were for the states of Nuevo León (4.3 and 3.9), Nayarit (4.0 and 2.7), Durango (4.6 and 2.1), Coahuila (3.6 and 3.9) and Aguascalientes (1.8 for women).
Fig. 5 shows the premature mortality rate by type of cancer, gender and state. Mexico City, Sonora, Baja California Sur, Veracruz and Chihuahua had higher premature mortality rates for men, with 1.32, 1.30, 1.29, 1.28 and 1.20 YPLL.
 due to malignant tumours in males and females, Mexico 1990–2012.")
Potential years of life lost index (YPLLI) due to malignant tumours in males and females, Mexico 1990–2012.
The states with the highest premature mortality rates for women were Mexico City (YPLL 1.25), Chihuahua (YPLL 1.17), Baja California (YPLL 1.15), Chiapas (YPLL 1.12) and Sonora (YPLL 1.10).
DiscussionThe importance cancer has had throughout history is not only due to the progressive growth of its incidence and mortality rates, but it also to the economic impact that its treatment generates in healthcare services and in the patients’ families.
In Mexico, just as in the rest of the world, cancer has risen significantly among the population, with a clear rising trend that generates a real issue in public health.
In the 2013 PAHO/WHO report,7 it is mentioned that Mexico is part of the nine countries with decreasing trends for cancer mortality. However, the results from this study show a reduction in the mortality rates of some types of cancer only, such as cervical and lung cancer. Within the study period there was a clear rising trend in global cancer mortality, represented in the proportional mortality ratio of 2012 (12.2%) compared to the one from 1990 (9.7%).
Likewise, there was also an increase in the raw mortality rate by gender from 46.6 to 63.1 per 105 in men and from 51.1 to 63.1 per 105 in women. Although when standardising rates by age, there was still a rising trend for women with ASMR from 58.5 to 63.1 per 105, in men, the ASMR decreased from 84.3 to 67.7 per 105.
A similar scenario was reported both in the Aldaco et al.13 study during the 2000–2010 period, and in the Histopathologic Register of Malignant Neoplasms from 2011.12 In the first one, cancer mortality rates rose from 59.3 to 66.5 per 105, and in the second one, the increment went from 41.8 to 62.8 for the 1980–2008 period.
The ratio between mortality rates from men and women was very narrow, with a slight predominance in men under the age of 30 (1.4:1) and over the age of 65 (1.15:1). Conversely, women between the age of 30 and 64 (1:1.3) showed a higher risk of death. This analysis can be an important tool to measure the impact cancer has on the population.
The correspondence between the risk of death by cancer and age is already well known. Mortality rates increase at older ages, a fact that is also seen in the results of this study. This phenomenon goes hand in hand with the increasing proportion of older adults, and it can be explained by itself due to the ageing of the population Mexico is experiencing since a few decades ago. Therefore, we must not overlook the fact that the result of the demographic transition is in turn the reflection of the reduction in fertility rates and mortality itself.
The fluctuations in mortality by age and gender groups are indiscriminately associated with the shifting of those types of cancer that caused more deaths in the past.
For instance, for breast cancer, which ranked first in 2012 as leading cause of death and which took cervical cancer's place, the ASMR rising trend becomes more evident over the age of 30, when the risk for cancer is more common for women. The average life expectancy was 59 years.
Conversely, the increase in ASMR becomes more evident for prostate cancer over the age of 65 (ADD 77 years). This type of cancer represented the prime cause of death among the male population, taking lung and bronchi cancer's place. There were higher ASMR at younger ages (35–39 years) in women for stomach cancer, although there was a decreasing trend, in comparison to men (65–69 years), with ADDs of 46 and 66 years, respectively.
Another interesting fact is the differences in ASMRs by states. The highest rates for lung and bronchi cancer, colon cancer, breast and ovarian cancer were in some of the states from the North of the country (Baja California, Sonora, Chihuahua, Coahuila, Nuevo Leon, Tamaulipas). In the states from the South (Chiapas, Oaxaca, Campeche and Yucatán), the higher rates were for cervical, stomach and liver cancer. The presence of cancer in the centre of the country was heterogeneous and contrasting in their ASMRs; Mexico City had the highest YPLL, both for men (1.32) and women (1.25).
This scenario, which is undoubtedly associated with the individual characteristics of the population, different lifestyles, marginalisation, sociocultural level, poverty and/or economic resources allocated for healthcare, shows that the link between cancer and risk factors associated to its mortality need to be tackled in a more precise manner.
Likewise, and regardless of the benefits obtained with the current programmes and strategies to control cancer, there must be more epidemiologic studies that can provide other indicators, such as the incidence, death or survival rate, and that support understanding of the determinants involved, to study in depth and have a better knowledge of the real impact of this problem in our country.
One of the international models that can enable us to have an idea of the impact cancer has across the world and in our country is the GLOBOCAN registry.6 However, this system does not necessarily reflect reality, since it is based on estimates of the situation and uses sources that do not necessarily reflect the current state of cancer.
In spite of the complexity that the interpretation of the data gathered in the mortality registries generates, particularly since the lack of specifics that determine the basic causes of death in death certificates can affect their validity and reliability, analysis of mortality can serve to a great extent as a tracer indicator of the access to healthcare services. At the same time it can provide important data to analyse the epidemiologic scenario of cancer mortality, estimate the risk of death or survival among the population, and consider various scenarios to design and evaluate programmes and health policies.
While we cannot overlook the fact that even though it is not enough to analyse mortality in isolation to determine the real situation that cancer represents in healthcare services and in the population, it must be pointed out that the results of the analysis, even if to a certain extent they limit a clear assessment of the problem, are the best approach to reality and facilitate decision-making in healthcare.
To conclude, it is essential to strive for an ongoing improvement of the quality of registries to reduce potential errors that can limit the analysis of mortality and, of course, to not overlook the clear need to have population-based regional epidemiologic cancer registries, which will enable us to understand the real situation related to cancer in our country and support better decision-making within programmes and strategies that aim at training for early diagnosis and timely treatment. The impact will be reflected on the incidence and mortality of cancer over the coming years.
Conflict of interestThere are no conflicts of interest.