

The Lacandones are considered descendants of the Maya Civilization that found refuge in the jungle during the Spanish colonization. They were able to live in absolute isolation until 1990 when an acculturation process began. This is a cross-sectional study that included 46.7% of the total Lacandon population. Weight, height, overnight fasting plasma glucose, urea, creatinine, uric acid, hemoglobin, triglycerides and HDL-cholesterol levels were determined. BMI and age have a positive correlation for subjects younger than 40 years (r=0.51). Diabetes prevalence is 1.1%, and all cases are in the most acculturated town (Palenque). Prediabetes prevalence is 5.85% and all the cases have also hypertriglyceridemia. 19% of the prediabetes cases are between 10 and 19 years old. Hypercholesterolemia and hypertriglyceridemia prevalences are 20.7% and 45.1% respectively and there are cases in all the age groups.
The study showed the need to implement public health programs to revert the obesity tendency in the young Lacandon population to avoid in long term the burden of non-communicable diseases that would affect most of their productive life.
Los lacandones son considerados descendientes de la civilización maya que se refugiaron en la selva durante la colonización española. Ellos vivieron en aislamiento absoluto hasta la década de los 90, cuando los procesos de culturización llegaron a la selva. En este estudio de investigación transversal incluimos al 46.7% del total de la población lacandona. Se les determinaron peso y talla, así como glucosa de ayuno, urea, creatinina, ácido úrico, hemoglobina, colesterol HDL y triglicéridos. El índice de masa corporal (IMC) y la edad tuvieron una correlación positiva para menores de 40 años (r=0.51). La prevalencia de diabetes es de 1.1%, siendo todos los casos en la comunidad que está más culturalizada (Palenque). La prevalencia de prediabetes es de 5.85%; todos los casos también presentan hipertrigliceridemia, y el 19% de los casos de prediabetes se dan entre los 10 y 19 años de edad. La prevalencia de hipercolesterolemia fue de 20.7% y la de hipertrigliceridemia fue de 45.1% en todos los grupos de edad. El estudio muestra que hay que implementar programas de salud pública para revertir la tendencia a la obesidad en la población lacandona joven, y evitar a largo plazo que las enfermedades crónicas o no transmisibles pudieran afectar a la mayoría de sujetos en edad productiva.
The Lacandones are considered descendants of the Maya Civilization that found refuge in the jungle during the Spanish colonization. They were able to live in absolute isolation thanks to a well-balanced explotation of the jungle's natural resources to cover their needs. Their diet was based on corn, papaya, bananas, poultry, fish and shellfish. They refer to themselves as hach winik which means “true men”.1
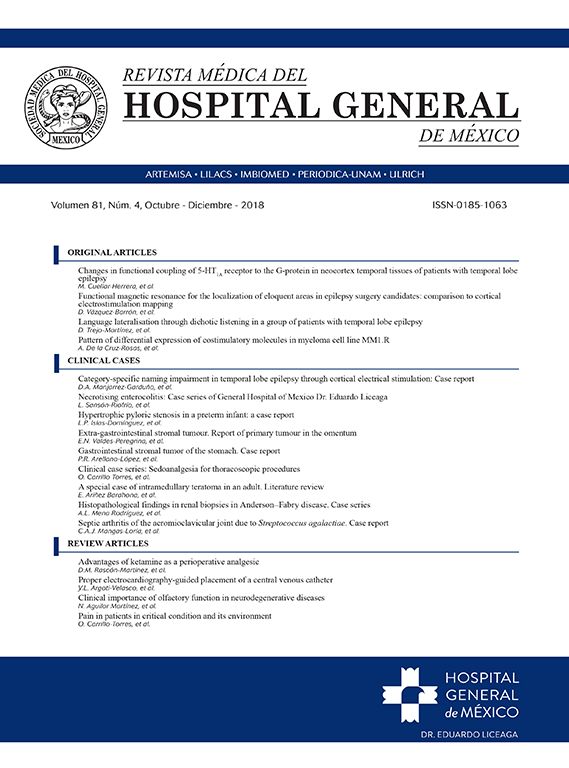
The Lacandon territory known as the “Lacandon Jungle” is in the southeast of Mexico. It is situated between the Usumacinta and Salinas rivers and the border with Guatemala. The weather is mainly hot-humid (23–27°C). It rains constantly except in March and April.2
The Lacandon population is concentrated in two counties of the Mexican state Chiapas: Ocosingo and Palenque. The most isolated communities are in Ocosingo, and the most traditional town is Na-há. According to the National Commission for the Indigenous Communities Development, the current Lacandon population is 769; 394 are male and 375 female, 65.8% depend on agriculture and livestock. They live in 165 houses, and in the last two decades the Lacandones have been provided with electrical energy, water delivery systems, telephone. 67.9% of the houses are connected to the water delivery system, 20.6% are connected to the drain network, and 92.7% have electric energy.1
After 1994, the Lacandon communities started an active commercial exchange with the tourists that visit the archeological site of Palenque and this has triggered the acculturation process. There are several studies that explored the cultural changes in the Lacandon population,3 and it is well established that socioeconomic status and ethnicity can impact the metabolic indicators.4
The aim of this study was to evaluate some metabolic parameters in the Lacandon population and to compare if there is any difference with the rest of the state and country population. Even more to compare if the Palenque community that has a more contact with the non-indigenous population, and easy access to more industrialize food, and public transportation, has a higher prevalence of obesity and other diseases associated like Diabetes Mellitus Type 2.
MethodsThis is a cross-sectional observational study, carried out with the approval of the Scientific Research Committee of the Mexican Institute of Social Security and the Chiapas Health Council. All the subjects provided informed consent.
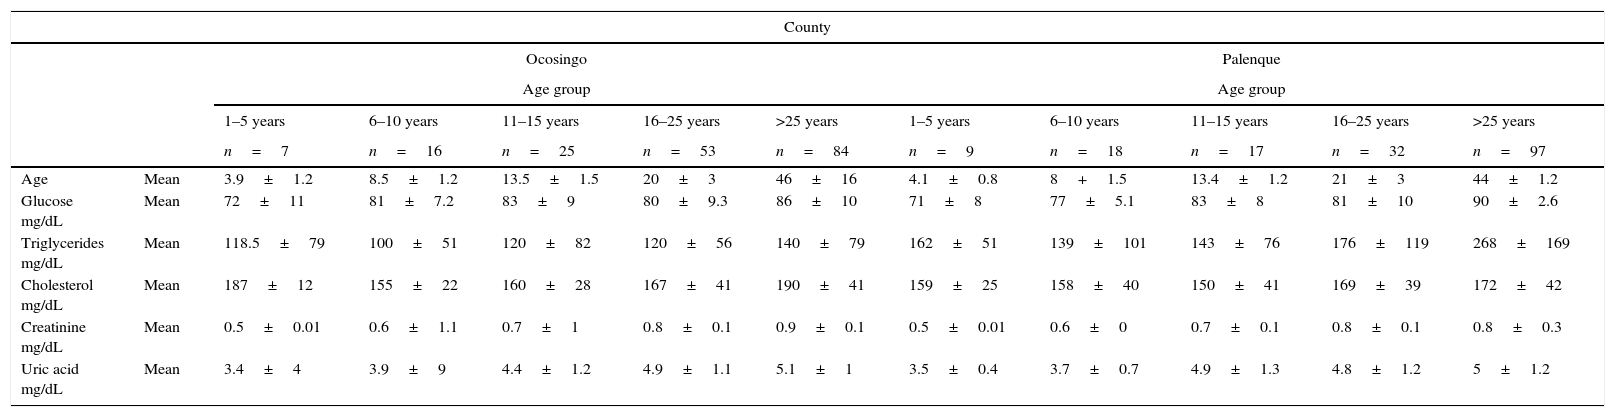
Study populationThis study included 359 subjects that represent the 46.7% of the total Lacandon population. The study included the two counties where the Lacandon population lives: Ocosingo and Palenque. In Ocosingo lies the Nahá community that is considered until now the most isolated Lacandon settlement, and 112 subjects live there. In Palenque there are two Lacandon communities: Metzabok and El Tumbo where 173 of the subjects reside (see Fig. 1). The age distribution of the studied population can be seen in Table 1. The adults in both communities represent the 64.3% of the studied population, and 11 (3%) of them are older than 77 that is the life expectancy in Mexico, the oldest person of the studied community is 98 years old. There is no significant difference of the mean age in both counties (p=0.39).

Lacandones data by age group and county.
| County | |||||||||||
|---|---|---|---|---|---|---|---|---|---|---|---|
| Ocosingo | Palenque | ||||||||||
| Age group | Age group | ||||||||||
| 1–5 years | 6–10 years | 11–15 years | 16–25 years | >25 years | 1–5 years | 6–10 years | 11–15 years | 16–25 years | >25 years | ||
| n=7 | n=16 | n=25 | n=53 | n=84 | n=9 | n=18 | n=17 | n=32 | n=97 | ||
| Age | Mean | 3.9±1.2 | 8.5±1.2 | 13.5±1.5 | 20±3 | 46±16 | 4.1±0.8 | 8+1.5 | 13.4±1.2 | 21±3 | 44±1.2 |
| Glucose mg/dL | Mean | 72±11 | 81±7.2 | 83±9 | 80±9.3 | 86±10 | 71±8 | 77±5.1 | 83±8 | 81±10 | 90±2.6 |
| Triglycerides mg/dL | Mean | 118.5±79 | 100±51 | 120±82 | 120±56 | 140±79 | 162±51 | 139±101 | 143±76 | 176±119 | 268±169 |
| Cholesterol mg/dL | Mean | 187±12 | 155±22 | 160±28 | 167±41 | 190±41 | 159±25 | 158±40 | 150±41 | 169±39 | 172±42 |
| Creatinine mg/dL | Mean | 0.5±0.01 | 0.6±1.1 | 0.7±1 | 0.8±0.1 | 0.9±0.1 | 0.5±0.01 | 0.6±0 | 0.7±0.1 | 0.8±0.1 | 0.8±0.3 |
| Uric acid mg/dL | Mean | 3.4±4 | 3.9±9 | 4.4±1.2 | 4.9±1.1 | 5.1±1 | 3.5±0.4 | 3.7±0.7 | 4.9±1.3 | 4.8±1.2 | 5±1.2 |
Measurements included weight, height, overnight fasting plasma glucose (FPG), urea, creatinine, uric acid, hemoglobin, triglycerides and cholesterol levels.
Weight and height were measured in the standing position using a fixed scale with stadimeter. All subjects wore light clothing. The precision of weight and height measurements was 0.1kg and 0.01m. Body Mass Index (BMI) was calculated as weight (kilograms) divided by height (meters) squared. Venous blood samples were collected after an overnight fasting of 10–12h.
AssaysPlasma glucose concentrations were determined with the Synchron CX4 System of Beckman Coulter TM using a timed endpoint method (Beckman Coulter, U.S.). The intra-assay and inter-assay coefficients of variation for glucose measurements were 1.10% and 1.11%, respectively. Triglycerides were measured enzymatically and HDL cholesterol fraction obtained after precipitation by phosphotungstic reagent. The intra- and inter-assay coefficients of variation were 1.7% and 3% for triglycerides, and 1.3% and 2.6% for HDL-cholesterol.
DefinitionsThe American Diabetes Association (ADA) Guidelines for classification were used to classify the population based on fasting plasma glucose (FPG) as following: prediabetes for FPG between 100 and 125mg/dL, and diabetes for FPG higher than 126mg/dl.5
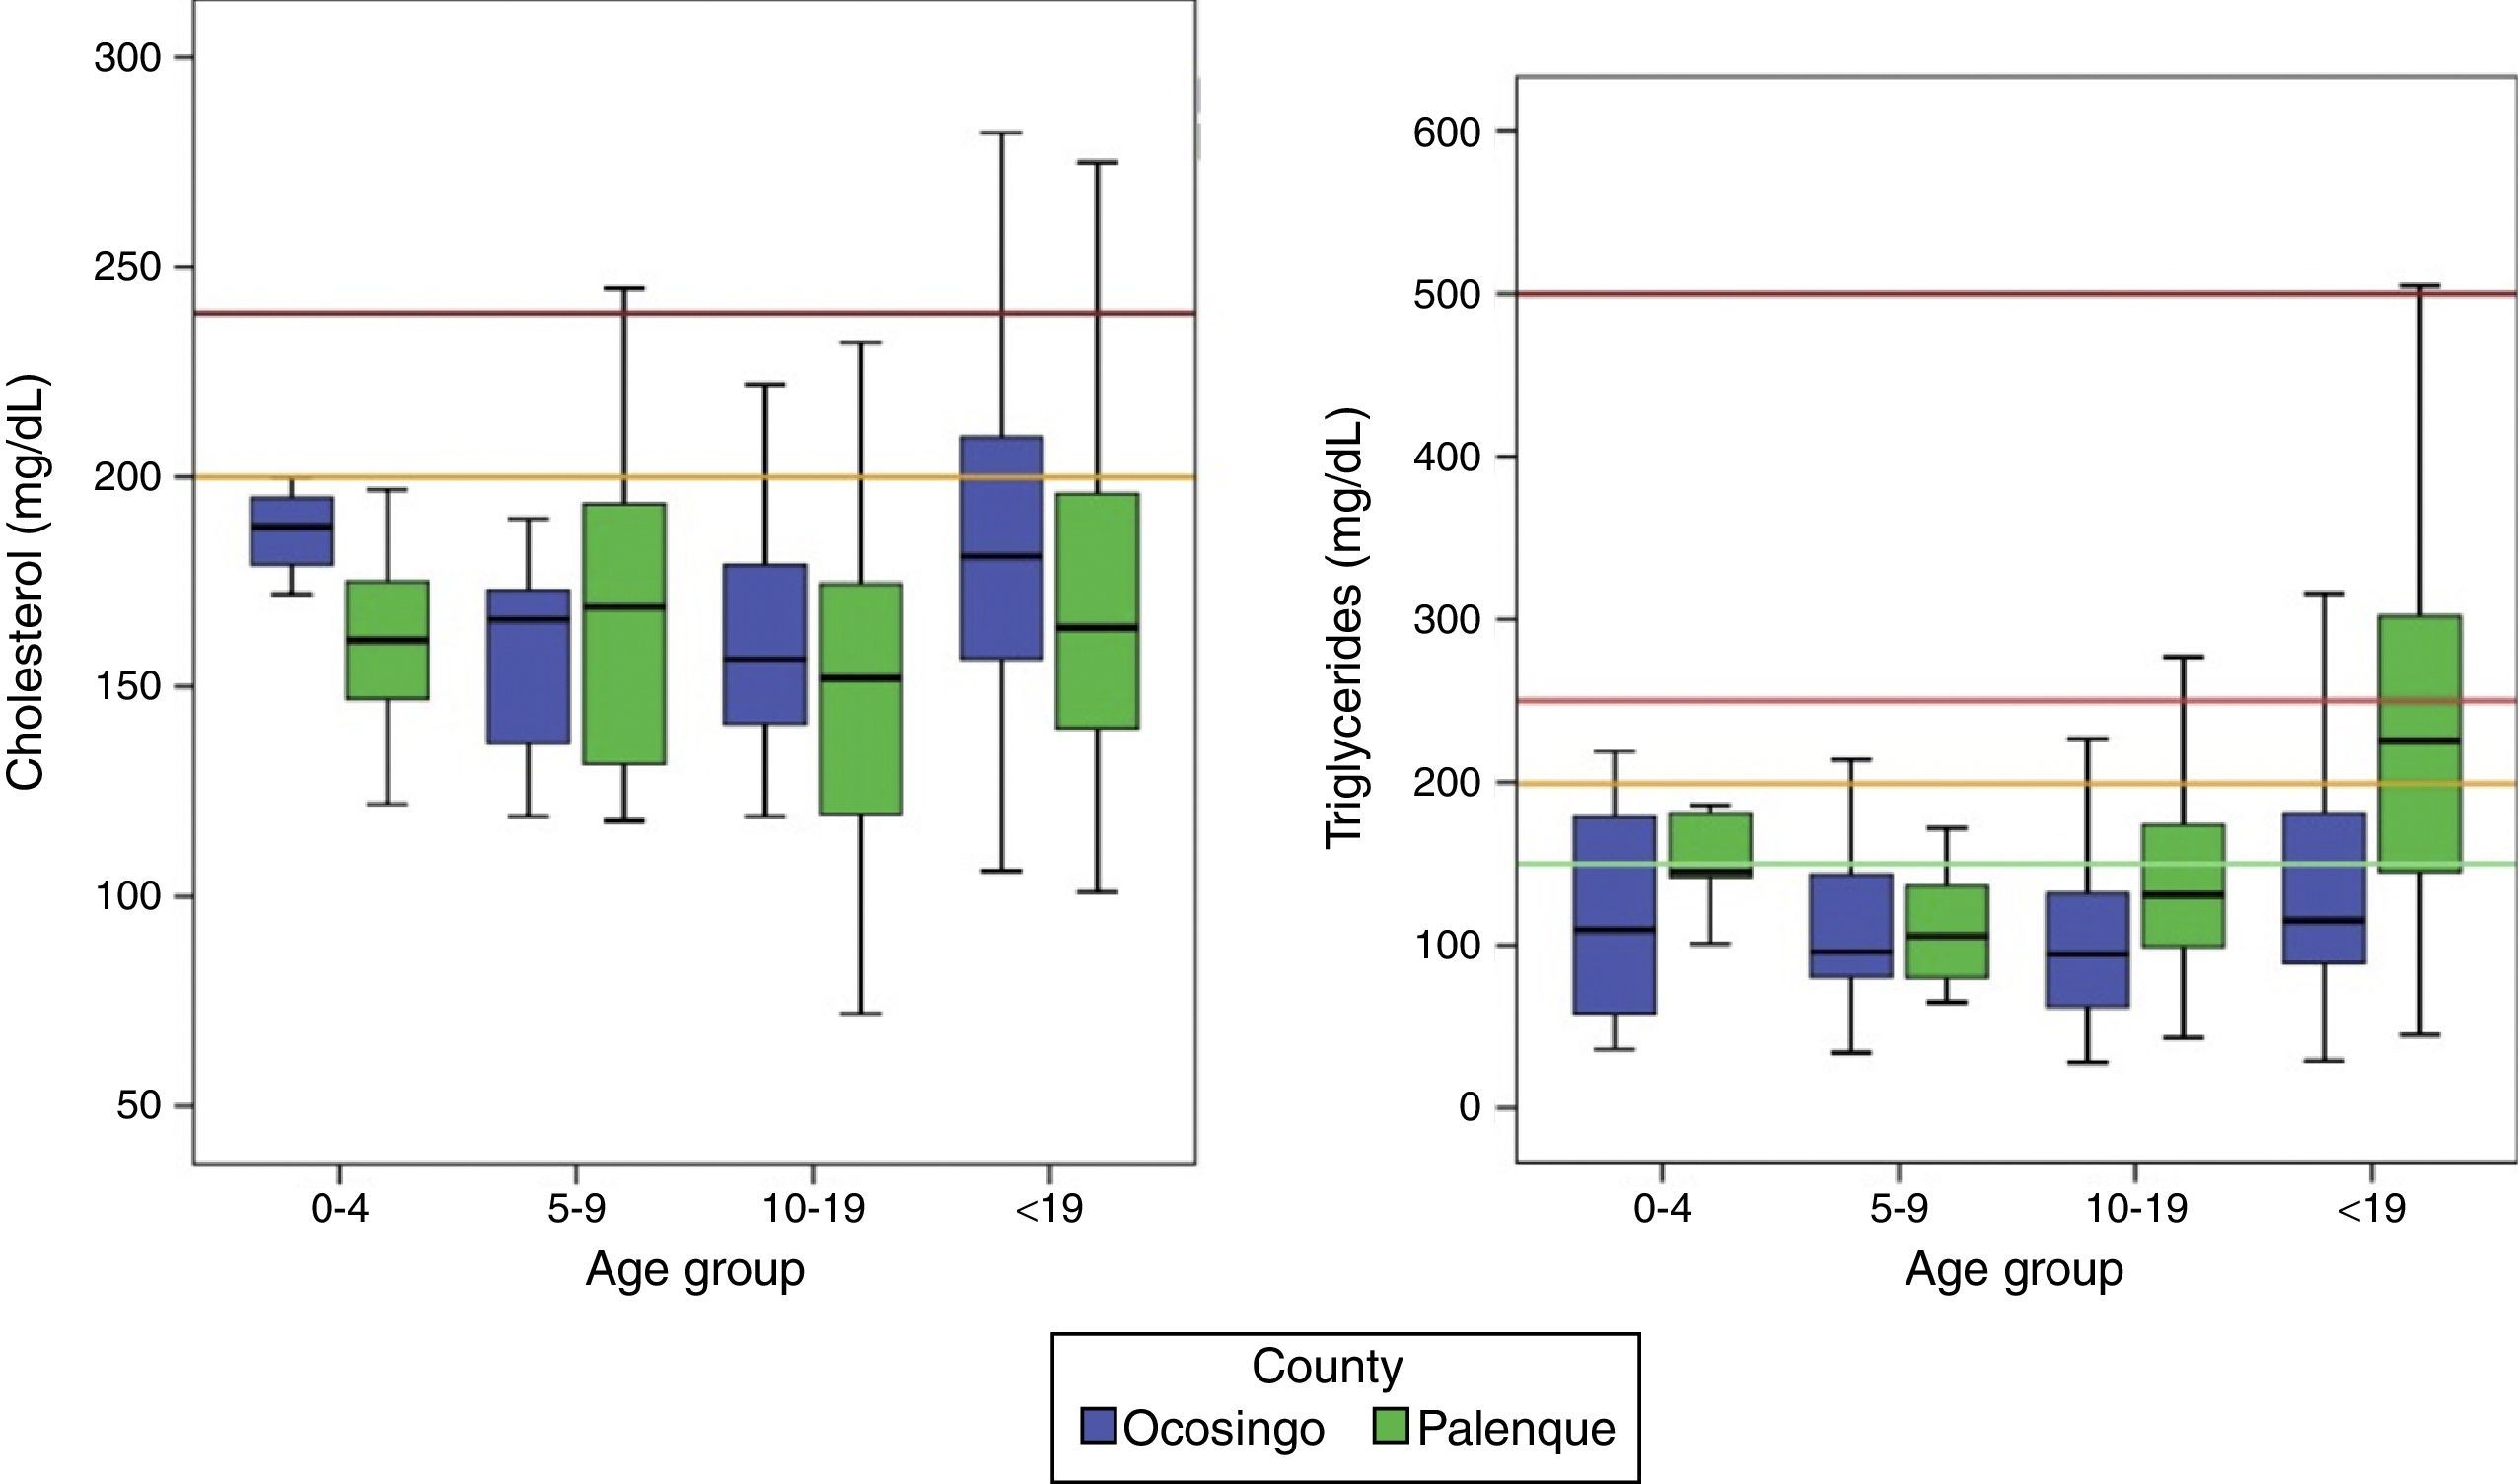
Total cholesterol and triglycerides were classified according to the National Cholesterol Education Program ATPIII.6 Total cholesterol is defined as normal if lower than 200mg/dl, borderline-high from 200 to 239mg/dl and high from 240mg/dl. For triglycerides, concentrations lower than 150mg/dl are considered normal, 150 to 199mg/dl are borderline-high, high from 200 to 499mg/dl and very high at 500mg/dl or greater.
Anemia was determined based on the World Health Organization guidelines.7 The World Health Organization proposed a classification of the significance of anemia in public health.8 Anemia prevalence less than 5% is considered normal, 5–19.9% is mild, moderate if between 20% and 39.9%, and severe if 40% or higher.
For children up to 5 years old Z-Scores were estimated with the Anthropometric Calculator of the software WHO Anthro.9 The calculated scores were length and height for age, weight for length and BMI for age.
Statistical analysisSPSS (IBM) was used for data management and statistical analysis. The continuous variables are presented as a mean±standard deviation or median and interquartile ranks. Categorical variables are shown as N, frequencies or percentages. Because of the sample size a descriptional and trend analysis was done.
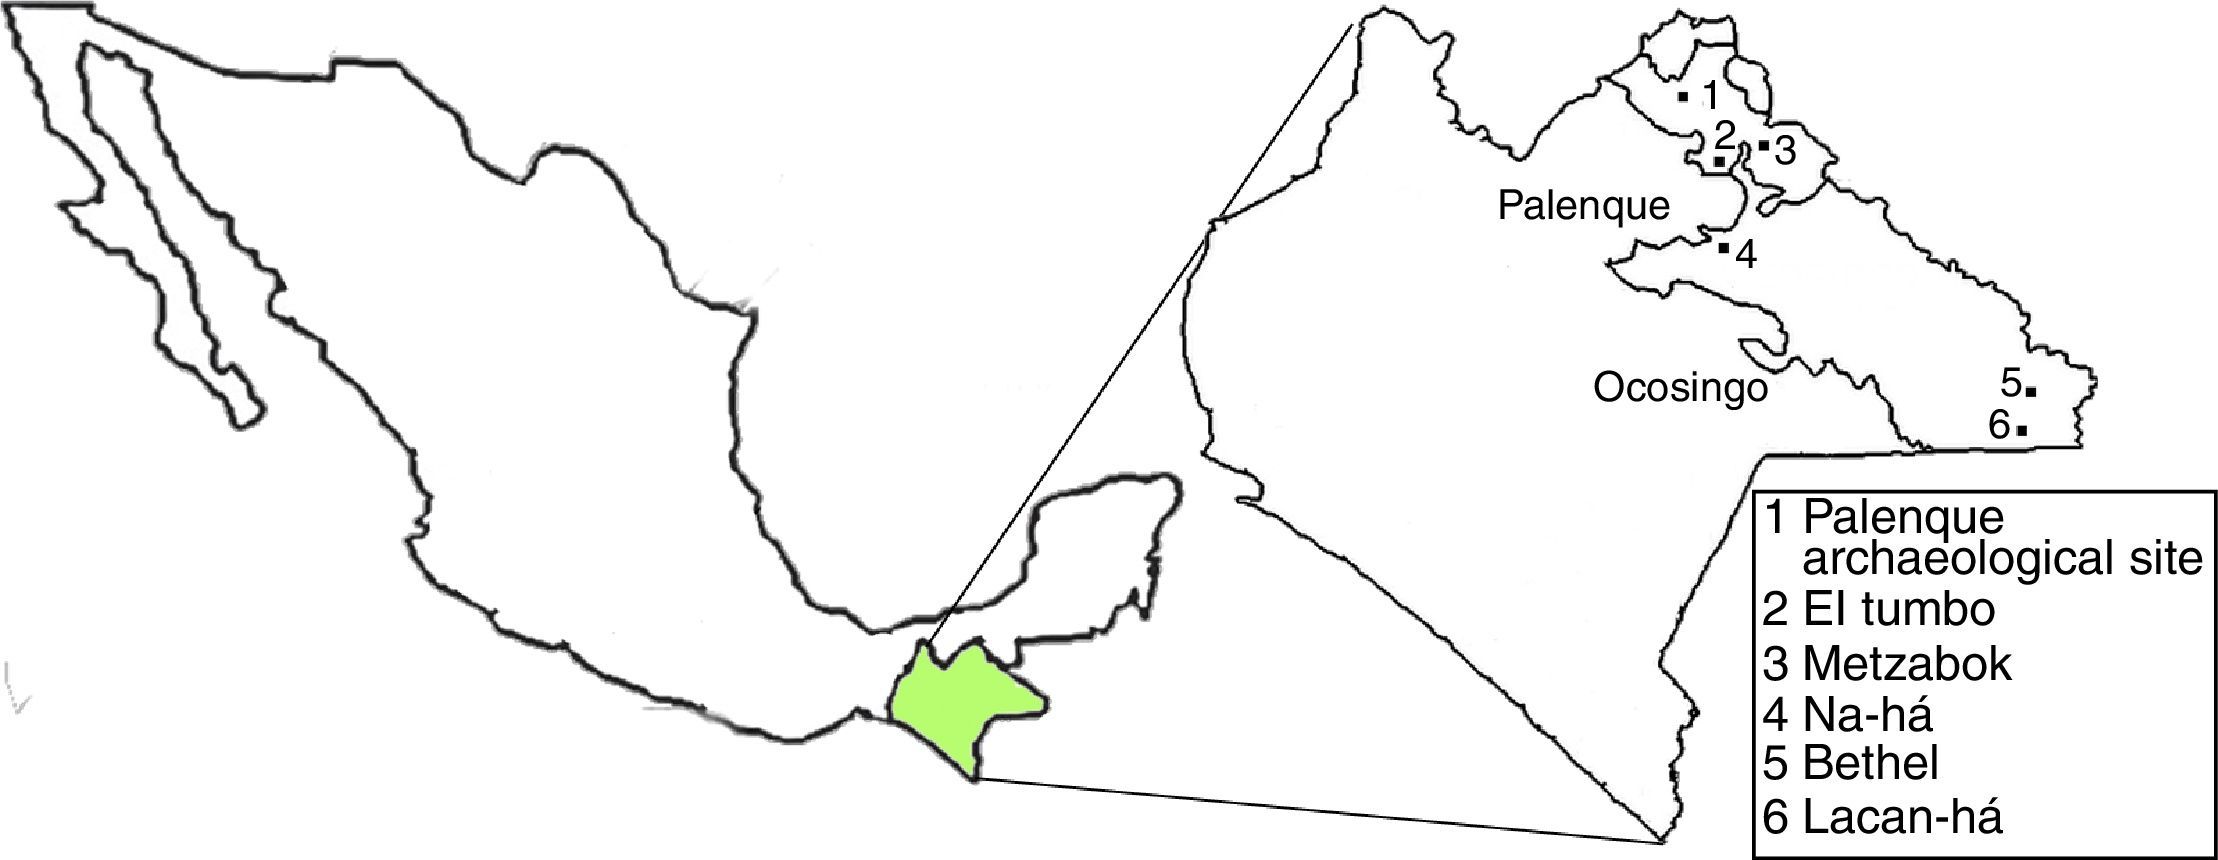
ResultsThe distribution of BMI by age is plotted in Fig. 2. It should be noticed two tendencies there, for the subjects under 40 years old there is a positive significant correlation between age and body mass index (r=0.51, p<0.0001), and for the subjects older than 40 the correlation is negative (r=−0.407, p=0.007).
 by age.")
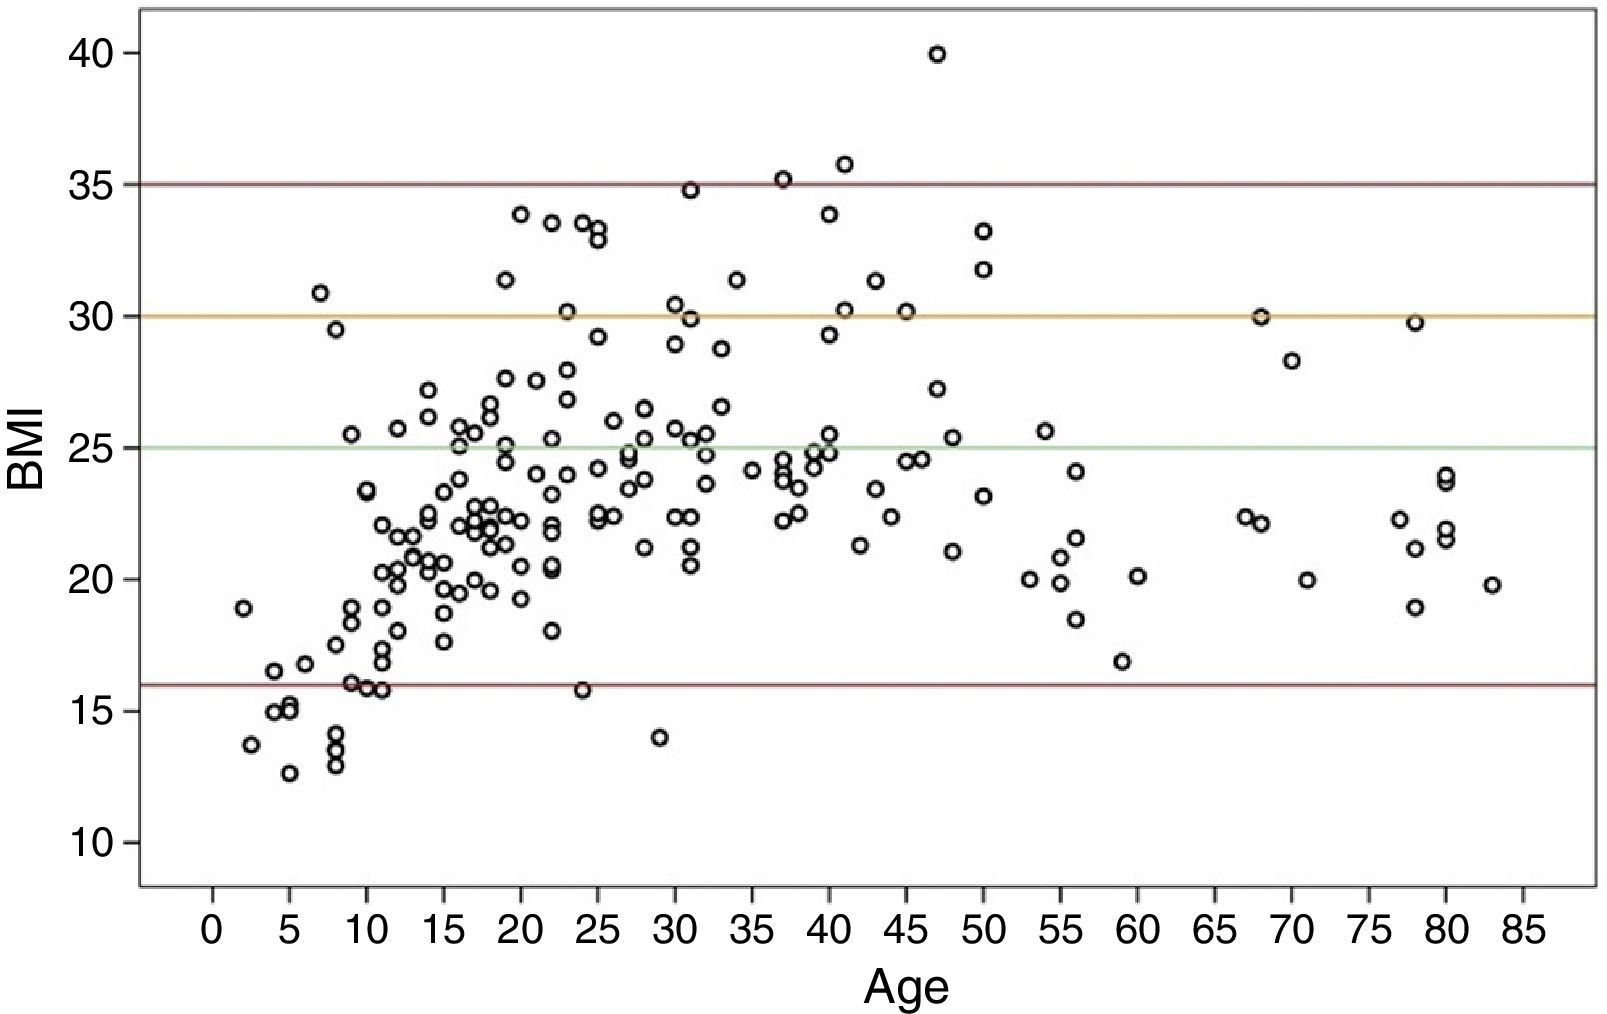
Diabetes prevalence was 1.1% (95% CI, 0.32–1.91%); all the cases correspond to adults living in Palenque, as it can be seen in Fig. 3. The prediabetes prevalence is 5.85% (95% CI, 4.1–7.62%). The prevalence of prediabetes in the population between 11 and 25 years old is 3.94% (95% CI, 1.22–6.6%), and 8.79% (95% CI, 5.9–11.68%) for subjects older than 25.
 by age and county.")
The mean concentration of cholesterol for the Palenque population is 167mg/dl and for Ocosingo is 176mg/dl, there is significant difference between both groups (p=0.02).
20.7% (95% CI, 17–23%) of the Lacandon population has cholesterol levels higher than 200mg/dl, 6.4% (95% CI, 4.6–8.3%) are above the 240mg/dl and 14.1% (95% CI, 11–16.2%) are in the borderline high group; 20.4% and 75.5% are in the group of 10–19 years and older than 19 respectively. This means that 11.6% of the 10–19 group are in the borderline high of the cholesterol.
The mean concentration of triglycerides for Palenque population is 220mg/dl and for Ocosingo is 127mg/dl, there is a significant difference between the two communities (p<0.001). The distribution by age group can be seen in Table 1. Only 54.9% (95% CI, 51.1–58.6%) has normal concentration of triglycerides, 12.8% (95% CI, 10.3–15.3%) of the Lacandones is in the borderline high, 26.4% (95% CI, 23.4–30%) are in the high group and 2.5% (95% CI, 1.3–3.7%) in the very high classification according to the ATPIII guidelines. 23.7% (95% CI, 15.2–32.2%) of the subjects between 11 and 25 years have triglycerides concentrations above the 150mg/dl (Fig. 4).

In Palenque, the prevalence of borderline high triglycerides is 14% (95% CI, 10.3–17.8%), the high prevalence is 39.8% (95% CI, 34.5–45%) and the very high cases are 5.3% (95% CI, 2.8–7.7%). Therefore only 40.9% have triglycerides concentrations below 150mg/dl. In Ocosingo the 12.4% (95% CI, 8.9–15.9%) of the population has borderline high triglycerides and 15.8% (95% CI, 12–19.7%) has high triglycerides, the rest (71.8%) has normal concentrations.
The mean of urea concentration is 21.7mg/dl and 22.1% for Palenque and Ocosingo respectively. The creatinine mean for both counties is 0.8mg/dl. There is a high correlation between the age and the creatinine concentration (r=0.382). The uric acid mean is 4.7mg/dl for Palenque and 4.8mg/dl for Ocosingo.
71.5% of the children under 5 years presents less than 1 standard deviation in the Z-score weight for height, and the mean value is Zwh=0.39. The weight for age Z-score mean is Zwa=0.19. 28.5% has more than 1 standard deviation in the Z-score BMI for age. The glucose mean was 72mg/dl. There is mean triglycerides concentration is 149±61mg/dl, mean cholesterol is 168±25mg/dl. The prevalence of the anemia in the studied population was 10% (95% CI, 6.7–13.3%). Most of the cases correspond to mild or moderate anemia; there was just one case of severe anemia in a 5 years old girl.
DiscussionThe geographic localization of the Lacandon communities kept them isolated for the Spanish conquest up to recent time. They became more involved with the tourist that visit the Palenque Archeological Site and other Chiapas’ communities due to the construction roads and the introduction of public transportation systems. This also allowed the young people to assist to public schools in nearby towns. The social and cultural impact of the acculturation process has already been documented (1, 3), but recently it has increased due to the use of the telephone and internet (satellite). Therefore it is important to determinate if there is some impact also in the health of the Lacandon population.
The prediabetes national prevalence is 26.6%,10 while in the Lacandon population is 5.85%. Even when there is a significant difference it is important to notice that 19% of the prediabetic patients are between 10 and 19 years old and their mean age is 16. This can be explained because this age group is more vulnerable to the acculturation process and the consumption of sugared soft drinks and industrialized candies. It is important to revert this tendency otherwise if it progress to diabetes, the so call later complications will be present in this population earlier than expected.11,12
All diabetes cases are adults, and the prevalence (1.1%) is lower than in the rest of the country and Chiapas where it is 9.2% and 5.6% respectively.13 In Fig. 3 it can be seen that all the cases are located in Palenque the most acculturated county, and the mean age of the diabetics is 53 years old.
Even when the diabetes prevalence is also lower than in the rest of the country, the high-triglycerides concentration could be the result of a high-carbohydrate diet14 that could trigger a high glucose concentration and increase, in medium term, the diabetes prevalence. We analyzed the lipids of the prediabetics and all the Palenque's cases had also hypertriglyceridemia. In the case of the diabetic patients all of them had also triglycerides higher than 250mg/dl.
The results of this study reflect the necessity to develop a public health program to revert the tendency to obesity in the young Lacandon population in order to avoid the burden that non-communicable diseases associated to obesity. A significant prediabetes cases are younger than 19, therefore if their condition become diabetes, the disease will affect most of their productive life. The intervention should mainly targeted to the young population, but it should also be ethnically sensitive in order to be well accepted for the Lacandon community.
The hypercholesterolemia (higher than 200mg/dl) in Mexico is 13%, and for Chiapas is 12.2% while for the Lacandon population is 20.7% (95% CI, 17–23%). Since there are cases of hypercholesterolemia in all the age groups and in both counties it is necessary to perform a follow-up study to asses if it is due to familial hypercholesterolemia.15
The analysis of the population pyramid showed a gap in the children under 5 years old. It is possible that the parents did not take the younger children to the health center where the measurements and samples were collected due to difficulty to get there from the most isolated towns.
The last decades the anemia prevalence in Mexico has continuously decreased.13 The prevalence of anemia for adults in Mexico is 8.2% while in the Lacandon population is 1.9%. The overall anemia prevalence does not represent a public health problem for the Lacandon population according with the WHO classification system.8
The results of this study is consistent with the study of Castro et al. that found that Lacandon genetic information has significant differences with respect to the rest of the Mexican population.16
Ethical disclosuresProtection of human and animal subjectsThe authors declare that the procedures followed were in accordance with the regulations of the relevant clinical research ethics committee and with those of the Code of Ethics of the World Medical Association (Declaration of Helsinki).
Confidentiality of dataThe authors declare that they have followed the protocols of their work center on the publication of patient data.
Right to privacy and informed consentThe authors have obtained the written informed consent of the patients or subjects mentioned in the article. The corresponding author is in possession of this document.
Conflict of interestThe authors have no conflict of interests to declare.
The authors gratefully acknowledge the Chiapas Health Council for the logistic support.