

WHOQOL-BREF measures the individual's perception on their personal situation in contrast to their expectations, goals, standards and concerns. Previous results did not support the original factor structure in a sample of 9 Iberoamerican countries. However, Differential Item Functioning (DIF) has yet to be thoroughly addressed in these populations. Therefore, the main purpose of this study was to analyze DIF in Iberoamerican countries. WHOQOL-BREF was administered to a sample of 1972 individuals from nine Spanish-speaking countries and ages between 17 and 34 years (mean=21.21, SD=3.40, 62.5% women). In order to assess the DIF, each item was modeled through a proportional odds logistic regression with nationality in the linear predictor. All models were statistically non-equivalent to the null models and the proportion of correct classification of the models ranging from 0.336 to 0.473, which leads us to conclude that the nationality of the participants plays a relevant role on the response in the items of WHOQOL-BREF. In spite of a common language, differences in cultural, historical, and social variables across these nine countries could be influencing the individual's perception of quality of life. In order to minimize those differences, specific adaptations of the Spanish-version of WHOQOL-BREF for each country should be considered.
WHOQOL-BREF mide la percepción del individuo de su situación personal en relación con sus expectativas, metas, estándares y preocupaciones. Los resultados publicados anteriormente en una muestra de 9 países iberoamericanos no avalan la estructura factorial original. Sin embargo, el funcionamiento diferencial de los ítems aún debe ser abordado a fondo en estas poblaciones. Por lo tanto, el objetivo principal de este estudio fue analizar el funcionamiento diferencial de los ítems en los países iberoamericanos. Se administró el WHOQOL-BREF a una muestra de 1.972 personas de 9 países de habla hispana y edades entre los 17 y los 34 años (media=21,21, DE=3,40, 62,5% mujeres). Con el fin de evaluar el funcionamiento diferencial de los ítems cada uno de estos fue modelado a través de una regresión logística de probabilidades proporcionales con la nacionalidad en el predictor lineal. Todos los modelos fueron estadísticamente no equivalentes a los modelos nulos, con porcentajes de clasificación correcta entre 0,336 y 0,473, lo que nos lleva a la conclusión de que la nacionalidad de los participantes juega un papel relevante en la respuesta de los elementos de WHOQOL BREF. A pesar de utilizar un lenguaje común, las diferencias en las variables culturales, históricas y sociales en estos 9 países podrían estar influyendo en la percepción del individuo sobre la calidad de vida. Con el fin de minimizar esas diferencias se debe considerar realizar adaptaciones de la versión española del WHOQOL-BREF específicas para cada país.
In 1995, the World Health Organization workgroup on quality of life (QOL) defined QOL as an individual's perception of their position in life in the context of the culture and value systems in which they live in relation to their expectations, goals, standards and concerns (The World Health Organization Quality of Life Group [WHOQOL], 1995). It is implicit in this definition that quality of life is a subjective assessment about the relevant aspects in people's lives, also included in a social and cultural context. Taking into account this definition, the WHOQOL group developed an instrument to assess QOL, the World Health Organization Quality Of Life (WHOQOL-100) (WHOQOL Group, 1998). This questionnaire has 100 items on 25 facets, organized into 6 domains, showing acceptable psychometric properties (WHOQOL Group, 1998). The WHOQOL group itself created yet another instrument, the abbreviated version of the WHOQOL-100, called WHOQOL-BREF. It is a short version of the original questionnaire, intended for limited-time situations.
Both instruments could be used cross-culturally in non-Spanish speaking populations because of the psychometric studies results (Saxena, Carlson, Billington, & Orley, 2001). The questionnaire has been validated in different countries and languages, but even so there are only a few studies about the Spanish version of the WHOQOL-BREF (Benitez-Borrego, Guàrdia-Olmos, & Urzúa-Morales, 2014; Espinoza, Osorio, & Torrejón, 2011; Lucas-Carrasco, 2012; Lucas-Carrasco, Laidlaw, & Power, 2011). More specifically, Benitez-Borrego et al. (2014) found an alternative structure for the WHOQOL-BREF through an Exploratory Structural Equation Modeling analysis (ESEM). The authors conducted the ESEM analysis with a 1972-student sample from 9 Spanish-speaking countries: Costa Rica, Peru, Mexico, Cuba, Paraguay, Argentina, Colombia, Spain and Chile, and they set up an alternative four-factor structure.
These results led these authors to complete the analysis by conducting a multi-group analysis of structural invariance of the WHOQOL-BREF (Benitez-Borrego, Guàrdia-Olmos, Urúza-Morales, & Peró-Cebollero, in preparation) through an Exploratory Structural Equation Model. Although the results provided evidence regarding the invariance of factor loadings, the new findings do not support the invariance of the intercepts. In this sense, it is reasonable to think that differences in responses to items between these nine countries cannot be explained in terms of differences of latent factors. If so, it would be possible to find Differential Item Functioning (DIF) in this instrument.
DIF exists when groups of individuals do not have the same probability of answering an item in the same way (Ferne & Rupp, 2007). It examines the relationship between item response and another variable (a group variable, like gender or nationality). These grouping variables have influence in the score obtained in the underlying construct, such as quality of life. The research question posed in DIF analyses is whether, showing the same value in the measured latent trait, the response to an item is different depending on the group pertinence (Teresi & Fleishman, 2007). In our study, this control was conducted in the previous study (Benitez-Borrego et al., 2014).
Several approaches for DIF analysis have been proposed. These include tests in three-way contingency tables, a logistic regression, and methods based on the item-response theory (Scott et al., 2009). Examples of procedures based on contingency tables are the Mantel Chi-square procedure and the Mantel–Haenszel method. Regarding the methods based on the item-response theory, one choice is the 1-parameter Rasch model. This model is built on the premise that it is possible to formulate a mathematical function that adequately describes the probability of respondents, at different levels of the dimension, to endorse a response option in a rating scale (Cameron, Scott, Adler, & Reid, 2014).
Several studies addressed DIF in cross-cultural investigations. For instance, Ryan, Horvath, Ployhart, Schmitt, and Slade (2000) applied DIF analysis in a Global Employee opinion survey across 36 countries, and they found evidence of greater DIF for 3 items of the survey. Recently, some investigation groups performed DIF analyses in different psychological tests and questionnaires. For example, it has been found that between 40% and 50% of NEO-PI's items exhibited DIF in the samples comparison of the United States, the Philippines and Mexico (Church et al., 2011). Also, the Rosenberg Self-Esteem Scale showed DIF presence in some items between the United States and China (Song, Cai, Brown, & Grimm, 2011) that could be explained by the more extreme responses of American participants.
In the area of psychological assessment, the 4-Dimensional Symptom Questionnaire about distress, depression, anxiety and somatization showed DIF in all the subscales except for the distress scale in a sample of Polish and Dutch participants (Czachowski, Terluin, Izdebski, & Izdebski, 2012). Recently, a study of the Conditional Reasoning Test for Aggression (CRT-A) with samples from Croatia and the United States showed strong DIF, which led to the conclusion that CRT-A is susceptible to cultural changes (Galić, Scherer, & LeBreton, 2014). Works without significant DIF in the studied items can also be found. For example, the Communicative Participation Item Bank (CPIB) applied to a Parkinson's sample from New Zealand and the United States exhibited no significant DIF in their items (Baylor et al., 2014).
In Education research, it is pertinent to investigate whether groups have the same probability or not of answering an item correctly (Paek & Wilson, 2011). One example is the study carried out by Kreiner and Christensen (2013) about the Program for International Student Attainment (PISA), and they found strong DIF in different items.
The data from apparently similar populations often show subtle differences which turn out relevant for the proper measurement of the factor under evaluation. In the case of quality of life measurements, these effects can be more important than in other latent traits, given that the goal is to obtain invariant measurements structures between apparently similar populations. That is the case of populations from Spanish-speaking countries: small cultural important differences may generate differences in the traits evaluated. More specifically, it is a wide portion of citizens who share their language but who have different language and cultural traits which, regarding quality of life, may be interpreted differently or with nuances implying different realities.
Therefore, despite common linguistic roots, the cultural and social realities of these countries are diverse, and although a few studies about DIF in the WHOQOL-BREF have been performed in different populations (Krägeloh et al., 2013; Liang et al., 2009; Rocha, Power, Bushnell, & Fleck, 2012; Wang, Yao, Tsai, Wang, & Hsieh, 2006), this issue has not been addressed in Spanish-speaking countries.
Since DIF was found in most of the above-mentioned studies about WHOQOL-BREF, and given the lack of support to the model of intercept invariance (as found in Benitez-Borrego et al., in preparation) which could suggest the existence of DIF, we consider it important to perform this kind of study in Spanish-speaking samples, which have shown DIF in other questionnaires. For example, DIF was found in the Coping Responses Inventory-Youth Form (CRI-Y) with samples from Mexico and Spain (Osorno, Gómez-Benito, Segura, Forns, & Kirchner, 2010). Therefore, it is reasonable to inquire whether or not it also exists in WHOQOL-BREF in Spanish-speaking populations.
Due to the diverse countries of origin of our sample and the scarcity of studies related to DIF in the Spanish version of WHOQOL-BREF, the main purpose of the present article is to analyze the DIF in a sample of individuals from nine Iberoamerican countries, where we expect to find different response patterns in the items of the questionnaire.
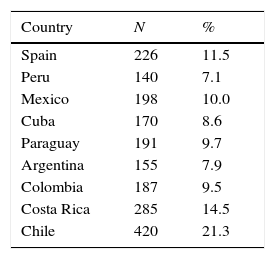
MethodParticipants: The sample for this study consisted of 1972 individuals with ages between 17 and 34 years (mean=21.21, SD=3.40, 62.5% women). All participants were recruited from nine Spanish-speaking countries, and their distribution is shown in Table 1. No statistically significant differences were found between countries with respect to their age and sex distributions or concerning their socio-demographic conditions, which leads us to assume certain homogeneity across the nine subsamples assessed (χ2=32.18, p=0.08 for sex distribution, and Kruskal–Wallis χ2=242.88, p=0.11 for age) (Benitez-Borrego et al., 2014).
Finally, uncompleted protocols were excluded from the analysis, as were those participants who did not fully understand the task.
Instrument: The WHOQOL-BREF is a 26-item subset from the WHOQOL-100 that assesses the individual's perception of quality of life and health in a Likert scale ranging from 1 to 5. The first two items measure the overall quality of life, and the individual's satisfaction with health, respectively. The remaining items can be grouped into four dimensions of QOL, namely: Physical Health (7 items), Psychological Health (6 items), Social Relationship (3 items), and Environment (8 items). Higher scores in all scales indicate a higher quality of life. Related to its psychometric characteristics of the Spanish version (Lucas-Carrasco, 2012), the internal consistency assessed through Cronbach's alpha in healthy individuals assumed acceptable values (0.74 for Physical Health, 0.69 for Psychological Health, 0.75 for Social relationships, and 0.77 for Environmental), except for the Psychological Health scale. Similar values were found by Benitez-Borrego et al. (2014) in the global sample. Across the nine countries included in the study, Cronbach's alphas ranged from 0.65 to 0.82 in the Physical scale, from 0.68 to 0.88 for the Psychological scale, from 0.63 to 0.79 for the Social scale, and from 0.70 to 0.83 for the Environtmental scale.
Procedure: In each country included in our sample, a trained team administered and corrected the protocols to all participants before calculating both the total and factor scores. Incorrectly administered protocols were discarded, as well as those questionnaires with interrupted or partial responses. The same guidelines in administration and correction of raw scores were applied in each participating country.
Data analysis: After the descriptive and exploratory analysis of the observed distributions, each item was modeled through a proportional odds logistic regression available in R package MASS (Venables & Ripley, 2002). It is assumed that the response to each item is a discretization of a latent continuous variable and that the log-odds do not depend on the category of the outcome. This technique aims to model a response variable that takes values in k ordered categories with probabilities π1(x), π2(x), …, πk(x) given the covariate values x. Being the probability of the response variable taking values equal to or less than a category j, P(Y≤j|x)=π1(x)+π2(x)+⋯+πj(x), the cumulative logits are defined as (Agresti, 2002; McCullagh, 1980, 1989)

The proportional odds logistic model is stated as
where αj are the intercepts and β are the regression effects. Finally, the odds of the response being equal to or less than j at x=x1 are exp[β′(x1−x2)] times the odds at x=x2.
In our particular scenario, the response in each item was modeled with the nationality as the predicting variable. Considering that the current validation was performed on a Spanish sample, this category was chosen as a reference. Results of the effects associated with nationality in each model were presented in terms of odds ratios in order to provide an interpretable magnitude of the effects. In each item, the existence of DIF was considered whenever the confidence interval of the odds ratio did not include the value of 1. In addition, according with the general characteristics of the logistic model, we assume the non-uniform function in the distribution of effects through the different countries.
ResultsIn this section all the results obtained in the different analyses will be presented, including the goodness of fit of the models and the odd ratios with their confidence interval.
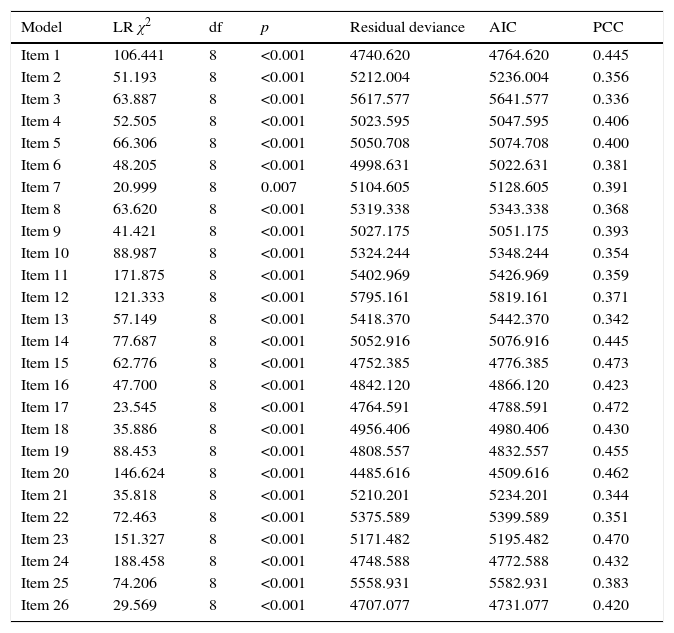
Deviance analysis is summarized in Table 2, along with the proportion of correct classification for each model with the nationality as a predictor. All models were statistically non-equivalent to the null models, which leads to a relevance of the nationality on the response. The proportion of correct classification ranged from 0.336 to 0.473, which implies that the nationality of the participants allowed us to predict their response in the items in proportions between those values.
Results of the fit models for each item.
| Model | LR χ2 | df | p | Residual deviance | AIC | PCC |
|---|---|---|---|---|---|---|
| Item 1 | 106.441 | 8 | <0.001 | 4740.620 | 4764.620 | 0.445 |
| Item 2 | 51.193 | 8 | <0.001 | 5212.004 | 5236.004 | 0.356 |
| Item 3 | 63.887 | 8 | <0.001 | 5617.577 | 5641.577 | 0.336 |
| Item 4 | 52.505 | 8 | <0.001 | 5023.595 | 5047.595 | 0.406 |
| Item 5 | 66.306 | 8 | <0.001 | 5050.708 | 5074.708 | 0.400 |
| Item 6 | 48.205 | 8 | <0.001 | 4998.631 | 5022.631 | 0.381 |
| Item 7 | 20.999 | 8 | 0.007 | 5104.605 | 5128.605 | 0.391 |
| Item 8 | 63.620 | 8 | <0.001 | 5319.338 | 5343.338 | 0.368 |
| Item 9 | 41.421 | 8 | <0.001 | 5027.175 | 5051.175 | 0.393 |
| Item 10 | 88.987 | 8 | <0.001 | 5324.244 | 5348.244 | 0.354 |
| Item 11 | 171.875 | 8 | <0.001 | 5402.969 | 5426.969 | 0.359 |
| Item 12 | 121.333 | 8 | <0.001 | 5795.161 | 5819.161 | 0.371 |
| Item 13 | 57.149 | 8 | <0.001 | 5418.370 | 5442.370 | 0.342 |
| Item 14 | 77.687 | 8 | <0.001 | 5052.916 | 5076.916 | 0.445 |
| Item 15 | 62.776 | 8 | <0.001 | 4752.385 | 4776.385 | 0.473 |
| Item 16 | 47.700 | 8 | <0.001 | 4842.120 | 4866.120 | 0.423 |
| Item 17 | 23.545 | 8 | <0.001 | 4764.591 | 4788.591 | 0.472 |
| Item 18 | 35.886 | 8 | <0.001 | 4956.406 | 4980.406 | 0.430 |
| Item 19 | 88.453 | 8 | <0.001 | 4808.557 | 4832.557 | 0.455 |
| Item 20 | 146.624 | 8 | <0.001 | 4485.616 | 4509.616 | 0.462 |
| Item 21 | 35.818 | 8 | <0.001 | 5210.201 | 5234.201 | 0.344 |
| Item 22 | 72.463 | 8 | <0.001 | 5375.589 | 5399.589 | 0.351 |
| Item 23 | 151.327 | 8 | <0.001 | 5171.482 | 5195.482 | 0.470 |
| Item 24 | 188.458 | 8 | <0.001 | 4748.588 | 4772.588 | 0.432 |
| Item 25 | 74.206 | 8 | <0.001 | 5558.931 | 5582.931 | 0.383 |
| Item 26 | 29.569 | 8 | <0.001 | 4707.077 | 4731.077 | 0.420 |
LR χ2: Likelihood Ratio Test; df: degrees of freedom; AIC: Akaike Information Criteria; PCC: proportion of correct classification by the model.
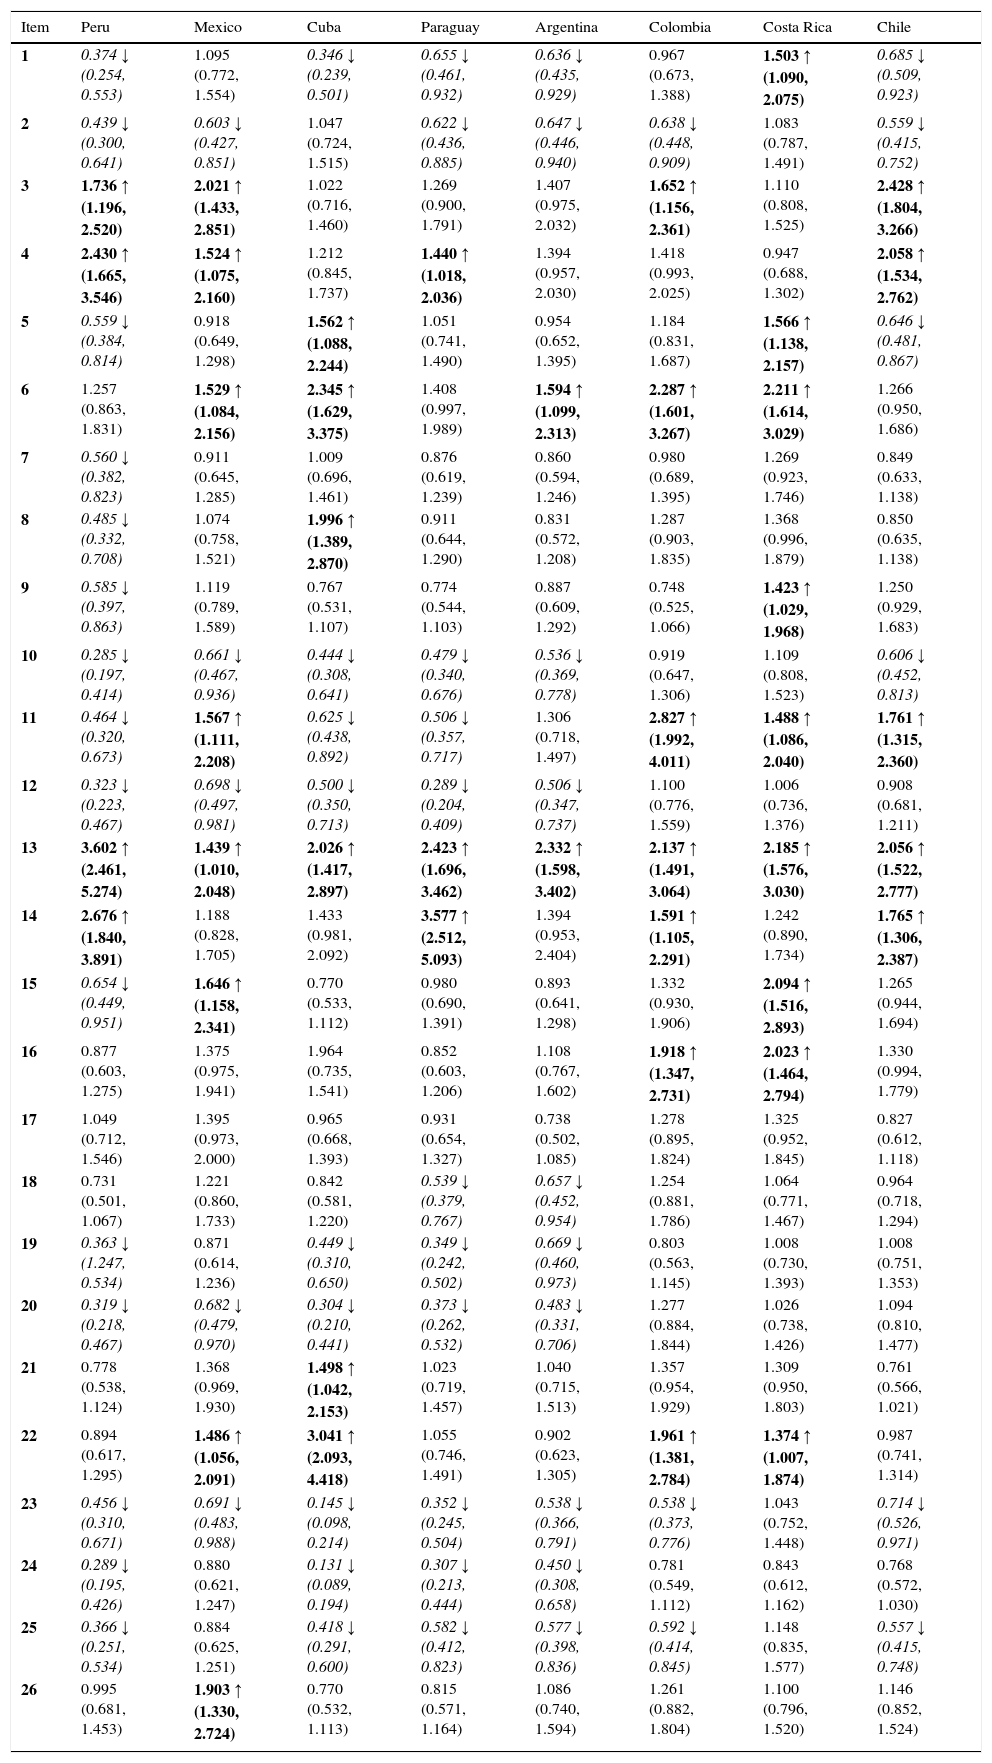
In order to further analyze the impact of nationality on the responses in the questionnaire, we computed the odds ratio of the response, given the valued of nationality based on the models’ results (see Table 3).
Odd ratios and confidence intervals.
| Item | Peru | Mexico | Cuba | Paraguay | Argentina | Colombia | Costa Rica | Chile |
|---|---|---|---|---|---|---|---|---|
| 1 | 0.374 ↓ (0.254, 0.553) | 1.095 (0.772, 1.554) | 0.346 ↓ (0.239, 0.501) | 0.655 ↓ (0.461, 0.932) | 0.636 ↓ (0.435, 0.929) | 0.967 (0.673, 1.388) | 1.503 ↑ (1.090, 2.075) | 0.685 ↓ (0.509, 0.923) |
| 2 | 0.439 ↓ (0.300, 0.641) | 0.603 ↓ (0.427, 0.851) | 1.047 (0.724, 1.515) | 0.622 ↓ (0.436, 0.885) | 0.647 ↓ (0.446, 0.940) | 0.638 ↓ (0.448, 0.909) | 1.083 (0.787, 1.491) | 0.559 ↓ (0.415, 0.752) |
| 3 | 1.736 ↑ (1.196, 2.520) | 2.021 ↑ (1.433, 2.851) | 1.022 (0.716, 1.460) | 1.269 (0.900, 1.791) | 1.407 (0.975, 2.032) | 1.652 ↑ (1.156, 2.361) | 1.110 (0.808, 1.525) | 2.428 ↑ (1.804, 3.266) |
| 4 | 2.430 ↑ (1.665, 3.546) | 1.524 ↑ (1.075, 2.160) | 1.212 (0.845, 1.737) | 1.440 ↑ (1.018, 2.036) | 1.394 (0.957, 2.030) | 1.418 (0.993, 2.025) | 0.947 (0.688, 1.302) | 2.058 ↑ (1.534, 2.762) |
| 5 | 0.559 ↓ (0.384, 0.814) | 0.918 (0.649, 1.298) | 1.562 ↑ (1.088, 2.244) | 1.051 (0.741, 1.490) | 0.954 (0.652, 1.395) | 1.184 (0.831, 1.687) | 1.566 ↑ (1.138, 2.157) | 0.646 ↓ (0.481, 0.867) |
| 6 | 1.257 (0.863, 1.831) | 1.529 ↑ (1.084, 2.156) | 2.345 ↑ (1.629, 3.375) | 1.408 (0.997, 1.989) | 1.594 ↑ (1.099, 2.313) | 2.287 ↑ (1.601, 3.267) | 2.211 ↑ (1.614, 3.029) | 1.266 (0.950, 1.686) |
| 7 | 0.560 ↓ (0.382, 0.823) | 0.911 (0.645, 1.285) | 1.009 (0.696, 1.461) | 0.876 (0.619, 1.239) | 0.860 (0.594, 1.246) | 0.980 (0.689, 1.395) | 1.269 (0.923, 1.746) | 0.849 (0.633, 1.138) |
| 8 | 0.485 ↓ (0.332, 0.708) | 1.074 (0.758, 1.521) | 1.996 ↑ (1.389, 2.870) | 0.911 (0.644, 1.290) | 0.831 (0.572, 1.208) | 1.287 (0.903, 1.835) | 1.368 (0.996, 1.879) | 0.850 (0.635, 1.138) |
| 9 | 0.585 ↓ (0.397, 0.863) | 1.119 (0.789, 1.589) | 0.767 (0.531, 1.107) | 0.774 (0.544, 1.103) | 0.887 (0.609, 1.292) | 0.748 (0.525, 1.066) | 1.423 ↑ (1.029, 1.968) | 1.250 (0.929, 1.683) |
| 10 | 0.285 ↓ (0.197, 0.414) | 0.661 ↓ (0.467, 0.936) | 0.444 ↓ (0.308, 0.641) | 0.479 ↓ (0.340, 0.676) | 0.536 ↓ (0.369, 0.778) | 0.919 (0.647, 1.306) | 1.109 (0.808, 1.523) | 0.606 ↓ (0.452, 0.813) |
| 11 | 0.464 ↓ (0.320, 0.673) | 1.567 ↑ (1.111, 2.208) | 0.625 ↓ (0.438, 0.892) | 0.506 ↓ (0.357, 0.717) | 1.306 (0.718, 1.497) | 2.827 ↑ (1.992, 4.011) | 1.488 ↑ (1.086, 2.040) | 1.761 ↑ (1.315, 2.360) |
| 12 | 0.323 ↓ (0.223, 0.467) | 0.698 ↓ (0.497, 0.981) | 0.500 ↓ (0.350, 0.713) | 0.289 ↓ (0.204, 0.409) | 0.506 ↓ (0.347, 0.737) | 1.100 (0.776, 1.559) | 1.006 (0.736, 1.376) | 0.908 (0.681, 1.211) |
| 13 | 3.602 ↑ (2.461, 5.274) | 1.439 ↑ (1.010, 2.048) | 2.026 ↑ (1.417, 2.897) | 2.423 ↑ (1.696, 3.462) | 2.332 ↑ (1.598, 3.402) | 2.137 ↑ (1.491, 3.064) | 2.185 ↑ (1.576, 3.030) | 2.056 ↑ (1.522, 2.777) |
| 14 | 2.676 ↑ (1.840, 3.891) | 1.188 (0.828, 1.705) | 1.433 (0.981, 2.092) | 3.577 ↑ (2.512, 5.093) | 1.394 (0.953, 2.404) | 1.591 ↑ (1.105, 2.291) | 1.242 (0.890, 1.734) | 1.765 ↑ (1.306, 2.387) |
| 15 | 0.654 ↓ (0.449, 0.951) | 1.646 ↑ (1.158, 2.341) | 0.770 (0.533, 1.112) | 0.980 (0.690, 1.391) | 0.893 (0.641, 1.298) | 1.332 (0.930, 1.906) | 2.094 ↑ (1.516, 2.893) | 1.265 (0.944, 1.694) |
| 16 | 0.877 (0.603, 1.275) | 1.375 (0.975, 1.941) | 1.964 (0.735, 1.541) | 0.852 (0.603, 1.206) | 1.108 (0.767, 1.602) | 1.918 ↑ (1.347, 2.731) | 2.023 ↑ (1.464, 2.794) | 1.330 (0.994, 1.779) |
| 17 | 1.049 (0.712, 1.546) | 1.395 (0.973, 2.000) | 0.965 (0.668, 1.393) | 0.931 (0.654, 1.327) | 0.738 (0.502, 1.085) | 1.278 (0.895, 1.824) | 1.325 (0.952, 1.845) | 0.827 (0.612, 1.118) |
| 18 | 0.731 (0.501, 1.067) | 1.221 (0.860, 1.733) | 0.842 (0.581, 1.220) | 0.539 ↓ (0.379, 0.767) | 0.657 ↓ (0.452, 0.954) | 1.254 (0.881, 1.786) | 1.064 (0.771, 1.467) | 0.964 (0.718, 1.294) |
| 19 | 0.363 ↓ (1.247, 0.534) | 0.871 (0.614, 1.236) | 0.449 ↓ (0.310, 0.650) | 0.349 ↓ (0.242, 0.502) | 0.669 ↓ (0.460, 0.973) | 0.803 (0.563, 1.145) | 1.008 (0.730, 1.393) | 1.008 (0.751, 1.353) |
| 20 | 0.319 ↓ (0.218, 0.467) | 0.682 ↓ (0.479, 0.970) | 0.304 ↓ (0.210, 0.441) | 0.373 ↓ (0.262, 0.532) | 0.483 ↓ (0.331, 0.706) | 1.277 (0.884, 1.844) | 1.026 (0.738, 1.426) | 1.094 (0.810, 1.477) |
| 21 | 0.778 (0.538, 1.124) | 1.368 (0.969, 1.930) | 1.498 ↑ (1.042, 2.153) | 1.023 (0.719, 1.457) | 1.040 (0.715, 1.513) | 1.357 (0.954, 1.929) | 1.309 (0.950, 1.803) | 0.761 (0.566, 1.021) |
| 22 | 0.894 (0.617, 1.295) | 1.486 ↑ (1.056, 2.091) | 3.041 ↑ (2.093, 4.418) | 1.055 (0.746, 1.491) | 0.902 (0.623, 1.305) | 1.961 ↑ (1.381, 2.784) | 1.374 ↑ (1.007, 1.874) | 0.987 (0.741, 1.314) |
| 23 | 0.456 ↓ (0.310, 0.671) | 0.691 ↓ (0.483, 0.988) | 0.145 ↓ (0.098, 0.214) | 0.352 ↓ (0.245, 0.504) | 0.538 ↓ (0.366, 0.791) | 0.538 ↓ (0.373, 0.776) | 1.043 (0.752, 1.448) | 0.714 ↓ (0.526, 0.971) |
| 24 | 0.289 ↓ (0.195, 0.426) | 0.880 (0.621, 1.247) | 0.131 ↓ (0.089, 0.194) | 0.307 ↓ (0.213, 0.444) | 0.450 ↓ (0.308, 0.658) | 0.781 (0.549, 1.112) | 0.843 (0.612, 1.162) | 0.768 (0.572, 1.030) |
| 25 | 0.366 ↓ (0.251, 0.534) | 0.884 (0.625, 1.251) | 0.418 ↓ (0.291, 0.600) | 0.582 ↓ (0.412, 0.823) | 0.577 ↓ (0.398, 0.836) | 0.592 ↓ (0.414, 0.845) | 1.148 (0.835, 1.577) | 0.557 ↓ (0.415, 0.748) |
| 26 | 0.995 (0.681, 1.453) | 1.903 ↑ (1.330, 2.724) | 0.770 (0.532, 1.113) | 0.815 (0.571, 1.164) | 1.086 (0.740, 1.594) | 1.261 (0.882, 1.804) | 1.100 (0.796, 1.520) | 1.146 (0.852, 1.524) |
Italics and downwards arrows (↓): underestimation when compared to Spanish group; bold and upwards arrows (↑): overestimation when compared to Spanish group.
Differences in the odds were detected in each item of the scale across the countries. More specifically, Peruvian participants scored lower in most of the items, except for those related to the extent to which physical pain interferes with their daily activities, the need for medical treatment, opportunities for leisure and the availability of information, where they scored significantly higher than the Spanish group.
Mexican participants showed a mixed pattern, with lower scores in satisfaction with their own health, as well as in items asking about having enough energy for everyday life, enough money to cover their needs, and satisfaction with relationships and their living place. However, they answered more positively than Spaniards in items concerning the degree of impairment of physical pain, the need for medical treatment, the meaningfulness of their lives, the acceptance of their physical appearance, availability of information, ability to move around, satisfaction with friends support, and the frequency of negative feelings.
As regards Cuban participants, we decreased responses detected lower values in items evaluating the overall quality of life, the energy for everyday life, acceptance of bodily appearance, degree of economic ease, and the respondents’ satisfaction with themselves, personal relationships, conditions of their residence, access to health services, and transport. These participants scored higher in the degree to which they enjoy their life and they feel it to be meaningful, the feeling of safety, availability of information, and their satisfaction with sex life and friends support.
Paraguayan participants scored lower in items measuring the overall quality of life and satisfaction with health, as well as those that evaluated energy in everyday life, physical acceptance, and economic ease. In addition to these, participants from Paraguay scored lower in items regarding satisfaction with one's capacity for work, as well as with oneself, one's personal relationships, living place, access to health services and transportation. This group scored higher than Spaniards when asked to rate their need of medical treatment to function in their daily life, the availability of information, and their opportunities for leisure activities.
Regarding Argentinian participants, they underscored in a similar pattern to the Paraguayan respondents, with the exception that Argentinian participants did not score lower in their physical acceptance. They scored higher than Spaniards only in items measuring the extent to which they felt their lives to be meaningful and the availability of information.
Colombian participants scored lower than Spaniards in items concerning the overall satisfaction with health and their residence, while they scored higher than them in items referring to the interference of pain with their daily routine, the extent to which they feel their lives to be meaningful, their own physical acceptance, the availability of information, and their opportunity for leisure activities. These participants also scored higher in satisfaction about sleep and the support they receive from their friends.
Costa Rican participants in our study showed higher scores in items evaluating the overall quality of life, and the extent to which they enjoy their lives and feel them to be meaningful. In addition to these items, they scored higher when asked to rate their ability to concentrate and get around, the healthfulness of their environment, the acceptance of their physical appearance, and the availability of information, as well as their satisfaction with sleep and support from friends. In the rest of the scale, they responded in a similar pattern to Spanish participants.
Finally, Chilean participants scored lower than Spaniards in items asking them about their overall quality of life and satisfaction with health, in addition to the degree to which they enjoy their lives, they have enough energy for everyday life, and the satisfaction with their living place and modes of transportation. These participants scored higher in items regarding impairment caused by pain, the need of medication, but also in their acceptance of their physical appearance, the availability of information, and the opportunities for leisure activities.
It is difficult to find a lower or higher scores pattern in every item, but it is possible to observe some tendencies. Items 1, 2, 10, 12, 19, 20, 23, 24 and 25 tended to present a lower score in most countries than in Spain. On the other hand, items 3, 4, 6, 13, 14 and 22 showed, in general, higher scores in most countries than in Spain. The rest of the items showed different results. Items 5, 11 and 15 seemed very different depending on the population's country because they showed both lower and higher scores.
Finally, items 7, 8, 9, 16, 17, 18, 21, 26 presented scores no different from Spanish participants, especially item 17, which present no high or low score in any of the sample countries.
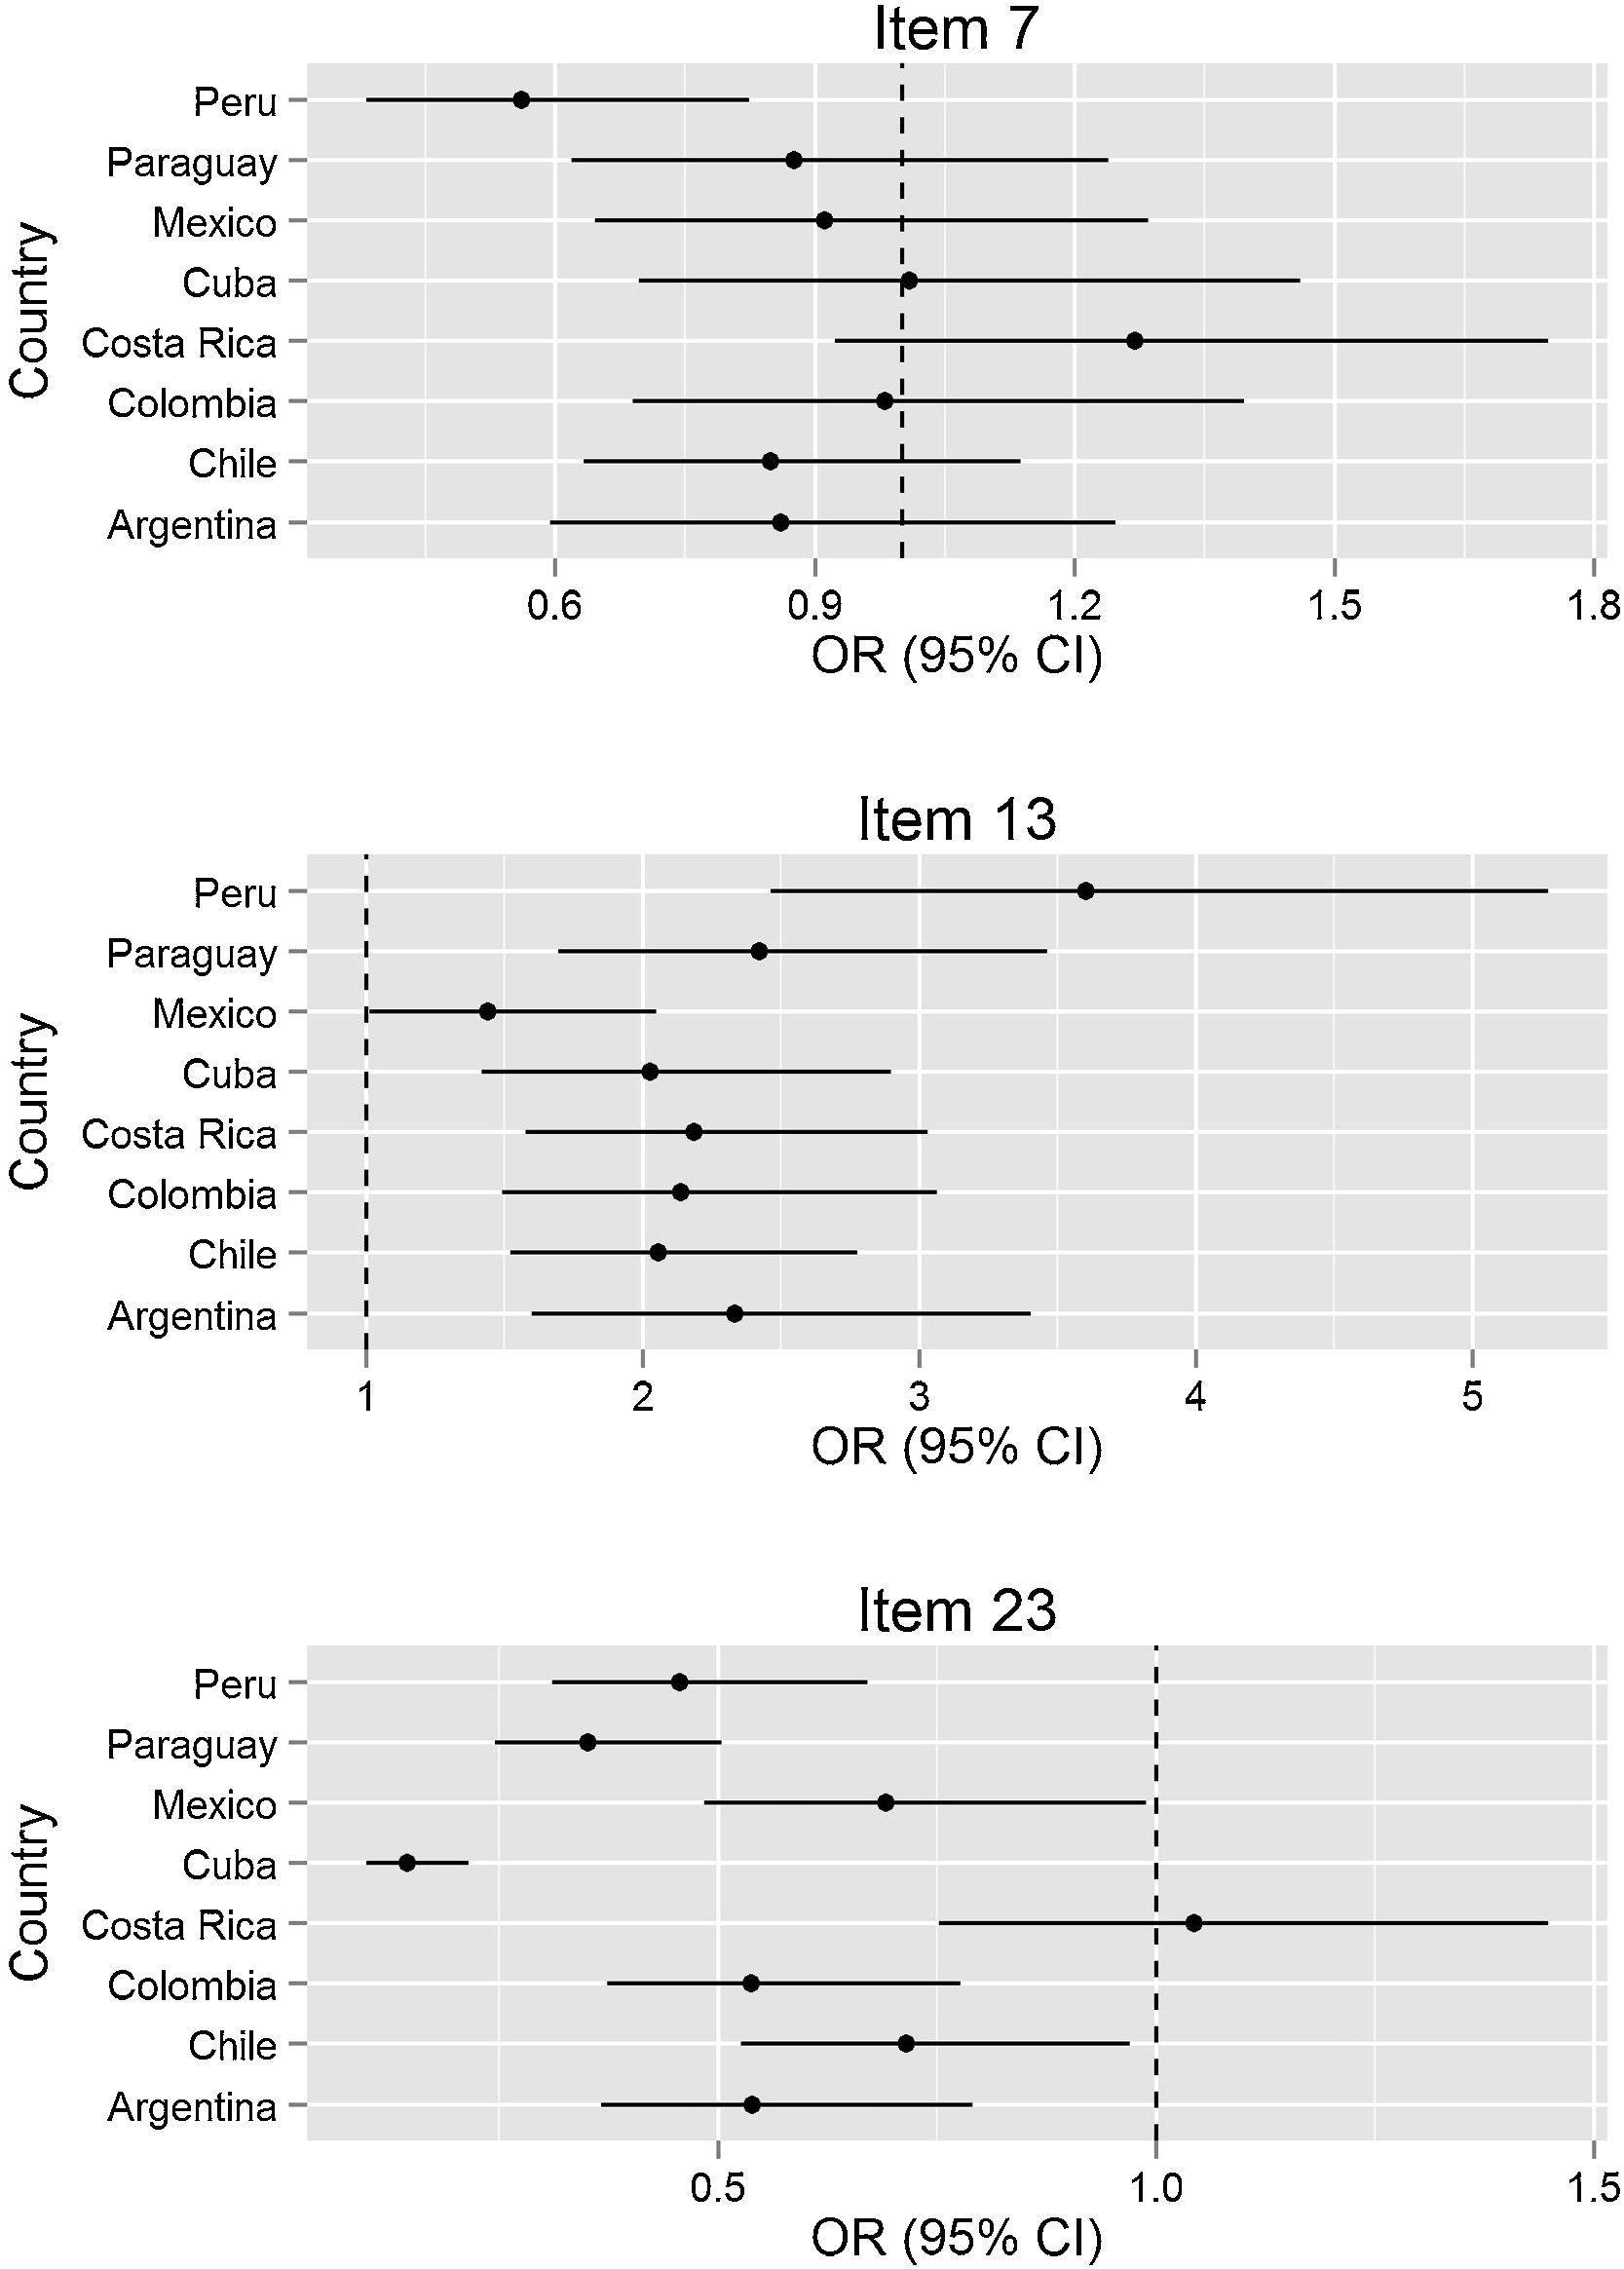
We can find three examples of these tendencies in Fig. 1, where the discontinuous line represents the Spanish score and the continuous line of every country represents the 95% confidence interval of each odd ratio. The central point in the continuous line represented the value of every odd ratio in every country. Item 7 showed similar scores to those of Spanish participants, whereas item 13 showed higher scores and item 23 showed lower ones.

In summary, the present findings provide evidence of different responding patterns in the WHOQOL questionnaire in the Spanish-speaking countries considered in this study, and these patterns are not equivalent to those of Spanish individuals, the population for which the WHOQOL was validated.
DiscussionSeveral psychometric studies have provided evidence on the transcultural validation of WHOQOL-BREF in various languages and countries other than its original version (Fleck et al., 2000; Min et al., 2002; Noerholm et al., 2004; Von Steinbüchel, Lischetzke, Gurny, & Eid, 2006; Yao, Chung, Yu, & Wang, 2002). Likewise, studies with the Spanish version of WHOQOL-BREF confirmed its sound psychometric properties (Espinoza et al., 2011; Lucas-Carrasco, 1998, 2012; Lucas-Carrasco et al., 2011).
In view of the relatively few studies on the factor structure of the tool, Benitez-Borrego et al. (2014) found an alternative 4-factor structure with a better fit that remained invariant across the 9 Spanish-speaking countries. Nevertheless, these authors (Benitez-Borrego et al., in preparation) detected no evidence of intercept invariance in the structural invariance multigroup analysis of WHOQOL-BFREL performed in those 9 countries. The latter result raises questions about the possibility of Differential Item Functioning in this instrument.
This research was motivated by the lack of studies assessing Differential Item Functioning of WHOQOL-BREF in Spanish-speaking populations. This tool has been shown to perform differently across cultures (e.g. Krägeloh et al., 2013; Liang et al., 2009; Rocha et al., 2012; Wang et al., 2006) but no evidence has been brought forward assessing DIF in Iberoamerican populations, despite having been translated and validated in Spanish (Lucas-Carrasco, 2012). The different nuances in vocabulary presented by the regions included in the sample might undoubtedly lead to variations in the way to understand the items and therefore the answer given to each of them. Accordingly, in fields like quality of life, different interpretations might occur as well as different comprehension of subtle aspects which might involve different realities.
For this reason, although these countries share a common language, DIF has been documented in CRI-Y. Accordingly, it is reasonable to consider that nationality might also have an impact on quality of life assessments due to each country's contextual characteristics.
In order to test the effect of nationality on item responses, a proportional odds logistic regression model was conducted for each item of WHOQOL-BREF, reaching proportions of correct classification between 0.336 and 0.473. The results obtained through this technique revealed responding patterns in each country that were not equivalent to those of the reference group. Therefore, the significant effect of nationality should be taken into account.
This finding leads us to consider that the WHOQOL scale could be providing biased estimations of the quality of life of individuals according to their nationality, which would hinder future comparison studies. According to the definition of the concept of Quality of Life (WHOQOL Group, 1995), each individual's perception of their position in life is tightly related to the cultural context and value system of their social network. Thus, and in spite of a common language, differences in cultural, historical, and social variables across these nine countries could be influencing dimensions that affect this individual perception of quality of life.
Therefore, in light of the results obtained here, it would be necessary to perform specific adaptations of the Spanish-version of WHOQOL-BREF for the countries considered in order to minimize the influence of those differences.
It should not be overlooked that the lack of a uniform pattern in the Differential Item Functioning across the countries reflects the complexity in identifying the origin of such differentiation. For this reason, a complete study on bias is necessary in order to trace the source of this differential behavior in the items of WHOQOL-BREF.
It might be an excellent idea to adapt a questionnaire like WHOQOL-BREF to different cultural contexts. Despite the fact that the participants of this study speak the same language, the cultural and social reality of every country is very different. Therefore, an adaptation to the different realities may provide more specificity in the scores of each participant and could improve the possible hints of the day-to-day context.
In conclusion, we can confirm that there exists a different item functioning in the WHOQOL-BREF depending on the participants’ country. It is important to keep that in mind when we intend to interpret the scores and, especially, if we intend to compare results between different countries. An item adaptation would help to narrow these differences and would facilitate a results comparison.
FundingThis study was supported by the Grup de Recerca en Tècniques Estadístiques Avançades Aplicades a la Psicologia (GTEAAP). This research was made possible by the PSI2010-21214-C02-01 project and was carried out by members of the Generalitat de Catalunya's SGR 326 Consolidated Research Group.
Conflicts of interestThe authors declare that there is no conflict of interest.
Ethical approvalAll procedures performed in this study were in accordance with the ethical standards of the 1964 Helsinki declaration and its later amendments or comparable ethical standards.
Informed consentInformed consent was obtained from all individual participants included in the study.
This study was supported by the Grup de Recerca en Tècniques Estadístiques Avançades Aplicades a la Psicologia (GTEAAP). This research was made possible by the PSI2010-21214-C02-01 project and was carried out by members of the Generalitat de Catalunya's SGR 326 Consolidated Research Group.
