

Research on tourism has been enormously benefited from the marketing of services literature in the understanding of satisfaction, its antecedents and its consequent factors. Recent emphasis on customers’ experiences has shifted the focus to a redefinition of the antecedents of satisfaction. However, to the best of our knowledge, there is currently no comparative analysis set out to determine whether experiences under this new framework may suggest a more significant influence on satisfaction among city travelers. Our study delves into these phenomena for the specific case of short lasting touristic city trips, a type of tourism not sufficiently studied for its relevance in terms of growth and turnover. From a survey of a sample of 136 British city travelers, using Structural Equation Modeling, we compare the Quality and Value of Services frameworks and the Experience Economy framework in a series of three regression models in order to determine which one shows higher explanatory power, measured by means of the resulting regression coefficient. The experiential factor seems to show slightly better explanatory power on both value and satisfaction opinions.
La investigación sobre turismo se ha visto muy beneficiada por la literatura sobre el marketing de servicios a fin de comprender la satisfacción, sus antecedentes y sus factores consecuentes. El reciente énfasis sobre las experiencias de los consumidores ha trasladado el objeto de interés hacia una redefinición de los antecedentes de la satisfacción. No obstante, y a nuestro entender, no existen actualmente análisis empíricos comparativos que muestren si las experiencias, tal y como son entendidas bajo este nuevo enfoque, puedan sugerir una influencia más significativa sobre la satisfacción entre los turistas urbanos. Nuestro estudio profundiza en estas relaciones para el caso específico de los viajes turísticos cortos o escapadas de turismo urbano, un tipo de turismo cuya relevancia, en términos de crecimiento y facturación, no ha sido suficientemente estudiada. Partiendo de una muestra de 136 viajeros británicos, utilizando ecuaciones estructurales, comparamos los esquemas conceptuales de la calidad y el valor de los servicios, y de la economía de la experiencia, en una serie de tres modelos de regresión, para determinar cuál de ellos tiene mayor poder explicativo, realizando la medición mediante el coeficiente de regresión. El factor de la experiencia parece mostrar una mayor capacidad explicativa tanto en las opiniones sobre valor como de satisfacción.
Traditionally, the study of the determinants of customer satisfaction in Marketing has been focused on the following: expectations, disconfirmation of expectations, performance, affect, and equity (Szymansky & Henard, 2001). Disconfirmation of expectations, or the definition of expectations as comparative referents, deserved special attention (Cohen, Cohen, West, & Aiken, 2003), very particularly, the assessment of value and quality as antecedents of satisfaction. During the end of the 1980s and the 1990s, with the focus on reaching higher quality levels in products and services, advances were made both in disentangling the concepts of perceived quality, value satisfaction and its interrelations (Cronin & Taylor, 1992; Parasuraman, Zeithaml, & Berry, 1985; Zeithaml, 1988) and in developing measurement scales, such as SERVQUAL (Parasuraman, Zeithaml, & Berry, 1988; Zeithaml, Parasuraman, & Berry, 1990) and SERVPERF (Cronin & Taylor, 1992, 1994; Cronin, Brady, & Hult, 2000) in services, or GLOVAL (Sánchez, Callarisa, Rodríguez, & Moliner, 2006), PERVAL (Sweeney & Soutar, 2001; Williams & Soutar, 2009) and SERV-PERVAL (Petrick & Backman, 2002) in the context of touristic traveling.
More recently, the focus on customers’ own experiences, especially in the case of hospitality and touristic services, has added new insights in this long-standing trend to include ‘relevant higher level abstractions’ (Zeithaml, 1988). As Pine and Gilmore (1999) state, “when a customer buys a service, he purchases a set of intangible activities carried out on his behalf. But when he buys an experience, he pays to spend time enjoying a series of memorable events that a company stages to engage him in a personal way” (p. 2). An experience is defined “as the mental impact felt and remembered by an individual caused by the personal perception of external stimuli” (Sundbo & Sorensen, 2013, p. 4).
A central tenet from this Experience Economy framework (Holbrook & Hirschman, 1982; Pine & Gilmore, 1999; Schmitt, 1999) is its focus on customer's experiences instead of functional features and benefits. According to Schmidt, “experiences provide sensory, emotional, cognitive, behavioral, and relational values that replace functional values” (1999, p. 55). An experience happens in people's minds; it is determined by external stimuli, and moderated by the mental awareness from earlier experiences, mental needs such as self-realization or lowering stress, and personal strategies (Sundbo & Sorensen, 2013). Experiences are more intangible than services, as even a same receiver may experience the same performance in different ways (Sundbo, 2009). Many reasons are found in the recent literature for this change of focus. Sundbo argues that modern societies’ sufficiency of lower level needs in Maslow's pyramid of needs has led to seeking experiences as a vehicle for satisfying higher order needs and reducing the boredom of modern life (2009, p. 436). Bryman (1999) acknowledges a ‘disneyisation’, of a growing number of sectors in modern societies, the clearest signal of which is the theming of spaces and areas with the aim to provoke “coherence and concentration of the experience” (Marlin, 1994, p. 105, as cited by Bryman, 1999, p. 33). From a marketing perspective, Pine and Gilmore (2014) argue that consumers seek conformance of the purchasing and consumption act with self-image, in terms of “both who they are and who they aspire to be” (p. 29), and that this is reason for which “goods and services must give way to experiences as the new predominant form of new economic output” (p. 22).
A crucial difference with respect to the focus on servicing is whether the provider's intention is to provoke an experience. In the specific field of the study of city break traveling, research addressing the combined analysis of functional, affective and conative dimensions and their mutual effects on resulting factors such as repurchase or word-of-mouth is scarce. To the best of our knowledge, we have not found works delving into the comparison between functional attributes defining quality and value of services and the above mentioned sensory or emotional feelings attributable to this shift of focus toward the experiential values in the consumer's mind.
With these ideas in mind, the central aim of our study is to determine empirically up to which extent this shift of focus brings an improvement to the understanding of tourist value and satisfaction of traveling. To this end, we focus on city break traveling, a type of touristic activity that, compared to vacation traveling, is characterized by lower risk, lower involvement and, in many cases, a greater amount of autonomy from the side of travelers. Secondly, we aim to add more insight to the knowledge of this niche type of tourism that, despite the fact of being increasingly acknowledged by city managers and administrators (Dunne, Flanagan, & Buckley, 2011), is yet to receive the attention it deserves from the academy.
This article is organized as follows. Below is a characterization of city breaks as a distinctive type of urban touristic trips. The third section is a brief revision of the concepts of value and quality, for which we formulate the research hypotheses between both and with respect to the resulting factor of satisfaction. In the fourth section we present the Experience Economy framework and formulate the research hypotheses of the causal relationships between its constituent factors and satisfaction. The fifth section explains the empirical study and describes its results. Finally, we close our study with the concluding remarks and its main limitations and future lines of research.
Main features of city break travelingCity tourism in Europe has become the clear leader of the European tourism industry in terms of number of tourists and growth, with an average relative change in total bednights of 3.5% (ECM Report 2014). The city breaks phenomenon is an eminently European one. It may be classified within the wider context of urban tourism. According to Ashworth and Page (2011), academic research on the conduct of tourists in the urban destination can be characterized into four main features: selectivity, rapidity, repetition and capriciousness. Urban tourists are selective in the sense that they make use of a small portion of all that the city has on offer, due to budgetary and time–space restrictions. Rapidity refers to the especially limited amount of time, constraining the total stay to periods of few days or even a few hours for the case of small cities. The third characteristic, repetition, refers to the contrast with respect to non-urban destinations in the relatively lower number of repeated visits. Finally, capriciousness is seen in the proneness of cities to changes in fashion, as urban tourism experiences that visiting a given city may become also a fashionable activity, subject to fluctuations in demand.
The literature that is more specific on city break trips characterizes them as a type of urban touristic activity in terms of duration, distance, discretionary nature, date flexibility and destination travel party, as it was defined by Dunne et al. (2010). City break trips are of short duration, involving mostly short haul flights from neighboring countries, or from nearby areas. In addition, they tend to be secondary trips that people often use to supplement a main holiday. Usually, these trips are taken as a consequence of a discretionary and opportunistic decision, where the first order question of taking or not the trip is concurrently linked to second order questions such as the price or the convenience to ‘go for it’, contrary to what is typically the case of conventional holiday trips. There is lack of seasonal bias as with conventional trips. Finally, regarding the profiles of the traveling units (i.e., groups of people), city breaks tend to be taken by a relatively lesser number of traveling units with the company of children.
Notwithstanding these features, obtaining a definite distinction of city break trips from other types of urban trips in an empirical study is far from easy, as there is no clear agreement with respect to the use of easy-to-recognize general and objective classification variables. For instance, there is no consensus in the literature with respect to the number of nights in a destination for a trip to be considered a city break. Whereas Fache (1994) defines it as a trip lasting between one and three nights, Valls, Sureda, and Valls-Tuñon (2014) distinguish between city breaks, short and long holidays, as those lasting 1–2 nights, 3–4 nights or 8 night stays or longer, respectively. Finally, Dunne et al. (2010) include trips of 4–5 nights or longer. As for the reason of visit, there are not particularities in city breaks either. Part of the literature tends to be comprehensive, and includes holiday, cultural, business, health, sports, MICE (meetings, incentives, conferencing and exhibitions) or other as reasons for break-type, short or longer visits (Valls et al., 2014), whereas other studies feature these trips as “national or international leisure breaks” (Dunne et al. 2010), or as non-business trips (Fache, 1994). These procedural problems in terms of recognizing city break travels forced us to adopt a less restrictive view of the duration time, and a greater focus on a list of classification variables used as data-entry control, as we explain in the empirical research.
Finally, referring to the main antecedents of city breaks, there is a gap in the number of studies addressing their effects on satisfaction, repetition or attitude. A notable exception is the work from Ene and Schofield (2011), exploring cognitive, affective and conative dimensions as antecedents of revisit and word-of-mouth. In particular, it was found that emotions and cognitive dimensions combine to exert their influence on consumer decisions, but in the case of the intention to repurchase, only emotions appear to be the sole significant predictor. Our study is set to bring some more light on the comparative effects from these two types of antecedents on satisfaction.
Value and quality as antecedents of satisfaction in city breaksUnderstanding the factors determining the nature and types of consumer value is capital in order to design effective marketing strategies. Yet it seems that previous attempts in the marketing literature made deeply enough as to produce “telling conceptual inroads into the issues of concern” have failed short (Holbrook, 1999, p. 3). In particular, despite the fact of being a critical concept in customer consumption behavior, consumer value has received less attention than service quality or satisfaction (Williams & Soutar, 2009; Woodruff, 1997).
Consumer value is an interactive relativistic preference experience in the sense that the relationship between the consumer and a product or service takes place depending on comparisons that are relevant but varying according to the people and the situation. This relationship operates relativistically to “determine preferences that lie at the heart of the consumption experience” (Holbrook, 1999, p. 9). Consumption experiences produce value only to the extent that they are judged as such by individuals. In this sense, value has been modeled either as a single or as a multiple stimulus concept (Oliver, 1999). For example, in the case of hedonic consumption the concept of value could merge into that of pleasure. In addition, the valuation of pleasure and its counterpart pain could appear as the extremes of a single measure.
A multiple stimulus concept could be modeled as one in which, for example, a customer forms an idea of the value of a product or service after considering the relative weight of its benefits against its costs or sacrifices (Sweeney, Soutar, & Johnson, 1999; Williams & Soutar, 2009; Zeithaml, 1988). In other words, the value of a product may be determined in the form of consumers’ overall assessment of its utility based on perceptions on what is received and what is given (Zeithaml, 1988, p. 14).
Traditionally, the study of quality in services has been based on the Expectancy disconfirmation theory (Oliver, 1981; Parasuraman et al., 1985, 1988; Zeithaml, 1988). In particular, perceived quality (1) is different from objective quality, (2) entails a higher level of abstraction than focus on specific attributes, (3) is a global assessment resembling attitude, and (4) is rather “a judgment usually made within a consumer's evoked set” (Zeithaml, 1988).
In the tourism context, this insight on the consumer's own judgments and attitudes has gone a step further with the differentiation between service quality and experience quality. The former has been referred to as the quality of the attributes of a service which are under the control of the supplier, while the latter adds to these attributes the tourists’ own affective responses (Chen & Chen, 2010).
A particular feature of short touristic travels to cities, compared to other types of vacation, may lie in the absence of a service provider. Consuming experiences can occur with or without an interaction with a service provider or ‘experience enabler’ in a market relation (Baron, Conway, & Warnaby, 2010). In fact, touristic consuming experiences outline a continuum. At one extreme, there are complete products, services and experiences provided by private companies. At the other extreme, a traveler may opt for a trip made from a sum of a limited number of services from independent providers, sometimes at the point of destination, seeking autonomously for his or her traveling experience. This means that the quest of consumption experiences in city break traveling can fit in any point of this continuum, which brings important changes in the way to define quality of travel experience, when there can be no other service provider than the city as a whole.
For this reason, by quality of travel experience, in this study we refer to an overall judgment by a city traveler about the excellence of the ambience, amenities, services and options for leisure and entertainment that are offered in a city. Very particularly in the case of city traveling, a significant proportion of trips tend to be planned as breakaway or flying visits for which the vision of a clear service provider to whom demands on quality or value could be headed is not as certain as with conventional tourist operator services.
Thus, in order to compare the Quality and Service framework with respect to the Experience Economy framework in the context of city breaks, our first hypothesis aims to determine the significance and size of the effect from perceived quality on satisfaction, for its comparison with the effect from the experiential standpoint:H1 The higher the level of quality of travel, the higher the tourist's general satisfaction.
The role of value as a direct antecedent of satisfaction has been repeatedly studied in tourism (Gallarza & Saura, 2006; Williams & Soutar, 2009). Secondly, if consumption experiences produce value only to the extent that these have been judged, and if satisfaction is an outcome of judgment, then it seems plausible to expect an indirect effect from the perceived quality of travel on satisfaction through the mediating role of the value of travel experience. The account of this indirect role completes the direct effect of quality on satisfaction. Thus, our hypothesis is:H2 Value of travel acts mediating with a positive sign the relationship from quality to the city break traveler's general satisfaction.
The above formulated causal relations posing the quality of the city break trip as an antecedent of both value and satisfaction needs to be compared with an account of the travel experience that a customer or, in this case, a traveler seeks. A critic to the expectancy disconfirmation theory, and its tangible form in the SERVQUAL model, has been argued on the fact that it does not adequately address the affective and holistic factors contributing to the overall quality of ‘service experience’ (Otto & Ritchie, 1996). From the practice of marketing management, Pine and Gilmore (1999) argue that there has been a ‘commodity mind-set’ due to which many businesses missed the point on the fact that instead of services, customers want and are willing to pay for experiences, not merely tasks.
This difference in the point of view has been increasingly studied, and measurement scales have been proposed especially in the hospitality and tourism services literature (Andersson & Getz, 2009; Hosany & Witham, 2009; Mehmetoglu & Engen, 2011; Oh, Fiore, & Jeoung, 2007; Quan & Wang, 2004; Stamboulis & Skayannis, 2003; Yuan & Wu, 2008). According to Pine and Gilmore's framework, the four factors that comprise the ‘experience realms’ are: entertainment, educational, escapism and esthetics.
An entertainment type of experience happens when customers passively absorb the consuming experience through their senses, “as generally occurs when viewing a performance, listening to the music or reading for pleasure” (Pine & Gilmore, 1999, p. 31). Secondly, the educational realm involves an active participation of the individual, contrary to the case of entertainment. Through it, the customer “absorbs the events unfolding before him” (p. 32). Thirdly, the escapist experience is one involving “a greater immersion than entertainment and education”, and making the customer become an actor, detached or distracted from his or her own self at least for a time (p. 33). Finally, the esthetic realm refers to experiences in which individuals are immersed and affected by the environment, contemplating and discovering through the senses about the fact of being there in that moment.
Pine and Gilmore (1999) also distinguish these four experience realms according to two coordinates forming a plane (p. 30): passive versus active participation, and absorption versus immersion. In this sense, educational and escapist experiences demand active participation, whereas entertainment and esthetic are of a passive type. Correspondingly, entertainment and educational experiences are more absorptive compared to esthetic and escapist experiences, which entail more immersion.
According to this, and following the ideas set in the same way in previous works (Hosany & Witham, 2009; Mehmetoglu & Engen, 2011; Oh et al., 2007) our following set of hypotheses conform the second framework, of Experience Economy, to be measured:H3 An experience of a higher educational, entertainment, escapist or esthetic intensity brings a higher level of general satisfaction to the city break tourist.
Again, if experiences are to exert an effect on satisfaction, it is plausible to expect that this is at least partly resulting from a process of judgment valuing such experiences in order to feel an effect of satisfaction. Thus, value acts as mediator from experience of consumption on satisfaction, as we pose:H4 Value of travel acts mediating with a positive sign the relationship from the intensity of travel experience to the city break traveler's general satisfaction.
Finally, given the aim of this empirical study with respect to testing the explanatory power of perceived quality, compared to the experiential attributes of the point of destination as such, the following hypotheses we pose deal with the sizes of each the direct and indirect effects from each of these factors on satisfaction. Thus:H5 The direct effect of quality of travel on the city tourist's level of general satisfaction is significantly different from the direct effect of traveling experience as such on general satisfaction. The indirect effect of quality of travel on the city tourist's level of general satisfaction through the value of travel is significantly different from the indirect effect of traveling experience as such on general satisfaction through the value of travel.
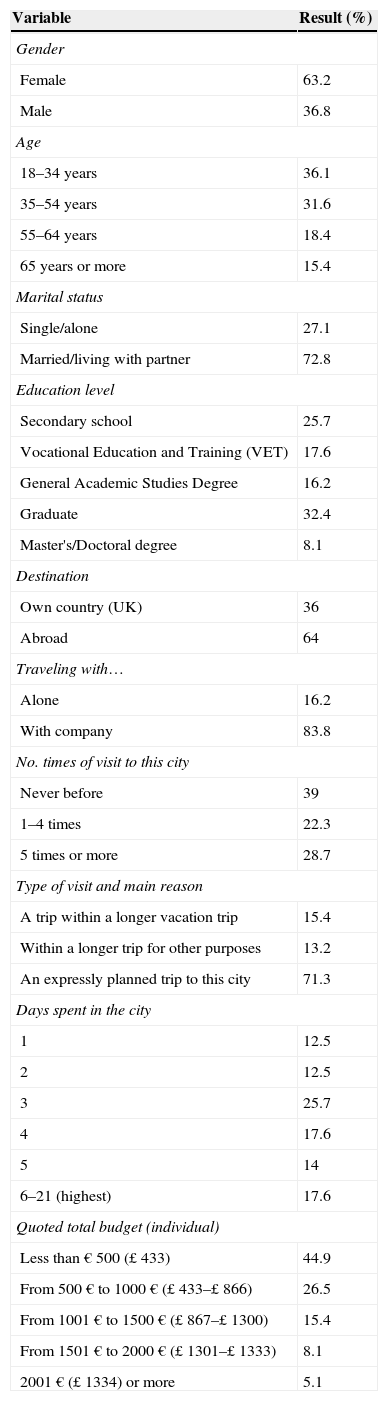
The empirical study is based on an Internet survey on a group of 136 valid interviews to British Internet users during April 2013. Selection criteria was followed by means of two consecutive filter questions, the first of which differentiated whether the respondent traveled for touristic or working reasons to any national or international European destination within the last twelve months. The second filtering question was used to discard those respondents whose traveling consisted on visiting rural or non-urban destinations for more than 50% of the time spent. Thirdly, a one-by-one selection process was applied in order to discard those travelers whose destination was: (1) clearly non-urban, (2) consisted of longer trips of a month or more, or (3) did not refer to any real or specific European city. Table 1 describes the main features of the sample gathered.
Descriptive values obtained from the respondents.
| Variable | Result (%) |
|---|---|
| Gender | |
| Female | 63.2 |
| Male | 36.8 |
| Age | |
| 18–34 years | 36.1 |
| 35–54 years | 31.6 |
| 55–64 years | 18.4 |
| 65 years or more | 15.4 |
| Marital status | |
| Single/alone | 27.1 |
| Married/living with partner | 72.8 |
| Education level | |
| Secondary school | 25.7 |
| Vocational Education and Training (VET) | 17.6 |
| General Academic Studies Degree | 16.2 |
| Graduate | 32.4 |
| Master's/Doctoral degree | 8.1 |
| Destination | |
| Own country (UK) | 36 |
| Abroad | 64 |
| Traveling with… | |
| Alone | 16.2 |
| With company | 83.8 |
| No. times of visit to this city | |
| Never before | 39 |
| 1–4 times | 22.3 |
| 5 times or more | 28.7 |
| Type of visit and main reason | |
| A trip within a longer vacation trip | 15.4 |
| Within a longer trip for other purposes | 13.2 |
| An expressly planned trip to this city | 71.3 |
| Days spent in the city | |
| 1 | 12.5 |
| 2 | 12.5 |
| 3 | 25.7 |
| 4 | 17.6 |
| 5 | 14 |
| 6–21 (highest) | 17.6 |
| Quoted total budget (individual) | |
| Less than € 500 (£ 433) | 44.9 |
| From 500 € to 1000 € (£ 433–£ 866) | 26.5 |
| From 1001 € to 1500 € (£ 867–£ 1300) | 15.4 |
| From 1501 € to 2000 € (£ 1301–£ 1333) | 8.1 |
| 2001 € (£ 1334) or more | 5.1 |
| Contracting form of: | Trip (%) | Accommodation (%) | Meals (%) | Rent-a-car (%) | Sightseeing program (%) |
|---|---|---|---|---|---|
| Did not contract | 16.2 | 24.3 | 27.9 | 89.7 | 44.9 |
| Internet | 60.3 | 56.6 | 12.5 | 5.1 | 16.2 |
| On destination | 8.8 | 5.1 | 53.7 | 3.7 | 32.4 |
| With travel agent | 14.7 | 14 | 5.9 | 1.5 | 6.6 |
Although the constructs for the Education, Entertainment, Escapism and Esthetic experience realms were defined by Pine and Gilmore as central components of their Experience Economy framework (1999, pp. 29–31), they did not propose measurement scales for them. However, other authors from the academic field have developed scales, such as Oh et al. (2007), Hosany and Witham (2009), and Mehmetoglu and Engen (2011). The first work presents a thorough set of scales for the aforementioned factors. However, we choose Mehmetoglu and Engen's (2011) set for brevity reasons in the need to handle an affordable extension in the questionnaire.i For the case of Value of travel experience we drew on Sweeney and Soutar (2001), Petrick (2004), Gallarza and Saura (2006), Williams and Soutar (2009), Cronin et al. (2000) and Forgas-Coll, Palau-Saumel, Sánchez-GarcÍa, and Callarisa-Fiol (2012). In the particular case of Quality of travel experience, we also based generically on these works, although in this case, due to the specificity of city break traveling, consisting of giving an opinion about the own perceived quality as a result to a visit to a city, we had to set an own list of items for it. Lastly, the consequent (resulting) factor of General Satisfaction was based on Petrick (2004).
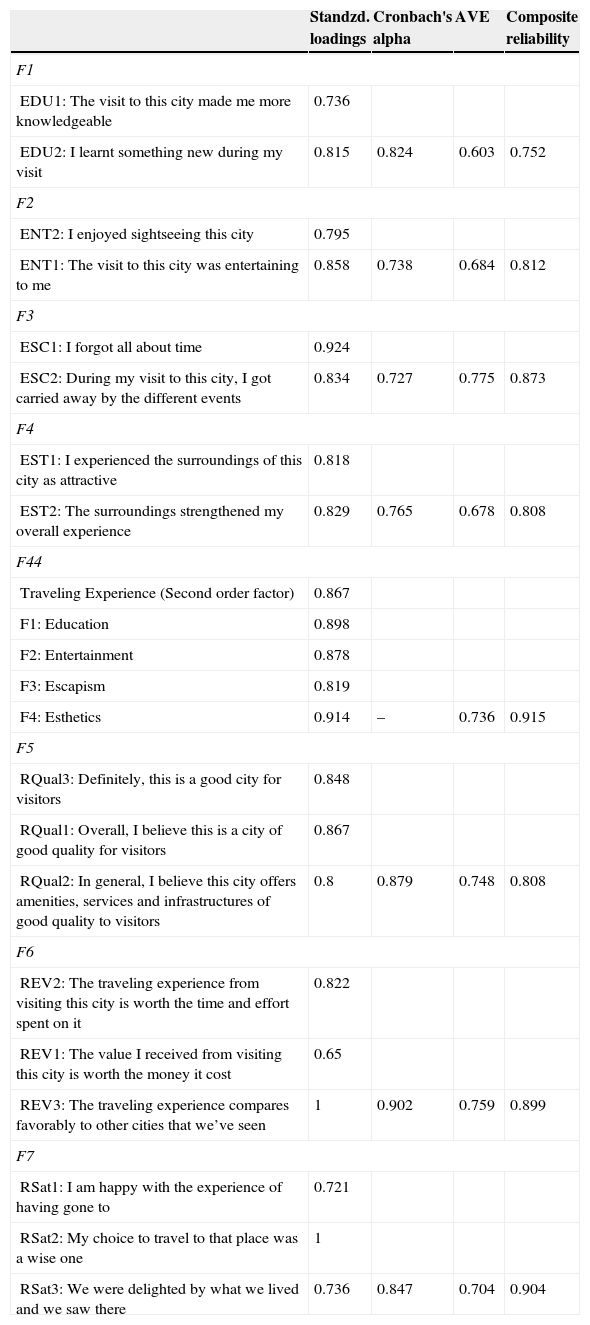
Results of the contrast testsTo analyze the measuring model, we extracted the Cronbach's alpha, average variance extracted (AVE) and construct reliability measures. All these reliability measures give values above the recommended levels of 0.707 for the case of loading factors, above 0.7 (Churchill & Iacobucci, 2005) for Cronbach's alphas, of 0.65 for the case of composite reliability measures, and of more than 0.5 for the case of the average variances extracted (AVE). Therefore, reliability and convergent validity are also ascertained (Fornell & Larcker, 1981). Table 2 shows the final set of items that complied with the reliability, validity and measurement invariance tests.
Standardized loadings and reliability measures for items and factors.
| Standzd. loadings | Cronbach's alpha | AVE | Composite reliability | |
|---|---|---|---|---|
| F1 | ||||
| EDU1: The visit to this city made me more knowledgeable | 0.736 | |||
| EDU2: I learnt something new during my visit | 0.815 | 0.824 | 0.603 | 0.752 |
| F2 | ||||
| ENT2: I enjoyed sightseeing this city | 0.795 | |||
| ENT1: The visit to this city was entertaining to me | 0.858 | 0.738 | 0.684 | 0.812 |
| F3 | ||||
| ESC1: I forgot all about time | 0.924 | |||
| ESC2: During my visit to this city, I got carried away by the different events | 0.834 | 0.727 | 0.775 | 0.873 |
| F4 | ||||
| EST1: I experienced the surroundings of this city as attractive | 0.818 | |||
| EST2: The surroundings strengthened my overall experience | 0.829 | 0.765 | 0.678 | 0.808 |
| F44 | ||||
| Traveling Experience (Second order factor) | 0.867 | |||
| F1: Education | 0.898 | |||
| F2: Entertainment | 0.878 | |||
| F3: Escapism | 0.819 | |||
| F4: Esthetics | 0.914 | – | 0.736 | 0.915 |
| F5 | ||||
| RQual3: Definitely, this is a good city for visitors | 0.848 | |||
| RQual1: Overall, I believe this is a city of good quality for visitors | 0.867 | |||
| RQual2: In general, I believe this city offers amenities, services and infrastructures of good quality to visitors | 0.8 | 0.879 | 0.748 | 0.808 |
| F6 | ||||
| REV2: The traveling experience from visiting this city is worth the time and effort spent on it | 0.822 | |||
| REV1: The value I received from visiting this city is worth the money it cost | 0.65 | |||
| REV3: The traveling experience compares favorably to other cities that we’ve seen | 1 | 0.902 | 0.759 | 0.899 |
| F7 | ||||
| RSat1: I am happy with the experience of having gone to | 0.721 | |||
| RSat2: My choice to travel to that place was a wise one | 1 | |||
| RSat3: We were delighted by what we lived and we saw there | 0.736 | 0.847 | 0.704 | 0.904 |
Results of CFA Model (with F44 as a second order factor): Chi-Square goodness of fit: χ2=246.375 (105 d.f.), p<0.001; Satorra-Bentler Chi-Square robust goodness of fit: χS-B2=139.362(105 d.f.),p=0.014; Bentler-Bonett NFI: 0.846; Bentler-Bonett NNFI: 0.942; CFI: 0.955; Bollen's IFI: 0.957; McDonald's MFI: 0.881; RMSEA: 0.049; 90% CI of RMSEA: (0.023, 0.069).
Despite their apparent success as measurement scales reported by Mehmetoglu and Engen's (2011), we faced problems of discriminant validity, due to the obtained high correlations among the four defined experiential factors (F1–F4 in Table 2). In order to elicit this problem, we opted for the extraction of a second-order factor, defined as Traveling Experience (F44). This new configuration of the model looks plausible as each of the (reflective) factors of first-order to be joined captures the meaning of this common factor.
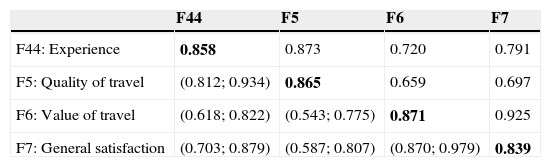
The square roots of the AVEs and the covariances of the resulting group of four factors are shown in the principal diagonal and upper part of Table 3, respectively. Two correlations are higher than their comparative square root AVE value: the correlation between value and satisfaction, and that between the experience and the quality of travel. Therefore, Fornell and Larcker (1981) test of discriminant validity is not totally ascertained. In order to find further evidence of discriminant validity, two less strict tests are shown: Anderson and Gerbing's (1988) test of confidence interval, and test of differences of chi-squared values.
Square roots of the AVEs, and bivariate correlations among factors.
| F44 | F5 | F6 | F7 | |
|---|---|---|---|---|
| F44: Experience | 0.858 | 0.873 | 0.720 | 0.791 |
| F5: Quality of travel | (0.812; 0.934) | 0.865 | 0.659 | 0.697 |
| F6: Value of travel | (0.618; 0.822) | (0.543; 0.775) | 0.871 | 0.925 |
| F7: General satisfaction | (0.703; 0.879) | (0.587; 0.807) | (0.870; 0.979) | 0.839 |
The bold values of the principal diagonal are the square roots of the AVEs, bivariate correlations are in the upper half and correlations in the lower half.
The interval scales determined for the correlations at 5% of significance (lower half values in Table 3) show that there is evidence of it in the fact that values equal to 1 do not seem plausible. Secondly, as for the test of differences of chi-squared values, the difference of the adjusted value between the CFA original model (see results in Table 2), and that of the model from setting the highest bivariate correlation to 1 (χ2=257.442 106 d.f.) gave a significant increase, meaning that discriminant validity is ascertained.
In order to determine the amount of variance that is attributable to the measurement method, there are several valid methods (Malhotra, Kim, & Patil, 2006). We show three alternative measures: firstly, the second smallest bivariate correlation of the manifest variables used for the analysis, as a conservative proxy measure (Lindell & Whitney, 2001), which gives a value of 0.294; secondly, the variance of the single obtained latent factor in a common factor analysis (CFA), equal to 0.243 and thirdly, the covariance between a common factor formed from all the used items and a (second) factor formed with two outer items seemingly unrelated to those used in the model (Malhotra et al., 2006).iii This covariance gave a result equal to 0.309. In all these cases, the results were less than 0.5.
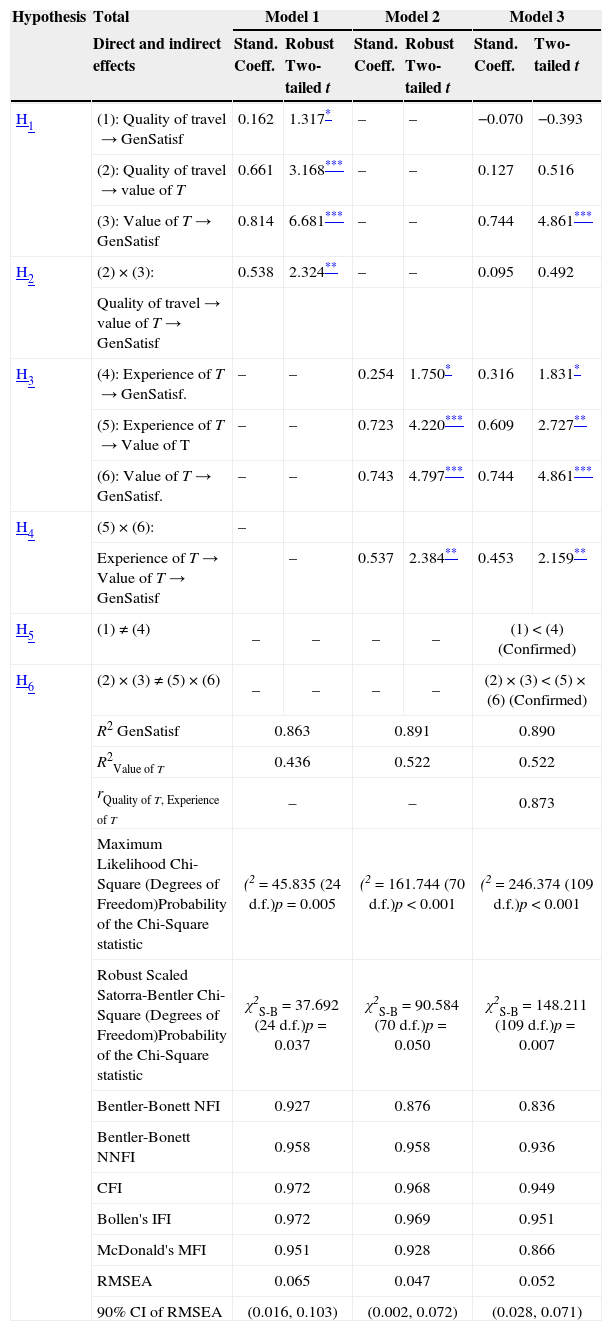
The regression analyses were performed by means of Structural Equation Modeling. Three alternative models are tested, all including the resulting constructs of general satisfaction related in the same way (Table 4). Model 1 considers the alternative of quality of travel experience as antecedent. Model 2 comprises the defined second-level factor of Experience economy. Model 3 includes both sets of direct and indirect effects from models 1 and 2. In all these models, the value of travel experience acts as mediator of the causal relation from any of the two former on satisfaction.
Regression coefficients, t values, and model summary information.
| Hypothesis | Total | Model 1 | Model 2 | Model 3 | |||
|---|---|---|---|---|---|---|---|
| Direct and indirect effects | Stand. Coeff. | Robust Two-tailed t | Stand. Coeff. | Robust Two-tailed t | Stand. Coeff. | Two-tailed t | |
| H1 | (1): Quality of travel→GenSatisf | 0.162 | 1.317* | – | – | −0.070 | −0.393 |
| (2): Quality of travel→value of T | 0.661 | 3.168*** | – | – | 0.127 | 0.516 | |
| (3): Value of T→GenSatisf | 0.814 | 6.681*** | – | – | 0.744 | 4.861*** | |
| H2 | (2)×(3): | 0.538 | 2.324** | – | – | 0.095 | 0.492 |
| Quality of travel→value of T→GenSatisf | |||||||
| H3 | (4): Experience of T→GenSatisf. | – | – | 0.254 | 1.750* | 0.316 | 1.831* |
| (5): Experience of T→Value of T | – | – | 0.723 | 4.220*** | 0.609 | 2.727** | |
| (6): Value of T→GenSatisf. | – | – | 0.743 | 4.797*** | 0.744 | 4.861*** | |
| H4 | (5)×(6): | – | |||||
| Experience of T→Value of T→GenSatisf | – | 0.537 | 2.384** | 0.453 | 2.159** | ||
| H5 | (1)≠(4) | – | – | – | – | (1)<(4) (Confirmed) | |
| H6 | (2)×(3)≠(5)×(6) | – | – | – | – | (2)×(3)<(5)×(6) (Confirmed) | |
| R2 GenSatisf | 0.863 | 0.891 | 0.890 | ||||
| R2Value of T | 0.436 | 0.522 | 0.522 | ||||
| rQuality of T, Experience of T | – | – | 0.873 | ||||
| Maximum Likelihood Chi-Square (Degrees of Freedom)Probability of the Chi-Square statistic | (2=45.835 (24 d.f.)p=0.005 | (2=161.744 (70 d.f.)p<0.001 | (2=246.374 (109 d.f.)p<0.001 | ||||
| Robust Scaled Satorra-Bentler Chi-Square (Degrees of Freedom)Probability of the Chi-Square statistic | χ2S-B=37.692 (24 d.f.)p=0.037 | χ2S-B=90.584 (70 d.f.)p=0.050 | χ2S-B=148.211 (109 d.f.)p=0.007 | ||||
| Bentler-Bonett NFI | 0.927 | 0.876 | 0.836 | ||||
| Bentler-Bonett NNFI | 0.958 | 0.958 | 0.936 | ||||
| CFI | 0.972 | 0.968 | 0.949 | ||||
| Bollen's IFI | 0.972 | 0.969 | 0.951 | ||||
| McDonald's MFI | 0.951 | 0.928 | 0.866 | ||||
| RMSEA | 0.065 | 0.047 | 0.052 | ||||
| 90% CI of RMSEA | (0.016, 0.103) | (0.002, 0.072) | (0.028, 0.071) | ||||
As for the general fit of these models, only robust fit measures were considered, as scarcely can the use of multinomial interval scales be assumed to be normally distributed.iiiiii General and incremental fit measures are of discrete to good levels for the three models. Regarding the coefficients of determination (R2) obtained for value and quality in the three models, there is only an appreciable increase from model 1 to model 2, meaning that the used scale of measurement of experience adds some explanatory power (R2) of the regression functions of this odel to general satisfaction, and value, equal to 0.027 (from 0.863 to 0.891) and 0.088 (from 0.436 to 0.522), respectively. Contrarily, despite comprising all the factors used in models 1 and 2, model 3 does not add more explanatory power in terms of increase of the coefficients of determination. This is a clear sign of some degree of multicollinearity between factors quality and experience.
In the case of Model 1, results confirm, albeit with a weak level of significance, the direct effect posed in hypotheses H1, namely, that quality of travel produces a positive effect on general satisfaction. Also, the mediating effect of the value of travel in the relation between the former two constructs, posed by H2, is confirmed. In other words, a higher level of perceived quality of the touristic visit produces an increase on general satisfaction through the intermediate positive effect on the perceived value of travel. Noticeably, the regression coefficients of value on quality and of factor general satisfaction on value (numbered (2) and (3) respectively) are significantly high or very high.
With respect to the second model, coefficient results from the analysis are also significant for the effect of the experience of travel on general satisfaction. Also, the regression coefficients of value as a function of experience, and general satisfaction as a function of value are very significantly positive. Thus, hypothesis H3 is also confirmed. Lastly, the indirect effect of experience on general satisfaction through value of travel is also positive and significantly different from zero. Therefore, hypothesis H4 is confirmed.
Contrary to the case of hypotheses H1 and H2, hypotheses H3 and H4 are also confirmed in Model 3. This may be interpreted as a more robust evidence of the influence of the experience of traveling in its effect on the resulting values.
Also, by means of Model 3, hypotheses H5 and H6 can be tested. As for the case of comparing the size of the direct relations posed in Models 1 and 2 respectively, the results in Model 3 show that the direct effect of quality on general satisfaction is significantly smaller, and in fact, statistically not different from zero, compared to the direct effect of travel experience on general satisfaction, which is positive and statistically significant. This confirms Hypothesis H5 in a positive sense in favor of travel experience.
Finally, with respect to the indirect effects of quality, and experience on general satisfaction through the mediation of value of travel, again, whereas the former indirect relation is not significantly different from zero, the latter gave a product of coefficients which significantly positive. Thus, hypothesis H6 is confirmed, in favor of the mediating role of value of traveling experience.
ConclusionsOver the last 30 years the study of the determinants of satisfaction in touristic services has experienced significant progress. The efforts made in the measurement of perceived quality and value, and their relations with satisfaction and behavioral intentions in services have given light to the understanding of customers’ interpretations about their consumption process. It has been known and repeatedly evidenced that consumers organize information at increasing levels of abstraction, ranging from a product's physical attributes, through its functional and practical benefits, up to reaching its emotional payoffs (Young & Feigin, 1975). In this line, progress in measurement scales during these years has gradually given way to the inclusion of “the salient intrinsic attributes, extrinsic attributes, perceived quality, and other relevant high level abstractions”, as it was proposed by Zeithaml (1988, p. 14).
As the evolving process of competition is leading competitors to make efforts toward placing more of the augmented product and service features into the expected part of their offer, it is growing apparent that differentiation among them will be determined by the establishment of consumption experiences. Competition among cities for visitors among touristic city destinations is not immune to this reality (Chen & Hsieh, 2010; Pine & Gilmore, 1999, 2014). In this sense, the study of experiences, and their links to consumption value and satisfaction has evolved to conceptually rich and new points of view stressing more on the experiential aspect of consumption. Recent studies have explored the concept of emotions within the realm of vacation experiences (e.g. Lin, Kerstetter, Nawijn & Mitas, 2014; Mitas et al., 2012; Nawijn et al., 2013). In comparison to the past tendency from the services literature to stress on the measurement of perceived quality as an antecedent of value and satisfaction, the inclusion of consumption experiences in tourism seems to be more akin to this new trend.
Our study shows that the significance of the direct effects of quality, either on value or on satisfaction, ceases when the experience effect is included. On the contrary, the direct and indirect effects of experience remain significant with or without the inclusion of the quality factor. Although quality achieves a high explanatory power on both value and satisfaction, the experience of traveling reaches even higher levels. As a measurable construct, this factor also has the advantage of more coherence with real situations where there is not a recognizable single selling part with an incentive to determine the travelers’ opinions toward the quality of its offer, such as is the here studied case of breakaway visits to cities.
Implications for managementSimilarly as incumbent firms within an industry compete for gaining and retaining customers, cities also compete and seek high results from visitors in terms of value, satisfaction and behavioral intention. Tourism management in a city comprehends a high diversity of public entities and private agents, whose coordination results vital for achieving success. In the case of the hospitality and tourist industry as a whole, many European cities are and will remain dependent to a large extent on public initiative, manifested by a network of general public services. This political and economic infrastructure which has “a coordinated and decisive influence over the (private) organization” (Marino, 2010) will be necessary to maintain, despite the context of economic crisis that we are currently facing. Public entities need to use imaginative, reliable and valid measures of the antecedents of value, satisfaction and behavioral intentions. Despite its proven validity in the context of services, the scales of quality assessment do not seem to be very appropriate to grasp an aggregate measure of the quality impressions resulting from the diversity of agents a city tourist may have encountered during his/her trip. Rather, the adoption of a general measure of the traveling experience from the city seems more plausible, an aspect which is much more of the competence of city tourism developers. This idea seems to follow from the increase of the explanatory power both of quality and value, attributable to the experience of traveling.
More attention to the measurement of experiences should be given in future research on city tourism. Special efforts should be aimed to recognizing differences in the types of experiences visitors seek, how these may lead to differences in the positioning of cities and their differences in terms of their focus on segments of city tourists.
Limitations and implications for future researchAlthough the empirical study achieves to show the relevance an adequateness of using the experiential factor as a significant antecedent on city travelers’ value and satisfaction, there are some conceptual and methodological limitations that deserve some consideration. Firstly, we must admit that the reality of a differentiation of the components originally put forward by Payne and Gilmore (1999, 2014) was not confirmed in our study. Despite its seemingly completeness and elegance, the observed lack of discriminant validity among the factors of education, esthetics, escapism and entertainment compel us to question the reality of these constituents. An account of the different modalities of traveling experience would be enriching for the body of knowledge on city touristic trips.
Secondly, the high covariance levels obtained in some pairs of factors certainly add difficulties to their discriminant validity and the determination of the sizes of their individual effects. This is particularly true for the cases of quality with experience and value with satisfaction. For the first case of correlation the step inclusion process of factors among the three defined models helps to determine the increasing effect of each antecedent factor (Cohen et al., 2003). For the case of the second mentioned correlation, the distinction of direct and indirect effects among value and quality helps to understand the influence of the former factor over the latter. Nevertheless, a deeper question holds with respect to the use of different traits and measurement methods, as a means for controlling common method variance and obtaining more valid measures.
Finally, despite its importance in terms of expenditure, number of visits and hotel and hostel occupation figures, city break traveling is yet to receive the academic interest it deserves. We must admit that there is still more work to do in future analyses delving into the primary antecedents of satisfaction and behavioral intentions, especially in the case of adding attributes defined from the prism of travelers’ experiences, for which the literature is still scarce. Also, it is convenient to conduct additional tests to the combined relations among factors from these two frameworks, in order to understand more deeply what determines satisfaction and behavioral intentions, such as repetition and good-referencing, in city traveling.
Conflict of interestsThe authors declare no conflict of interest.
We also defined and included scales for measuring the antecedents of quality and value of travel experience, that were currently set in the literature. However, they are not relevant for the specific purposes of our study here.
In particular, the two outer items used to form this second factor were measured in 7-point interval scales, as follows: (1) “The cost of the trip from your city of origin to this European city was, in your opinion, …”, from “extremely cheap” to “extremely expensive”, and (2) “With respect to comfort during your trip, bearing in mind the time spent waiting, moving, transferring, etc., in general would you say that your journey was…”, from “extremely uncomfortable” to “extremely comfortable”.
Nevertheless, Maximum Likelihood Chi-Square values with degrees of freedom and probabilities are also shown.

www.publicationethics.org.