In spite of the fact that there is empirical evidence that debt tax benefits add to firm value, additional research is needed to explain the apparently conservative debt policy of many firms. This study examines whether the costs of debt and non-debt tax related issues might shed some light on the apparent “conservative leverage puzzle” for Spanish listed firms throughout the period 2007–2013. Specifically, we compare the costs of financial distress with the potential tax benefits of debt. In addition, we test whether debt conservativeness, measured by the kink, is explained by different costs of debt and non-debt tax shields. Our findings suggest that the most conservative Spanish listed firms may not be acting sub-optimally with respect to the tax advantage of debt financing. Furthermore, the results obtained are consistent with the belief that debt costs might offset the tax benefits stemming from debt financing, and debt and non-debt tax shields could act as substitutes.
A pesar de que existe evidencia empírica de que las ventajas fiscales de la deuda se suman al valour de la empresa, es necesaria más investigación para explicar la política de deuda aparentemente conservadora de muchas empresas. Este estudio analiza si las cuestiones fiscales de la deuda y aquellas no relacionadas con la deuda podrían arrojar algo de luz sobre el aparente «rompecabezas de fuerza conservadora» de las empresas cotizadas españolas durante el período 2007-2013. Específicamente se comparan los costes de dificultades financieras con las ventajas fiscales de la deuda. Además, probamos si el conservadurismo de la deuda, medido por el colapso, se explica por los diferentes costes de los escudos fiscales relacionados con la deuda o alternativos a esta. Nuestros resultados sugieren que las empresas cotizadas españolas más conservadoras quizá no estén actuando de manera subóptima respecto a la ventaja fiscal de la financiación de la deuda. Además, los resultados obtenidos son coherentes con la creencia de que los costes de la deuda podrían contrarrestar las ventajas fiscales derivadas de la financiación de la deuda, y los escudos fiscales relacionados con la deuda y alternativos a la deuda podrían actuar como sustitutos.
A great deal of academic research has studied corporate financial decisions and, specifically, the determinants of capital structure. Although there has been much progress and insight, questions remain as to why some companies do not appear to use as much debt financing, as the benefits from doing so would suggest, or which specific factors determine that apparently conservativeness behaviour.
A number of different theories and empirical strategies have sought an explanation as to why some companies do not take on more debt and as such fail to make the most of the tax benefits of debt. Among others, the trade-off, pecking order and financial growth lifecycle theories attempt to explain the observed level of debt, but they do not fully explain the abovementioned conservatism. Estimating and contrasting the costs of debt and tax savings from debt, as well as comparing debt conservatism to both different cost variables and non-debt tax shields are some of the approaches that have been used to dig into that question.
Regarding the effect of the costs of debt, the choice between debt and equity financing has been characterized in a context in which firms choose their optimal debt levels by balancing the pros and cons of attaining it (Frank & Goyal, 2008, chap. 12). Prominent among the benefits of using debt financing are the tax savings that are generated due to the interest deductibility. Despite the fact that there is evidence suggesting for the relevance of debt tax benefits in corporate capital structures, there are stylized proofs that support the notion that highly profitable, low-default probability, and high marginal tax rate firms are no more likely to use debt than other types of firms (see Graham, 2013, chap. 3 for a detailed review of the literature). The counterweight to debt benefits generally comes from financial distress costs (Bradley, Jarrell, & Kim, 1984), the cost of personal taxes (Miller, 1977), non-debt tax shields (De Angelo & Masulis, 1980), and agency costs due to conflicts between managers and investors or among different groups of investors (Jensen & Meckling, 1976; Myers, 1977).
A drawback encountered when regressing leverage ratios on a set of factors such as firms’ size, profitability, asset tangibility, business risk, etc. (Flannery & Rangan, 2006; Frank & Goyal, 2009) is a possible failure to detect whether firms have too much or too little debt on average (Korteweg, 2010). Recently, several papers have tried to overcome the abovementioned shortcoming calculating ex-ante financial distress costs and comparing them with the tax benefits of debt (Almeida & Philippon, 2007; Blouin, Core, & Guay, 2010; Ko & Yoon, 2011; Molina, 2005), computing net benefits to leverage from market values and betas of corporate debt and equity (Korteweg, 2010), or estimating the marginal cost curve for corporate debt and determining its intersection with the tax benefit curve (Graham, Hanlon, Shevlin, & Shroff, 2017; Binsbergen, Graham, & Yang, 2010), among others. What most of the previous empirical studies have in common is the fact that they are mainly focused on public firms. Moreover, they share similar objectives: following Graham's (2000) approach in considering the tax benefits function, they estimate both the costs and benefits of debt in order to explain whether the financial distress costs offset the tax savings of debt. They thus try to explain why some companies appear to have less debt than expected and as such fail to fully take advantage of the tax benefits of debt.
Apart from the effect of the costs of debt, explanations of debt conservatism have also focused on the influence of non-debt tax shields as substitutes for the fiscal benefits of debt. The existence of fiscal advantages from sources other than debt might reduce the tax incentive to use debt.1 On the other hand, Blouin et al. (2010) find evidence suggesting that under-levered firms have difficult-to-measure non-debt tax shields that are not captured in researchers’ estimates of taxable income, opening up a debate about how to measure the effect of substitutes for fiscal interest deductions.
As seen from the above discussion, it is widely accepted in corporate finance literature that some firms are less leveraged than they should be, in view of the tax benefits of debt. It is also assumed, in order to explain this discrepancy, that it is necessary to calculate the costs of debt and account for the effect of the costs of debt together with non-debt tax shields. In this paper we want to shed light on this apparently puzzling evidence, using three different approaches and focusing on the Spanish context. Firstly, we intend to re-examine the under-leverage result obtained by Graham (2000) in light of debt costs. Specifically, we estimate the ex-ante financial distress costs of incremental debt following the mapping procedure by Molina (2005), and set them against the potential tax benefits of additional leverage in order to check whether these costs might compensate for the potential fiscal benefit of debt. Secondly, we use Graham's (2000) kink variable to measure the degree of leverage conservativeness and compare it to different firms’ characteristics that proxy for costs of debt financing to test whether these specific costs may affect the financial conservatism of our sample. The kink is the point in the tax benefit function where marginal benefits of debt start to decline and as a result the shape of the function starts to slope downward. According to Blouin et al. (2010), the kink represents the amount of interest expenses a firm might decide on and while still obtaining the maximum marginal tax abatement, and before it causes a decrease in the marginal tax benefits. Finally, we aim to investigate whether non-debt tax shields substitute for interest deductions, and add any explanation to the “conservative leverage puzzle”. To that end, we add different tax and non-debt tax shield variables to the firms’ characteristics when testing their relationship to the kink. In this paper, we use a novel measure for these tax shields called tax spread, which is the difference between book tax expense and taxes actually paid.
With this paper, we contribute to the academic debate related to the determination of corporate capital structure, further developing the contributions of previous empirical literature in several ways. In the first place, we provide additional empirical evidence on the relevance of financial distress costs and non-debt tax shields in explaining observed debt policy conservatism. To do so, we apply three different strategies. Firstly, we contrast total distress costs with debt tax benefits. Secondly, we compare leverage conservativeness to the costs of debt and, thirdly, these costs in aggregated form to non-debt tax variables. Furthermore, we use a relatively new measure for non-debt tax shields that takes into account a wide range of tax shelters. In the second place, our findings shed some light on this issue in the European Union, and specifically in Spain, since, to the best of our knowledge, only one empirical study to date has been carried out on this issue following the abovementioned empirical strategy (Sánchez-Vidal & Martín-Ugedo, 2006). However, there have been no studies estimating the net benefits of debt exclusively for listed companies.
As there is lack of empirical evidence on the apparent debt conservatism in some companies when estimating and comparing the costs and benefits of debt in the European context, our evidence on Spain is particularly notable and thought-provoking. Spain, as member of the European Union, is currently undergoing a process of economic coordination which translates into fiscal harmonization (Ruiz-Huerta, 2011) and regulatory convergence of financial markets. Furthering this alignment, Law 16/2007 aimed to reform and adapt the commercial laws on accounting principles, in order to harmonize them with international law and European Union regulations. Thus, the findings for our Spanish sample might be extrapolate to the European level.
Our results indicate that the most conservative Spanish listed companies might not be acting sub-optimally despite their apparently low indebtedness. When financial costs of debt are taken into account, a large portion of the potential debt tax savings are offset. For example, the implied gain in tax benefits as a company increases its leverage from BB to B rating levels amounts to 0.86%, while the distress costs increase associated with that ratings change falls between 1.25% and 2.02%. Furthermore, firms use debt conservatively when they face net operating loss carryforwards, high growth opportunities, a high percentage of current assets and a high portion of tangible assets. The conservative approach to debt policy is reinforced by the availability of non-debt tax shields. For instance, through permanent deferrals, accounting discretion, and non-observable tax shelters, firms that appear under-levered may be simply overstating book income relative to taxable income.
The remainder of the paper is organized as follows. In the next section, we discuss the theoretical and empirical background, while third section explains the empirical research strategy. Fourth section presents the data for the study and the descriptive analysis regarding the key variables. The empirical results are discussed in fifth section, and the final section provides the conclusions of the research.
Capital structure theories and empirical evidenceCapital structure theoriesThere are a number of different theories that seek to explain the debt-equity decision. However, as stated above, none of them are able to fully explain the apparent under-use of the benefits of debt.
The trade-off theory of capital structure states that firms should pursue a given debt policy until the marginal benefit of doing so equals its marginal cost. The main advantage of debt financing is the tax deductibility of the interest payments. Conversely, of the factors that reduce the tax benefit of debt, bankruptcy costs and financial distress are of particular note. The debt tax benefit coupled with the costs of default creates an optimal leverage ratio where the value of the firm is maximized. This traditional view of corporate capital structure has contributed to the explanation of much of the observed capital structures, by identifying the relationships between leverage and firm characteristics (De Miguel & Pindado, 2001; González & González, 2008). Nevertheless, there are corporate financing patterns that seem to contradict the trade-off predictions, such as that many firms have very low leverage despite facing large tax burdens and apparently low distress risk.
On the other hand, the pecking order theory also tries to explain firms’ capital structure (Myers, 1984; Myers & Majluf, 1984). According to this approach, firms follow a financial hierarchy when funding their investments. Fundamentally, this theory suggests that firms prefer internal sources of financing to external ones. In the event that they resort to external funds, they would choose debt over equity. Furthermore, firms do not pursue an optimal capital structure due to information asymmetry; that is, internal managers have more information than outside lenders about the firm's expectations and are therefore less prone to issue equity when they perceive the firm is undervalued. Titman and Wessels (1988), Rajan and Zingales (1995), Shyam-Sunder and Myers (1999), and Frank and Goyal (2003), inter alia, demonstrated that companies with enough internal resources (retained earnings, depreciations and amortizations) to support their growth, tend to show low levels of debt.
Another line of research that attempts to shed light on firms’ capital structure is the financial growth cycle. Berger and Udell (1998) stated that firms’ equity-debt choice varies over the course of their lifecycle and is motivated by the existence of information asymmetries. These asymmetries are associated with agency costs, and thus affect firms’ external debt choice. Based on that lifecycle, firm age and size influence the existence of information asymmetry problems (Sánchez-Vidal & Martín-Ugedo, 2012).
Empirical evidenceCosts of debtIn this context, the “conservative (or low) leverage puzzle” refers to the stylized fact that on average firms have low leverage ratios relative to what would be expected from capital structure theory.2 For example, Graham (2000, 2001) finds that firms are substantially under-levered from the viewpoint of debt tax benefits, and firms that follow a conservative debt policy are more likely to be stable and profitable. Additionally, Miller (1977) states that due to the relatively low probability of financial distress manifestation, the ex-ante costs of debt appear to be small. Contrary to the previous research, Molina (2005) and Almeida and Philippon (2007) argue that, because Graham's (2000) estimates of distress costs are too small, he overestimates the extent to which firms are underleveraged. Specifically, Molina (2005) offers an estimation for the ex-ante costs of financial distress that can offset the debt tax benefits estimated by Graham (2000). He estimates the effect of an increase in a firm's leverage on the default probability represented by the firm's rating. Estimates of ex-post financial distress costs, obtained by previous empirical research, are then multiplied by firm's default probabilities, resulting in ex-ante costs of financial distress. In the same vein, Almeida and Philippon (2007) calculate the ex-ante distress costs using risk-neutral probabilities of default in a multiperiod setting, and find that the average firm chooses a debt-equity mix that balances the costs of debt with the tax benefits from Graham (2000). Almeida and Philippon (2007) provide an estimate of the cost of default that is about 4% of firm value for investment grade firms and about 9% for speculative debt.
Blouin et al. (2010) revise the underleverage puzzle from the debt usage benefit side and state that the expected tax benefits accruing from an increase in leverage to its optimum are roughly 36–54% of Graham (2000) estimates. Nevertheless, subsequent empirical evidence has proved non-significant differences between Graham's (2000) and Blouin et al.’s (2010) estimates (see, for instance, Graham et al., 2017; Ko & Yoon, 2011; Van Binsbergen, Graham, & Yang, 2010).
Korteweg (2010) and Van Binsbergen et al. (2010) compare debt tax benefits with costs of debt, and estimate the net benefits to leverage. Despite using very different empirical approaches, they attain very similar results. In particular, the former finds that the median net benefits to debt amounts about 4% of total firm value, while the latter reach a slightly lower figure of around 3.5% of asset value. Korteweg (2010) calculates the costs of financial distress at 15–30% of firm value for firms in or near bankruptcy. On the other hand, according to Van Binsbergen et al. (2010) default costs amount to approximately half of the total costs of debt, leaving the other half to be explained by other factors.
More recently, Bigelli, Martín-Ugedo, and Sánchez-Vidal (2014) have analyzed different determinants of financial conservatism in light of the main theories of capital structure policy. They found that financially conservative companies are smaller, use more intangible assets and face low effective tax rates.
Accordingly, we estimate the ex-ante cost of financial distress to be compared to the tax benefits of debt, in order to obtain the net tax benefits of debt. We attempt to explain whether or not the companies of our sample appear to be conservative in their use of debt, in terms of not fully exploiting the fiscal benefits of interest deductions.
In addition, we relate the kink—as a variable representing firms’ debt conservatism—to cost variables to check the extent to which they can explain firms’ debt conservatism.
Non-debt tax shieldsAn alternative explanation of the underleverage puzzle could be that debt is squeezed out by different substitutes or non-debt tax shields. For instance, Graham (2013, chap. 3) suggests analysing the apparently conservative debt policy taking into account whether non-debt tax shields substitute for interest deductions. Examples of such non-debt tax shields include depreciation, investment tax credits, or loss carryforwards. Companies have significant incentives to permanently defer or avoid taxes, usually without transparency, and they may prefer alternative tax shields to debt for different reasons. Following Kolay, Schallheim and Wells (2013), firstly, they are less costly. In this regard, while debt requires costly interest payments, numerous non-debt tax shields do not require any additional outlays for the firm. Secondly, they do not restrict the firm through debt covenants, which are likely to generate high transaction costs. Thirdly, non-debt tax shields frequently exploit provisions in the accounting rules that allow the firm to reduce taxes without affecting the income statement, thus favouring accounting earnings management.3 Finally, some alternative debt tax shields have a relatively larger return per euro invested, especially with the proliferation of thin capitalization rules.4
De Angelo and Masulis (1980) was one of the first papers to point to the relevance of non-debt tax substitutes within corporate capital structures. Surprisingly, Bradley et al. (1984) found that debt is positively related to non-debt tax shields proxied by depreciation and investment tax credits, in contrast to the prediction of De Angelo and Masulis (1980). Furthermore, Titman and Wessels (1988) findings do not provide support for an effect on leverage ratios arising from non-debt tax shields. In the view of Graham (2013, chap. 3), a positive relation between debt and non-debt tax shields (as measured by depreciation and investment tax credits) may appear if a firm invests heavily and borrows to invest. In the same vein, Minton and Wruck (2001) stated that non-debt tax shields might have a positive relationship with debt conservatism as the latter is related to companies that invest more. As Kolay et al. (2013) point out, a mechanical positive relation of this kind overwhelms and makes unobservable any substitution effect between debt and non-debt tax shields.
As part of our aim of explaining the relationship between non-debt tax shields and the apparently underleveraged status of some companies, we address the difficulty highlighted by Blouin et al. (2010) when measuring non-debt tax shields. To that end, we attempt to gather what Graham and Tucker (2006) called “off balance sheet tax deductions” when they found evidence that firms which have non-visible non-debt tax shields in the form of tax shelters are significantly less indebted. Similarly, Graham, Lang and Shackelford (2004) examined one particular non-debt tax shield, namely the exercise of executive/employee stock options, and found these tax shelters can explain some, but not all, of the debt conservativeness. Likewise, Shivdasani and Stefanescu (2010) found that pension assets and liabilities also act as tax shields, with pension contributions equivalent to about a third of those from interest payments.
Going further in our analysis of the kink, in addition to the cost variables we used previously, we add fiscal variables related to both the tax benefits of debt and non-debt tax shields. Moreover, in order to address the possible difficulty mentioned above, we use a novel variable in an attempt to capture the non-observables tax shields.
Empirical strategyIn order to estimate the effect of the costs of debt on the conservative financial policy status, we follow two different empirical strategies. Firstly, we focus on financial distress costs in order to determine whether these costs could offset the potential debt tax savings. We estimate the financial distress costs of incremental debt by concentrating on default probabilities, applying the approach of Molina (2005). Subsequently, and as a second empirical strategy, we regress debt conservatism, as measured by Graham's (2000) kink variable, on several explanatory variables that take into account different costs of debt. Conversely, and as far as the effect of non-debt tax shields is concerned, we test whether there is any relationship between them and the kink variable.
In the next subsections, we detail all the procedures, models and variables used for the empirical analysis.
Costs of financial distressCredit ratings and leverage has been proven to be strongly related, and this is likely to work as a two-way relationship (Kisgen, 2006, 2009). Firms’ leverage obviously influences probability of defaults and hence ratings, but at the same time ratings impact on capital structure decisions. Therefore, in order to circumvent the potential endogeneity problem, we carry out a two-stage instrumental variables process by following Smith and Blundell (1986) and Wooldridge (2010). The idea is to first estimate firms’ leverage with GMM (Generalized Method of Moments) using the lagged values of the explanatory variables as instruments, and in a second stage, to estimate firms’ credit ratings via an ordered probit panel data model.
In this regard, we formulate the two following regression models:
where RAT denotes the company's rating with the highest score of 8 assigned to the AA rating, and the lowest, 1, to the C rating; LEV is the book total debt to total assets ratio5; PROF is the return on assets ratio; SIZE is measured as the natural logarithm of total assets; UBETA is the unlevered beta; TANG is the percentage of tangible assets over total assets; and MTR is the marginal tax rate estimated with earnings before interest and taxes as per Graham, Lemmon, and Shallheim (1998). Table A1 in Appendix provides a summary of the definitions of all the variables.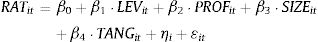

We have used all available companies’ ratings from Standard and Poor's, and for the non-rated cases, we have computed ratings using Standard & Poor's criteria (Standard & Poor's Rating Services, 2011, 2014). For the latter, we have specifically computed several key ratios such as EBIT interest coverage, EBITDA interest coverage, operating cash flows/total debt, total debt/EBITDA, and have assigned them their corresponding rating according to the annual median values of the abovementioned ratios provided by Standard and Poor's. Notwithstanding the foregoing, we have also reformulated Eq. (1) with other alternative dependent variables that can be considered proxies of firms’ default risk, and thus serve as robustness tests to firms’ ratings (Kaplan & Urwitz, 1979). In particular, and based on Standard & Poor's reports (Standard & Poor's Rating Services, 2011, 2014), we have used the following alternative dependent variables: EBITDA interest coverage, total debt divided by EBITDA, and the inverse of Altman (1968)Z-score.6
Financial distress has both direct and indirect costs; whether such costs are sufficiently relevant to capital structure decisions has been widely debated (Altman & Hotchkiss, 2006; Altman, 1984; Opler & Titman, 1994; Warner, 1977). For a small sample of highly leveraged firms, Andrade and Kaplan (1998) estimate losses in value caused by financial distress in the order of 10–23% of pre-distress firm value. Based on the abovementioned study and others, Branch (2002) suggests that the total bankruptcy-related costs to firm and claimholders ranges between 13% and 21%. We measure the expected costs of increased leverage following the mapping between company leverage and expected distress costs developed by Molina (2005). This mapping is carried out, firstly, by associating leverage ratios to credit ratings, and secondly, by joining credit ratings with expected distress costs. As a result, we multiply the total ex-post distress costs obtained in the empirical literature (in this case, Branch's (2002) estimates) by the conditional probability of distress to compute the expected or ex-ante distress costs. Last, these expected distress costs are set against the expected debt tax gains.
Kink and costs of debtBased on Graham (2000), firms’ debt policy can be classified as either aggressive or conservative depending on the extent to which debt is used to minimize tax payments. Underleveraged (or conservative) firms forgo significant tax savings that would have been available if they had increased their debt levels to their kink. The kink can be measured as a ratio where the numerator is the maximum interest that can be deducted for tax purposes before expected marginal tax benefits of debt begin to decline,7 and the denominator is actual interest incurred. In short, it is the point at which the tax benefit curve starts to slope downwards as the firm uses more debt. For example, a firm with a kink of 2.0 is expected to be able to double its current interest expense and continue to benefit from interest tax shields at the firm's marginal tax rate. Accordingly, we could use the kink as a measure of aggressiveness or conservativeness of the firm's debt policy. The larger the kink, the greater the proportion by which interest tax deductions can increase without losing incremental value, and consequently the more conservative the debt policy. In conclusion, the kink and debt conservatism are positively related.
As a second strategy to test the effect of the costs of debt, we regress the debt conservatism proxy, i.e. Graham's (2000) kink variable, on several explanatory variables that consider different costs of debt. Specifically, we propose the following regression equation:
where KINK denotes the company's kink; UBETA is the unlevered beta; NOL measures the existence of net operating loss carryforwards; TOBIN'S Q is the market to book ratio; NODIV measures the non-dividend status of the firm; PROF is the return on assets ratio; QUICK is the quick ratio; SIZE is measured as the natural logarithm of total assets; TANG is the percentage of tangible assets over total assets, and LEV measures the leverage ratio as the quotient between total debt and total assets. Table A1 in Appendix provides a summary of the definitions of all the variables.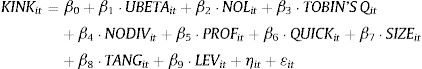
The potential endogeneity of the covariates in Eq. (3) is tackled applying the exogeneity test for tobit models developed by Smith and Blundell (1986), and using lagged values of those variables as instruments when corresponding.
Leverage conservativeness could be due to significant non-tax costs of debt. In this sense, firms use less debt when their expected costs of financial distress are high. On the one hand, we use the unlevered beta (UBETA) as a measure to proxy the costs of distress (Kemsley & Nissim, 2002). On the other hand, we include one dummy variable to identify firms close to financial distress: NOL, which equals one if the firm has net operating loss carryforwards and zero otherwise (Graham, 2000).
Myers (1977) argues that shareholders may forego profitable investment opportunities if project benefits go to the firm's bondholders. This perverse strategy leads firms to use less debt, a problem which becomes more pronounced as the proportion of the firm's value comprised of growth options increases. As a result, growth firms should use less debt. We measure growth investment opportunities with Tobin's q (TOBIN'S Q), computed as the market to book total assets ratio (Graham, 2000).
The existence of informational asymmetries between corporate managers (insiders) and investors (outsiders) may influence the company's financing choice. The so-called pecking order theory of capital structure predicts in this context of asymmetric information a hierarchical order in the financing policy of a company. At the top are the financial sources least affected by the costs of information: first, internal funds, followed by debt, and as a last resort, external equity (Myers & Majluf, 1984). In line with Graham (2000), we create a dummy variable (NODIV) which is equal to one if a firm does not pay dividends and hence may be subject to large informational asymmetries, and zero otherwise.
Cash flows and liquidity can also affect the cost of borrowing. Profitable firms face lower expected costs of financial distress and perceive debt tax shields as more relevant to their business. However, pecking order theory predicts that firms prefer internal funds over external debt. Consequently, we proxy the profitability variable (PROF) as the quotient between earnings before interest, taxes, depreciation and amortization, and total assets (Goyal, Nova, & Zanetti, 2011). On the other hand, illiquid firms usually face high ex ante borrowing costs, and they may also be required by lenders to stay liquid. Our liquidity variable (QUICK) is measured with the quick ratio (Graham, 2000).
Large firms often face lower informational costs when borrowing because they may lessen information asymmetries (Sánchez-Vidal & Martín-Ugedo, 2012), and they may also have low ex-ante financial distress costs. We proxy SIZE by the log of total assets (Frank & Goyal, 2009).
Lastly, a firm with valuable asset collaterals can often borrow on relatively favourable terms because they reduce the risk of non-payment to their creditors, and thus face low borrowing costs (Jensen & Meckling, 1976). Furthermore, since tangible assets assure lenders that they will be repaid in case of insolvency, lower financial distress costs are expected (Frank & Goyal, 2009). As a result, a considerable proportion of tangible assets may indicate a high level of indebtedness (Frank & Goyal, 2003; Faulkender & Petersen, 2006). We measure tangibility (TANG) as the percentage of tangible assets over total assets (Rajan & Zingales, 1995).
We also include the leverage ratio (LEV) in Eq. (3) as a control variable.
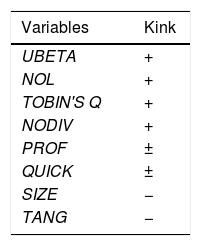
Table 1 summarizes the different expected signs of the explanatory variables on the companies’ kink.
Expected signs of explanatory variables.
| Variables | Kink |
|---|---|
| UBETA | + |
| NOL | + |
| TOBIN'S Q | + |
| NODIV | + |
| PROF | ± |
| QUICK | ± |
| SIZE | − |
| TANG | − |
Table A1 in Appendix provides definitions of all the variables.
In order to test the influence of fiscal variables, in particular, non-debt tax shields, we add four new fiscal variables, namely TAX_SPREAD, NDT_NOL, MTR and NDTS, to the regression model in Eq. (3).
TAX_SPREAD is our key variable, and attempts to capture tax shields or shelters that have been overlooked in the capital structure literature, such as the effects of accelerated depreciation deductions (i.e. timing differences between accounting and taxable incomes), pension contribution deductions and stock option deductions (i.e. permanent differences), etc. Based upon Manzon and Plesko (2002) and Kolay et al. (2013), we calculate the tax spread as the difference between provisions for taxes on the company's income statement and taxes actually paid as detailed in the annual report. As already discussed in “Capital structure theories and empirical evidence” section, there are non-debt tax shields that are non-directly observable or even not publicly reported in firms’ financial statements. A possible proxy for these tax shields is the difference between book tax expense and taxes actually paid, because tax shields can create a spread between the publicly reported book income tax and the income tax privately reported to the fiscal authorities.
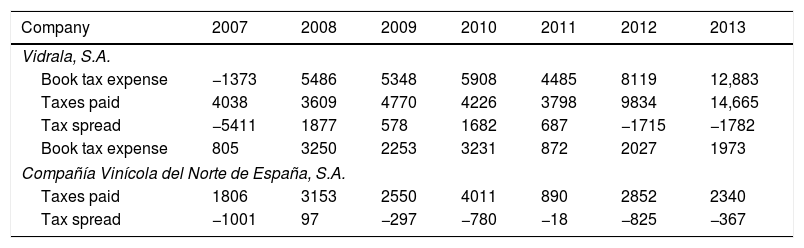
As in most developed economies, in Spain, corporate taxable income is based on the income disclosed in the financial statements, but adjusted in accordance with tax principles. The 2007 Spanish General Accounting Plan (Royal Decree 1514/2007) differentiates between the current tax paid and the deferred tax expense. The book tax expense is the sum of the previous two items. Table 2 depicts two examples of firms with the breakdown of their tax spread. In particular, Vidrala, S.A. actually paid fewer taxes than the accounting tax throughout the period 2008–2011, while Compañía Vinícola del Norte de España, S.A. only did it in 2008. The opposite is true (i.e. a negative spread) in 2007, 2012 and 2013 for Vidrala, S.A., and in 2007 and 2009–2013 for Compañía Vinícola del Norte de España, S.A. These diverse patterns are due to different temporary differences and any net operating loss or tax credit carryforwards that exist at the reporting date.
Tax spreads for two sample firms.
| Company | 2007 | 2008 | 2009 | 2010 | 2011 | 2012 | 2013 |
|---|---|---|---|---|---|---|---|
| Vidrala, S.A. | |||||||
| Book tax expense | −1373 | 5486 | 5348 | 5908 | 4485 | 8119 | 12,883 |
| Taxes paid | 4038 | 3609 | 4770 | 4226 | 3798 | 9834 | 14,665 |
| Tax spread | −5411 | 1877 | 578 | 1682 | 687 | −1715 | −1782 |
| Book tax expense | 805 | 3250 | 2253 | 3231 | 872 | 2027 | 1973 |
| Compañía Vinícola del Norte de España, S.A. | |||||||
| Taxes paid | 1806 | 3153 | 2550 | 4011 | 890 | 2852 | 2340 |
| Tax spread | −1001 | 97 | −297 | −780 | −18 | −825 | −367 |
Values in thousands of euros.
On the other hand, we take into consideration in Eq. (3) other fiscal variables. First, NDT_NOL is a dummy variable that is equal to one if the difference between net deferred taxes and net operating losses is positive, and zero otherwise, focusing on the net fiscal credits that differ from net operating loss (NOL) carryforwards. Second, MTR is the marginal tax rate estimated with earnings before interest and taxes as per Graham et al. (1998). Last, NDTS is the traditional non-debt tax shields measure consisting of the quotient between depreciation and total assets (Bradley et al., 1984).
Table A1 in Appendix provides a summary of the definitions of all the variables.
Data and descriptive statisticsThe data used in this paper come from four sources. Sistema de Análisis de Balances Ibéricos (SABI), a database managed by Bureau Van Dijk and Informa D&B, S.A., and the Spanish Securities and Exchange Commission (CNMV) provide the accounting information from annual accounts, while financial market information comes from the quotation bulletins of the Spanish Stock Exchange and the Bloomberg database.
Our sample comprises 88 Spanish listed companies with information for the seven-year period spanning 2007 to 2013. As is standard in the empirical literature, financial institutions, utilities and governmental enterprises are omitted because these types of companies are intrinsically different in terms of their operations and financial accounting information. Moreover, we focus on this time period because the necessary data for estimating tax related variables have only been available in Spain since fiscal year 2007.8 Specifically, the required data for measuring all of the firm-specific marginal tax rates—which capture the dynamic dimension of taxes—using the approach of Graham et al. (1998), have been only available in Spain since fiscal year 2007. Furthermore, International Financial Reporting Standards (IFRSs) were implemented in Spain on January 1st 2008. The adoption of these IFRSs allows a comparison of our empirical results from the debt policy of Spanish listed companies with those from other markets that have also adopted IFRSs. The incorporation of IFRSs into Spanish Accounting regulation through the 2007.
General Accounting Plan, GAP, resulted in significant differences in concepts relating to accounting entries and registering companies’ operations. As such, the 1990 GAP and 2007 GAP are not comparable. The 2007 GAP introduced novel approaches with respect to assets, liabilities, and equity. Furthermore, the 2007 GAP considers temporary differences which include not only the time differences (included in the 1990 GAP) between taxable income and accounting profit before tax stemming from different timing criteria used to determine these two results, but also other relating to other issues.9 This new approach with respect to temporary differences is captured in our tax spread variable.
Finally, in order to mitigate the effect of outliers, all the variables are winsorized at 0.5% in each tail of the distribution.
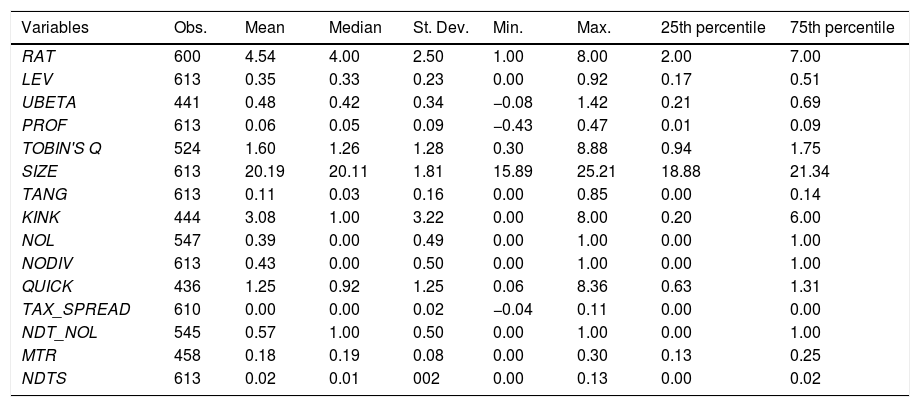
Summary statistics for the variables used in the empirical specifications of Eqs. (1)–(3) are shown in Table 3.
Descriptive statistics.
| Variables | Obs. | Mean | Median | St. Dev. | Min. | Max. | 25th percentile | 75th percentile |
|---|---|---|---|---|---|---|---|---|
| RAT | 600 | 4.54 | 4.00 | 2.50 | 1.00 | 8.00 | 2.00 | 7.00 |
| LEV | 613 | 0.35 | 0.33 | 0.23 | 0.00 | 0.92 | 0.17 | 0.51 |
| UBETA | 441 | 0.48 | 0.42 | 0.34 | −0.08 | 1.42 | 0.21 | 0.69 |
| PROF | 613 | 0.06 | 0.05 | 0.09 | −0.43 | 0.47 | 0.01 | 0.09 |
| TOBIN'S Q | 524 | 1.60 | 1.26 | 1.28 | 0.30 | 8.88 | 0.94 | 1.75 |
| SIZE | 613 | 20.19 | 20.11 | 1.81 | 15.89 | 25.21 | 18.88 | 21.34 |
| TANG | 613 | 0.11 | 0.03 | 0.16 | 0.00 | 0.85 | 0.00 | 0.14 |
| KINK | 444 | 3.08 | 1.00 | 3.22 | 0.00 | 8.00 | 0.20 | 6.00 |
| NOL | 547 | 0.39 | 0.00 | 0.49 | 0.00 | 1.00 | 0.00 | 1.00 |
| NODIV | 613 | 0.43 | 0.00 | 0.50 | 0.00 | 1.00 | 0.00 | 1.00 |
| QUICK | 436 | 1.25 | 0.92 | 1.25 | 0.06 | 8.36 | 0.63 | 1.31 |
| TAX_SPREAD | 610 | 0.00 | 0.00 | 0.02 | −0.04 | 0.11 | 0.00 | 0.00 |
| NDT_NOL | 545 | 0.57 | 1.00 | 0.50 | 0.00 | 1.00 | 0.00 | 1.00 |
| MTR | 458 | 0.18 | 0.19 | 0.08 | 0.00 | 0.30 | 0.13 | 0.25 |
| NDTS | 613 | 0.02 | 0.01 | 002 | 0.00 | 0.13 | 0.00 | 0.02 |
Table A1 in Appendix provides definitions of all the variables.
The mean kink for our sample is roughly 3.08, indicating most firms appear to be substantially underlevered; on average, our sample companies could have tripled their interest deductions before their marginal tax benefits began to decline. On the other hand, the average of the estimated marginal tax rates of all firms is 18.24%, which is much lower than the statutory tax rate (32.50% for fiscal year 2007 and 30.00% for fiscal year 2008 onwards). This gap is caused by asymmetrical tax treatment of profits and losses and by the loss carryforward provision in the Spanish corporate tax system. The standard deviation of the marginal tax rates is 7.96%, implying that there is moderate variation in the marginal tax rates of all firms.
The leverage ratio measured by total debt to total assets has a mean in our sample of 35%. The average size of the companies is approximately €586 million in terms of book value of assets, and the profitability of our firms’ sample shows an average value of 5.69%. The mean difference between book tax expense and the tax paid is almost €1 million.
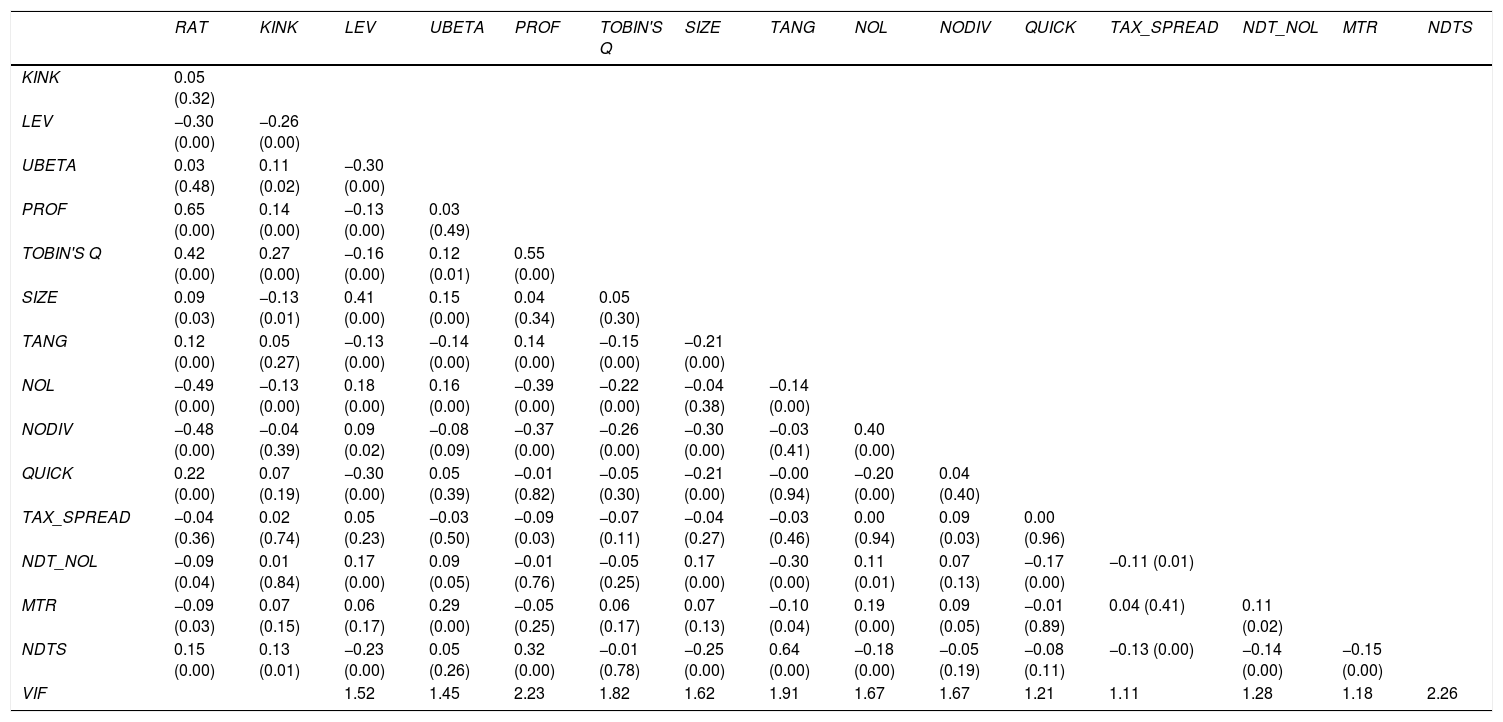
We calculated the correlation matrix and we also performed a multicollinearity test using the Variance Inflation Factor (VIF). Results are reported in Table A2 in Appendix, and the low VIF values suggest that there is no collinearity among the variables considered.
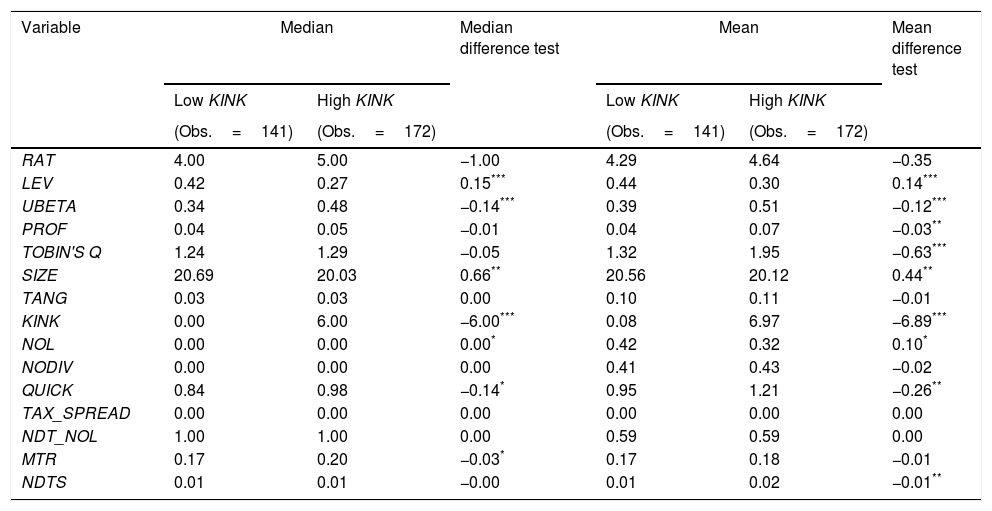
As previously discussed, the kink indicates the extent to which a firm can increase its current leverage before the marginal expected tax benefit of debt financing begins to decrease, and therefore provides a measure of the relative level of conservatism of the firm's capital structure. An interesting comparison emerges between firms that follow very conservative debt policies and those with relatively more aggressive capital structures. In this regard, for each year from 2007 to 2013, we classify firms as belonging to the high kink group if their kink value is in the top quartile (most conservative) of all firms in that year; conversely, we assign firms to the low kink group if their kink value is in the bottom three quartiles. Table 4 presents a comparative analysis between medians and means of the kink and some key variables for both high and low kink groups.
Relation between kink values and explanatory variables.
| Variable | Median | Median difference test | Mean | Mean difference test | ||
|---|---|---|---|---|---|---|
| Low KINK | High KINK | Low KINK | High KINK | |||
| (Obs.=141) | (Obs.=172) | (Obs.=141) | (Obs.=172) | |||
| RAT | 4.00 | 5.00 | −1.00 | 4.29 | 4.64 | −0.35 |
| LEV | 0.42 | 0.27 | 0.15*** | 0.44 | 0.30 | 0.14*** |
| UBETA | 0.34 | 0.48 | −0.14*** | 0.39 | 0.51 | −0.12*** |
| PROF | 0.04 | 0.05 | −0.01 | 0.04 | 0.07 | −0.03** |
| TOBIN'S Q | 1.24 | 1.29 | −0.05 | 1.32 | 1.95 | −0.63*** |
| SIZE | 20.69 | 20.03 | 0.66** | 20.56 | 20.12 | 0.44** |
| TANG | 0.03 | 0.03 | 0.00 | 0.10 | 0.11 | −0.01 |
| KINK | 0.00 | 6.00 | −6.00*** | 0.08 | 6.97 | −6.89*** |
| NOL | 0.00 | 0.00 | 0.00* | 0.42 | 0.32 | 0.10* |
| NODIV | 0.00 | 0.00 | 0.00 | 0.41 | 0.43 | −0.02 |
| QUICK | 0.84 | 0.98 | −0.14* | 0.95 | 1.21 | −0.26** |
| TAX_SPREAD | 0.00 | 0.00 | 0.00 | 0.00 | 0.00 | 0.00 |
| NDT_NOL | 1.00 | 1.00 | 0.00 | 0.59 | 0.59 | 0.00 |
| MTR | 0.17 | 0.20 | −0.03* | 0.17 | 0.18 | −0.01 |
| NDTS | 0.01 | 0.01 | −0.00 | 0.01 | 0.02 | −0.01** |
The high KINK is the group of firms with the most conservative debt policies (i.e. whose kink values are in the top quartile of all firms in that year), while the low KINK is the group of firms that more aggressively use debt financing (i.e. whose kink values belong to the first quartile of all firms in that year).
Statistical significance at 0.01 level.
Table A1 in Appendix provides definitions of all the variables.
As reported in Table 4, median (mean) values for kink are 0.00 (0.08) for the low kink group and 6.00 (6.97) for the high kink group. Comparing the two groups of firms we find that, as expected, the high kink firms have relatively less debt; specifically, the median (mean) leverage ratio is 42% (44%) for the low kink firms, and 27% (30%) for high kink firms. Likewise, the firms with the most conservative debt policies are more profitable, have higher economic risk, are smaller, have lower net operating loss carryforwards, and display a higher working capital compared to their low kink counterparts.
In sum, high kink firms appear to be very conservatively financed, suggesting that these firms apparently forego significant benefits associated with debt financing. If the trade-off theory of capital structure provides a suitable explanation of how firms choose their capital structures, then high kink firms should also be those firms with the largest potential costs associated with the use of debt financing.
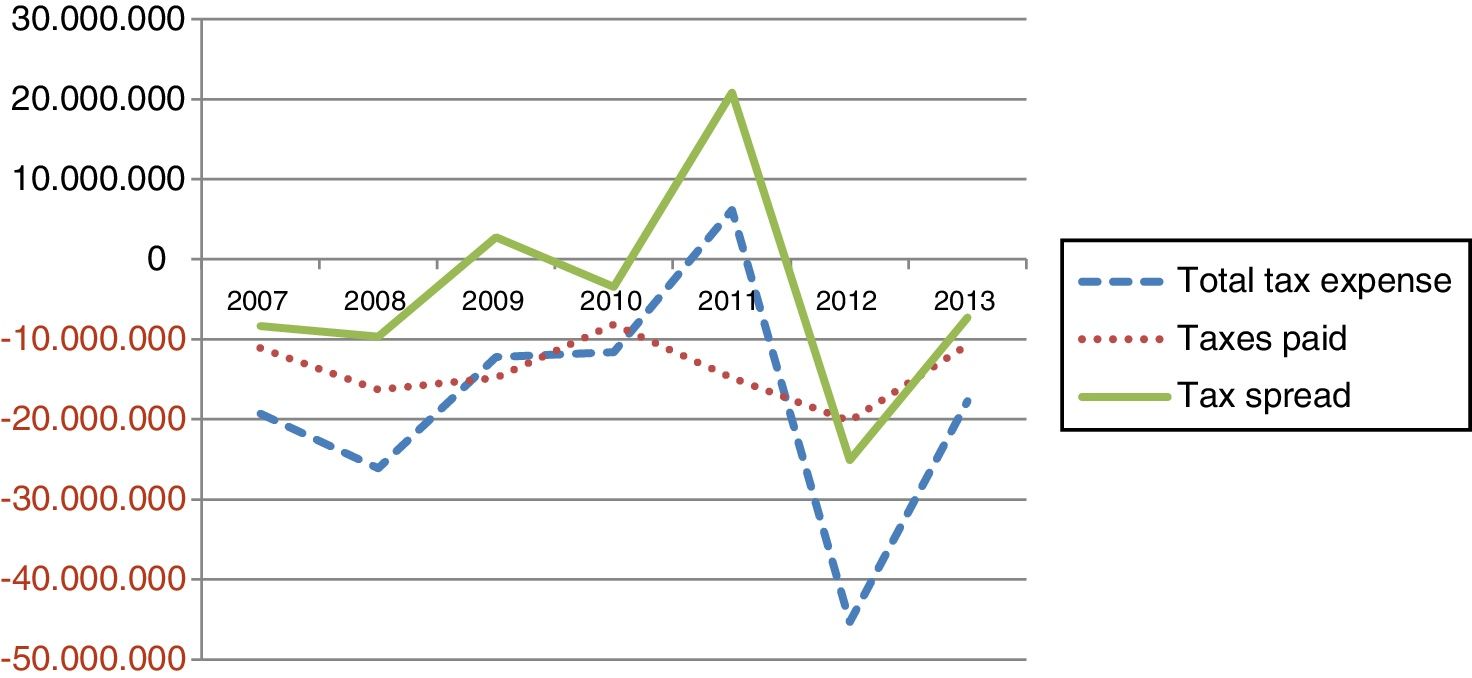
Fig. 1 depicts total tax expense, taxes paid and tax spread for the 2007–2013 period. It indicates a positive trend in the tax spread across the whole series, with the exception of 2012 and 2013. The figure also shows that there are times when the corporate taxes paid actually exceed the book income tax expense; in these years, taxable income is zero or negative.

Fig. 1 indicates that the tax spread takes on both positive and negative values. Timing differences such as accelerated depreciation would tend to reverse over time, resulting in an average zero tax spread. Notwithstanding, the existence of non-observable tax shields and permanent differences between tax and book income are not subject of reversal. Therefore, their contribution to the tax spread might have a non-zero out effect.
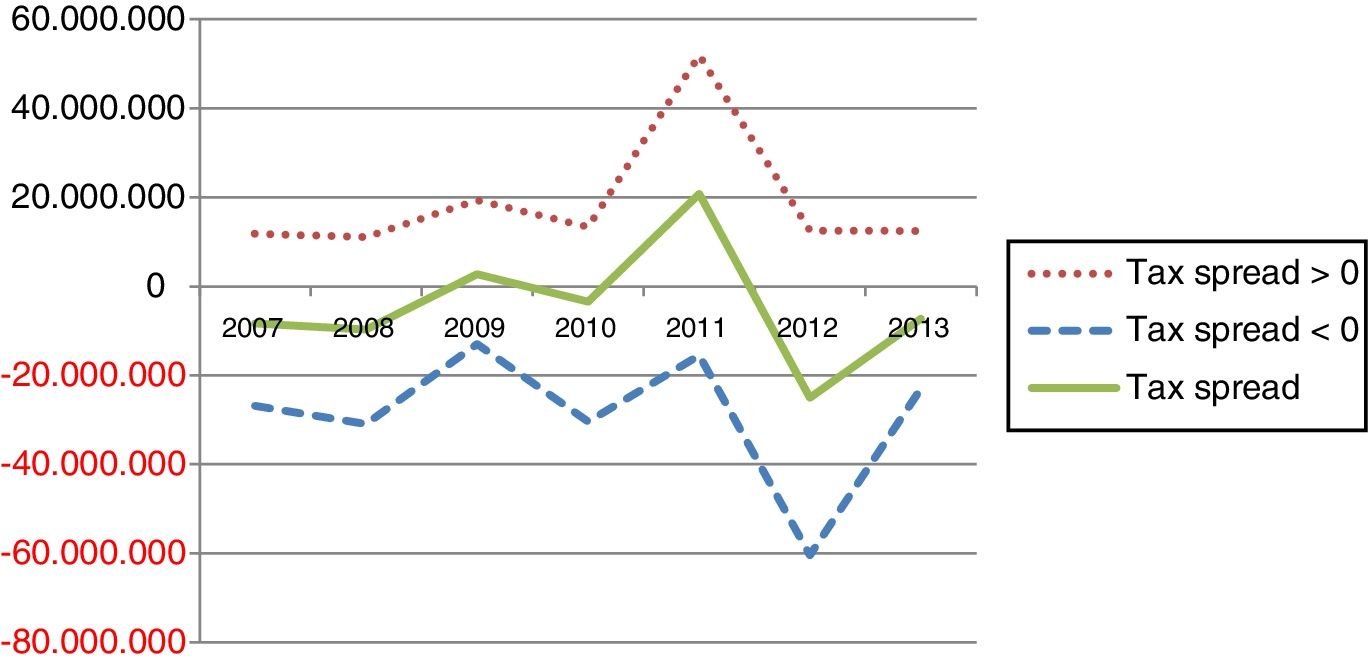
Fig. 2 reports the positive and negative values of the tax spread throughout the time sample, and it shows a parallel trend between both of them jointly with the overall tax spread.
Empirical resultsEstimation of financial distress costs and net debt tax benefit
Following Kaplan and Urwitz (1979) and Molina (2005) we use a panel data ordered probit model for the estimation of the rating Eq. (1). This estimation procedure allows us to consider the ordinal characteristic of a rating-dependent variable.
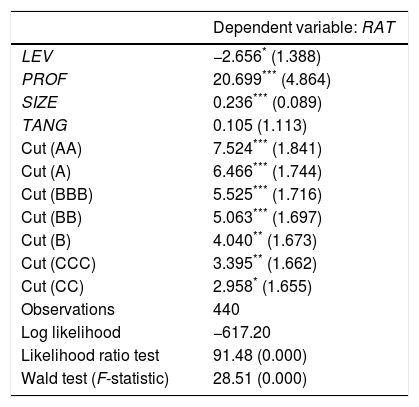
Table 5 reports the results of the estimation of the parameters in Eq. (1).10 We find that leverage is significantly negatively associated with ratings. Conversely, profitability and size are positively related to ratings.
Estimation results of Eq. (1).
| Dependent variable: RAT | |
|---|---|
| LEV | −2.656* (1.388) |
| PROF | 20.699*** (4.864) |
| SIZE | 0.236*** (0.089) |
| TANG | 0.105 (1.113) |
| Cut (AA) | 7.524*** (1.841) |
| Cut (A) | 6.466*** (1.744) |
| Cut (BBB) | 5.525*** (1.716) |
| Cut (BB) | 5.063*** (1.697) |
| Cut (B) | 4.040** (1.673) |
| Cut (CCC) | 3.395** (1.662) |
| Cut (CC) | 2.958* (1.655) |
| Observations | 440 |
| Log likelihood | −617.20 |
| Likelihood ratio test | 91.48 (0.000) |
| Wald test (F-statistic) | 28.51 (0.000) |
Panel data ordered probit regression coefficients estimated from Eq. (1) with robust standard errors in parentheses.
Statistical significance at 0.01 level.
The likelihood ratio test compares the pooled estimator with the panel estimator with the null hypothesis that there are no panel-level effects. (The likelihood ratio test supports the rejection of the null hypothesis that there are no panel effects (Green, 2012; Hosmer, Lemeshow, & Sturdivant, 2013). Accordingly, a panel data estimation is performed as in this case it is more appropriate.) Wald test statistic refers to the null hypothesis that all coefficients of the explanatory variables are equal to zero. (We reject the null hypothesis that all coefficients of the explanatory variables are equal to zero, suggesting that removing them from the model will substantially reduce the fit of the model (Korn & Graubard, 1990).) Table A1 in Appendix provides definitions of all the variables.
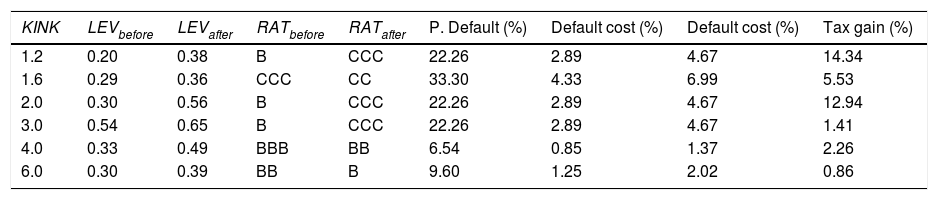
The middle panel of Table 5 provides the cut-points from the panel data ordered probit model to assign a rating to each predicted value. Following Molina (2005), we evaluate the degree to which companies’ ratings, default probabilities and expected default costs, all change when firms increase their leverage. We focus on the minimum leverage increase needed for a downgrade in the firm's rating. Table 6 shows the effects of additional leverage for each kink level.
Debt tax benefits versus financial distress costs.
| KINK | LEVbefore | LEVafter | RATbefore | RATafter | P. Default (%) | Default cost (%) | Default cost (%) | Tax gain (%) |
|---|---|---|---|---|---|---|---|---|
| 1.2 | 0.20 | 0.38 | B | CCC | 22.26 | 2.89 | 4.67 | 14.34 |
| 1.6 | 0.29 | 0.36 | CCC | CC | 33.30 | 4.33 | 6.99 | 5.53 |
| 2.0 | 0.30 | 0.56 | B | CCC | 22.26 | 2.89 | 4.67 | 12.94 |
| 3.0 | 0.54 | 0.65 | B | CCC | 22.26 | 2.89 | 4.67 | 1.41 |
| 4.0 | 0.33 | 0.49 | BBB | BB | 6.54 | 0.85 | 1.37 | 2.26 |
| 6.0 | 0.30 | 0.39 | BB | B | 9.60 | 1.25 | 2.02 | 0.86 |
LEVbefore is the current leverage, while LEVafter is the leverage after increasing interest to the minimum kink to be downgraded. RATbefore is the companies’ rating for the current leverage, while RATafter is the companies’ rating for the leverage after increasing interest to the minimum kink to be downgraded. P. Default is the change in expected default probabilities caused by the change in ratings provided by Standard and Poor's (Standard & Poor's Rating Services, 2015). The default cost columns are the result of multiplying the increase in default probabilities by Branch's (2002) estimation of total bankruptcy-related costs to firm and claimholders (13–21%). Tax gainrefers to the proportional tax gain generated by the leverage increase from LEVbefore to LEVafter, assuming linearity in our estimated tax gains. Table A1 in Appendix provides definitions of all the variables.
In order to carry out the analysis, we assume that factors other than leverage remain at their mean values. Hence, companies with a kink of 2.0 have 0.30, 0.05, 19.07 and 0.21 as their mean leverage, profitability, size and tangibility, respectively. The default probability for each rating is a 10-year average cumulative default rate reported by Standard and Poor's for European companies and which included our period of study (Standard & Poor's Rating Services, 2015). For example, a representative firm with a kink of 2.0 has a B grade for its current leverage. If this firm increases its leverage by 1.90 times, its rating is expected to be downgraded to CCC, raising the default probabilities by 22.26%. On the other hand, for firms with kink of 6.0 the impact of an increase in their leverage by 1.30 times, leads to a rise in their default probabilities of 9.60% as their ratings fall from BB to B. If we assume that our sample firms will experience a decline in firm value from defaults in line with the values reported in Branch (2002), then the default costs of the firms with, for example, a kink of 2.0 will range from 2.89% (13%×22.26%=2.89%) to 4.67% (21%×22.26%=4.67%) of firm value.11
The tax gain column in Table 6 shows the expected tax gains from additional leverage. Using data from Clemente-Almendros and Sogorb-Mira (2016), we determine that the potential loss in tax benefits due to underleverage (i.e. money left on the table) for Spanish listed companies is 14.34%. If firms are optimally levered, the money left on the table could be interpreted as a lower bound for the difficult-to-measure costs of debt that could be incurred if a company were to lever up to its kink (Graham, 2013, chap. 3). Assuming that the previous tax benefit estimation is linear, the tax benefit generated by the leverage increase for a firm with a kink of 2.0 is 12.94%. In this case, the anticipated tax gains are larger than the expected default costs; the minimum and maximum net improvements in a firm's value from additional leverage are 8.27% and 10.05%, respectively. The potential tax benefit is completely offset by the increase in financial distress costs when we use higher kinks: For example, for a representative firm with a kink of 6.0, the net decline in firm value from additional leverage ranges between 1.16% and 0.39%.
Therefore, firms might not be being conservative when using financial debt, as Graham (2000) proposed. Our findings show that the potential tax benefits of increasing leverage might be offset by the ex-ante financial cost, thus explaining the “conservative debt puzzle” (Almeida & Philippon, 2007; Molina, 2005).
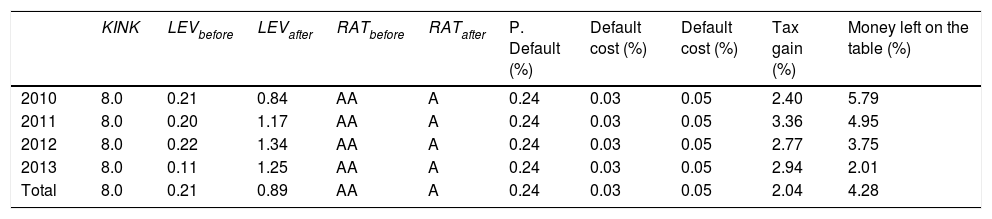
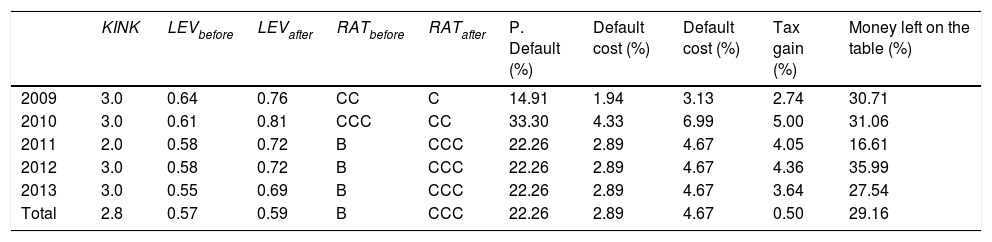
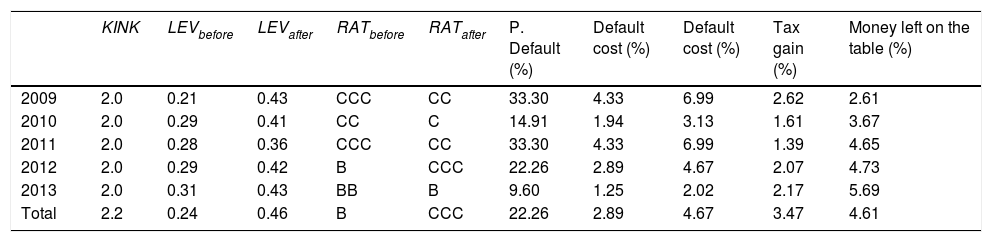
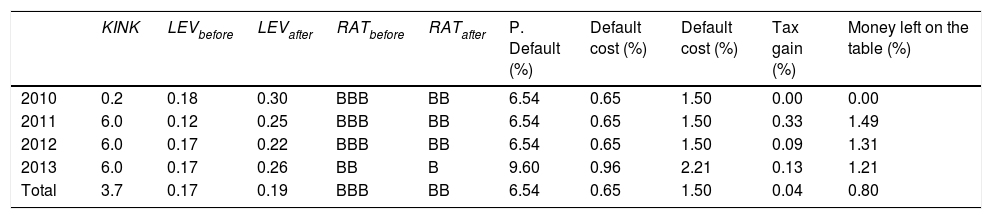
Table A4 in Appendix includes the same analysis, comparing the default costs and tax gains obtained by firms when they increase their leverage, but for each economic sector. Lastly, Tables A5–A8 in Appendix show some specific individual cases of the firms from our sample. In particular, Industria de Diseño Textil, S.A., Papeles y Cartones de Europa, S.A., Tubacex, S.A., and Viscofán, S.A. used debt conservatively over the 2009–2013 period, thus obtaining less tax benefits from interest deductions than they would otherwise have generated with a more expansive leverage strategy. Concurrently, there is a countervailing effect generated by the expected costs of financial distress.
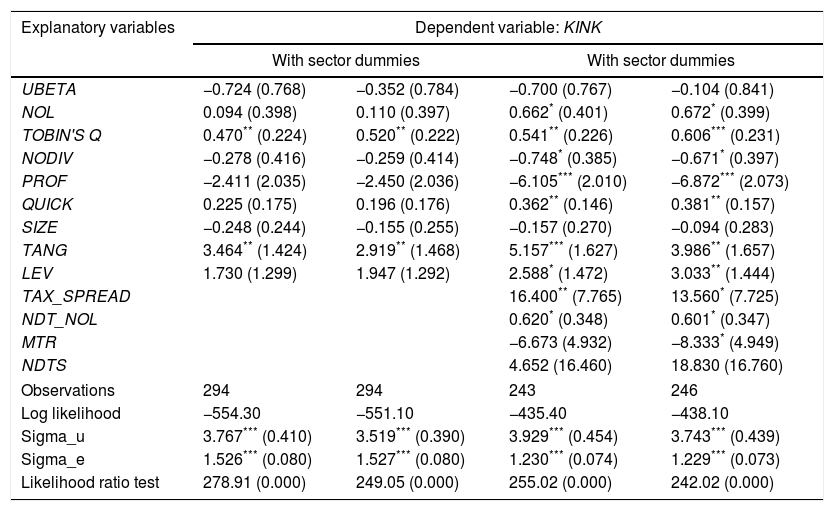
Costs of debt and non-debt tax shieldsIn this subsection, we assess the relationship between kinks and several firms’ characteristics that refer to different non-tax related costs of debt and non-debt tax shields. The minimum value of the kink is zero as it cannot have a negative value, and its maximum value is set at 8.00. Accordingly, we use a multivariate tobit model for the estimation of the kink from Eq. (3). An exogeneity test, namely Smith and Blundell (1986) test, was performed in order to control for the potential endogeneity of the explanatory variables.12Table 7 summarizes the estimation results and includes four columns of data. The first two columns refer to Eq. (3) without and with sector dummies, while the two last columns include the fiscal variables that attempt to capture the effect of non-debt tax shields, also without and with sector dummies.
Estimation results of Eq. (3).
| Explanatory variables | Dependent variable: KINK | |||
|---|---|---|---|---|
| With sector dummies | With sector dummies | |||
| UBETA | −0.724 (0.768) | −0.352 (0.784) | −0.700 (0.767) | −0.104 (0.841) |
| NOL | 0.094 (0.398) | 0.110 (0.397) | 0.662* (0.401) | 0.672* (0.399) |
| TOBIN'S Q | 0.470** (0.224) | 0.520** (0.222) | 0.541** (0.226) | 0.606*** (0.231) |
| NODIV | −0.278 (0.416) | −0.259 (0.414) | −0.748* (0.385) | −0.671* (0.397) |
| PROF | −2.411 (2.035) | −2.450 (2.036) | −6.105*** (2.010) | −6.872*** (2.073) |
| QUICK | 0.225 (0.175) | 0.196 (0.176) | 0.362** (0.146) | 0.381** (0.157) |
| SIZE | −0.248 (0.244) | −0.155 (0.255) | −0.157 (0.270) | −0.094 (0.283) |
| TANG | 3.464** (1.424) | 2.919** (1.468) | 5.157*** (1.627) | 3.986** (1.657) |
| LEV | 1.730 (1.299) | 1.947 (1.292) | 2.588* (1.472) | 3.033** (1.444) |
| TAX_SPREAD | 16.400** (7.765) | 13.560* (7.725) | ||
| NDT_NOL | 0.620* (0.348) | 0.601* (0.347) | ||
| MTR | −6.673 (4.932) | −8.333* (4.949) | ||
| NDTS | 4.652 (16.460) | 18.830 (16.760) | ||
| Observations | 294 | 294 | 243 | 246 |
| Log likelihood | −554.30 | −551.10 | −435.40 | −438.10 |
| Sigma_u | 3.767*** (0.410) | 3.519*** (0.390) | 3.929*** (0.454) | 3.743*** (0.439) |
| Sigma_e | 1.526*** (0.080) | 1.527*** (0.080) | 1.230*** (0.074) | 1.229*** (0.073) |
| Likelihood ratio test | 278.91 (0.000) | 249.05 (0.000) | 255.02 (0.000) | 242.02 (0.000) |
Panel data tobit regression coefficients estimated from Eq. (3) with robust standard errors in parentheses. Table A1 in Appendix provides definitions of all the variables.
Statistical significance at 0.01 level.
Sigma_u and Sigma_e are the overall and panel-level variance components, respectively. The likelihood ratio test compares the pooled estimator with the panel estimator with the null hypothesis that there are no panel-level effects. (The likelihood ratio test supports the rejection of the null hypothesis that there are no panel effects (Green, 2012; Hosmer et al., 2013). Accordingly, a panel data estimation is performed as in this case it is more appropriate.)
On the one hand, the regression results in Table 7 indicate that firms use debt conservatively only when they face high growth opportunities and have a high percentage of tangible assets. Consequently, in our first attempt to explain the kink by using only cost variables, we can only confirm the expected effect of agency costs of debt, and specifically, the debt overhang problem stated by Myers (1977). That is consistent with the fact that growth firms, having important investments in the future, use less debt (Bigelli et al., 2014; McDonald & Siegel, 1986).
On the other hand, when fiscal variables are included in the regression model of Eq. (3), the abovementioned relationships remain but now some other explanatory variables show a significant relation with debt conservativeness. The results show that net operating loss carryforwards, which indicate companies close to financial distress, have a positive and significant relationship with the kink; profitable firms use less debt, as suggested by the pecking order theory. Finally, the availability of liquid assets has a positive impact on debt conservatism, suggesting firms may face a requirement to remain liquid to obtain financing, and thus build a short-term reserve (Graham, 2000).
When analysing the results of our fiscal variables, as expected, we find that Furthermore, significant positive relations between the tax spread variable and NDT_NOL variable and the kink are found. This empirical evidence implies that, when we properly measure non-debt tax shields, we can confirm that firms tend to be more conservative in debt financing when they have non-debt tax shields at their disposal (Graham & Tucker, 2006). Besides, we show that there are more substitutes for fiscal debt advantages than the traditional variables used in corporate finance. For instance, the management of non-observable tax deductions, such as temporary differences, allow firms to maximize the tax bill by circumventing the use of interest tax deductions (Shivdasani & Stefanescu, 2010). This confirmation offers an insight into why the traditional corporate finance theories sometimes failed to explain the apparent under-use of financial debt.
Moreover, since marginal tax rates increase the expected tax savings, a positive relationship is expected with the use of debt (Graham et al., 1998), and a negative relationship with the kink. However, our results show that this negative sign is significant only when we control for industry. As such, we confirm the economic impact of taxes on debt.
Regarding the traditional non-debt tax shields, the sign is positive (Minton & Wruck, 2001), but not significant.
ConclusionsA generalized view in corporate finance is that firms are less leveraged than they should be, at least according to the large potential tax benefits that they could attain by leveraging up their capital structure. The present research belongs to the cohort of empirical studies that have recently analyzed conservatism in corporate debt policy.
Our results show that the most conservative Spanish listed firms in terms of debt financing, are not acting sub-optimally regarding debt tax advantage. In this regard, we provide empirical evidence that, on the one hand, expected default costs could offset in the extreme cases the majority of the potential tax savings, and on the other hand, that tax sheltering is economically important. Therefore, using three different empirical approaches, we prove that, on the one hand, expected default costs and, on the other hand, tax shields may counterbalance interest deductions. Our results thus might suggest that firms with large kinks do not pursue debt aggressively because the cost of doing so is high (mainly financial distress costs), and consequently shed additional light on the so-called “conservative leverage puzzle”.
We contribute to the literature by explaining the observed leverage levels of Spanish listed companies, without explicitly calculating an optimal level of leverage nor using the standard regression approach of capital structure research. Moreover, our analysis includes a different and straightforward measure for non-debt tax shields, which is able to capture the effects of different tax shields. To the best of our knowledge, this is the first empirical analysis of the assessment of debt conservatism related to costs of debt and non-debt tax shield within a Spanish context. The setting is particularly relevant as Spain is member of the European Union and adheres to international accounting rules; consequently, the convergence process in the Euro area may mean that the conclusions reached in this paper can be extrapolated to other European countries. Accordingly, our paper may contribute to developing a line of empirical evidence in Europe on the net benefits of debt and conservative debt policies.
Our study is no exception when it comes to limitations. For instance, our first measure of the costs of debt focuses on default events and, therefore, excludes other costs of debt. As Van Binsbergen et al. (2010) found, the cost of being over-levered is asymmetrically higher than the cost of being under-levered, and the expected default costs constitute only half of the total ex-ante costs of debt. In spite of having considered other costs of debt such as agency costs or asymmetric information costs, we have not identified clear relationships between these costs and our debt conservativeness proxy. This may suggest that our cost estimates could be underestimated, and by extension, that the debt policy's conservativeness of Spanish listed companies remains an open question. Additionally, and as Strebulaev and Yang (2013) point out, to explain the “conservative leverage puzzle” it is necessary to explain why some firms tend not to have any debt at all instead of why firms on average have lower outstanding debt than expected. This new empirical strategy facilitates the identification of the economic mechanisms that lead firms to become low-levered, and extends the line of research that originated with Graham (2000) regarding the apparent non-optimizing policy on debt tax benefits. Finally, the small number of observations in our sample might be considered a limitation.
The implications of our findings for company managers are significant. It is essential that they reassess their company debt policy. Accordingly, each company should explicitly calculate the benefits that could be attained by increasing leverage. If the costs of using more leverage are lower than the benefits, then the firm should consider increasing its indebtedness.
FundingFrancisco Sogorb-Mira acknowledges financial support from Ministry of Economy and Competitiveness research grant ECO2015-67035-P. The authors are grateful to Carlos Garrido from Standard and Poor's for his help in providing companies’ ratings data, and the participants at the XXIV Finance Forum (Madrid, Spain) and the 6th Global Innovation and Knowledge Academy (GIKA) Conference (Valencia, Spain) for useful comments and discussions on previous versions of this paper. Any errors are the sole responsibility of the authors.
Conflict of interestThe authors declare no conflicts of interest.
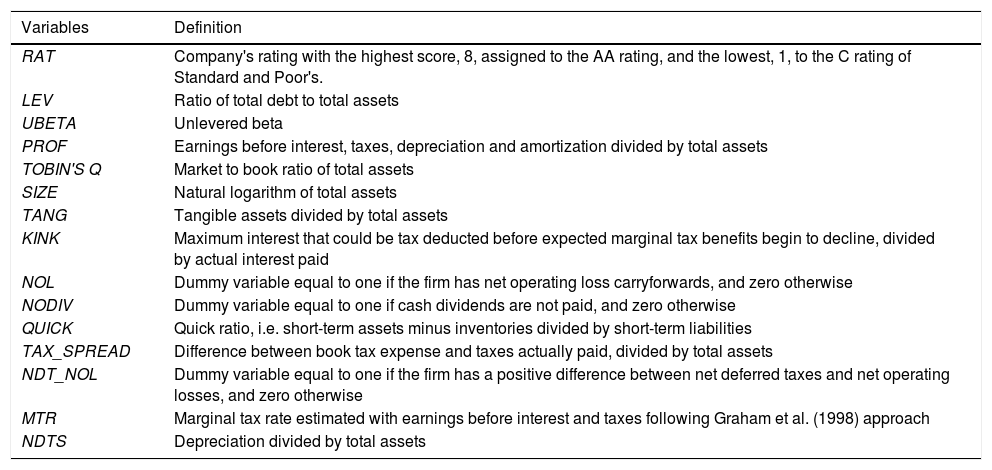
Definition of variables.
| Variables | Definition |
|---|---|
| RAT | Company's rating with the highest score, 8, assigned to the AA rating, and the lowest, 1, to the C rating of Standard and Poor's. |
| LEV | Ratio of total debt to total assets |
| UBETA | Unlevered beta |
| PROF | Earnings before interest, taxes, depreciation and amortization divided by total assets |
| TOBIN'S Q | Market to book ratio of total assets |
| SIZE | Natural logarithm of total assets |
| TANG | Tangible assets divided by total assets |
| KINK | Maximum interest that could be tax deducted before expected marginal tax benefits begin to decline, divided by actual interest paid |
| NOL | Dummy variable equal to one if the firm has net operating loss carryforwards, and zero otherwise |
| NODIV | Dummy variable equal to one if cash dividends are not paid, and zero otherwise |
| QUICK | Quick ratio, i.e. short-term assets minus inventories divided by short-term liabilities |
| TAX_SPREAD | Difference between book tax expense and taxes actually paid, divided by total assets |
| NDT_NOL | Dummy variable equal to one if the firm has a positive difference between net deferred taxes and net operating losses, and zero otherwise |
| MTR | Marginal tax rate estimated with earnings before interest and taxes following Graham et al. (1998) approach |
| NDTS | Depreciation divided by total assets |
Correlation matrix and variance inflation factors.*
| RAT | KINK | LEV | UBETA | PROF | TOBIN'S Q | SIZE | TANG | NOL | NODIV | QUICK | TAX_SPREAD | NDT_NOL | MTR | NDTS | |
|---|---|---|---|---|---|---|---|---|---|---|---|---|---|---|---|
| KINK | 0.05 (0.32) | ||||||||||||||
| LEV | −0.30 (0.00) | −0.26 (0.00) | |||||||||||||
| UBETA | 0.03 (0.48) | 0.11 (0.02) | −0.30 (0.00) | ||||||||||||
| PROF | 0.65 (0.00) | 0.14 (0.00) | −0.13 (0.00) | 0.03 (0.49) | |||||||||||
| TOBIN'S Q | 0.42 (0.00) | 0.27 (0.00) | −0.16 (0.00) | 0.12 (0.01) | 0.55 (0.00) | ||||||||||
| SIZE | 0.09 (0.03) | −0.13 (0.01) | 0.41 (0.00) | 0.15 (0.00) | 0.04 (0.34) | 0.05 (0.30) | |||||||||
| TANG | 0.12 (0.00) | 0.05 (0.27) | −0.13 (0.00) | −0.14 (0.00) | 0.14 (0.00) | −0.15 (0.00) | −0.21 (0.00) | ||||||||
| NOL | −0.49 (0.00) | −0.13 (0.00) | 0.18 (0.00) | 0.16 (0.00) | −0.39 (0.00) | −0.22 (0.00) | −0.04 (0.38) | −0.14 (0.00) | |||||||
| NODIV | −0.48 (0.00) | −0.04 (0.39) | 0.09 (0.02) | −0.08 (0.09) | −0.37 (0.00) | −0.26 (0.00) | −0.30 (0.00) | −0.03 (0.41) | 0.40 (0.00) | ||||||
| QUICK | 0.22 (0.00) | 0.07 (0.19) | −0.30 (0.00) | 0.05 (0.39) | −0.01 (0.82) | −0.05 (0.30) | −0.21 (0.00) | −0.00 (0.94) | −0.20 (0.00) | 0.04 (0.40) | |||||
| TAX_SPREAD | −0.04 (0.36) | 0.02 (0.74) | 0.05 (0.23) | −0.03 (0.50) | −0.09 (0.03) | −0.07 (0.11) | −0.04 (0.27) | −0.03 (0.46) | 0.00 (0.94) | 0.09 (0.03) | 0.00 (0.96) | ||||
| NDT_NOL | −0.09 (0.04) | 0.01 (0.84) | 0.17 (0.00) | 0.09 (0.05) | −0.01 (0.76) | −0.05 (0.25) | 0.17 (0.00) | −0.30 (0.00) | 0.11 (0.01) | 0.07 (0.13) | −0.17 (0.00) | −0.11 (0.01) | |||
| MTR | −0.09 (0.03) | 0.07 (0.15) | 0.06 (0.17) | 0.29 (0.00) | −0.05 (0.25) | 0.06 (0.17) | 0.07 (0.13) | −0.10 (0.04) | 0.19 (0.00) | 0.09 (0.05) | −0.01 (0.89) | 0.04 (0.41) | 0.11 (0.02) | ||
| NDTS | 0.15 (0.00) | 0.13 (0.01) | −0.23 (0.00) | 0.05 (0.26) | 0.32 (0.00) | −0.01 (0.78) | −0.25 (0.00) | 0.64 (0.00) | −0.18 (0.00) | −0.05 (0.19) | −0.08 (0.11) | −0.13 (0.00) | −0.14 (0.00) | −0.15 (0.00) | |
| VIF | 1.52 | 1.45 | 2.23 | 1.82 | 1.62 | 1.91 | 1.67 | 1.67 | 1.21 | 1.11 | 1.28 | 1.18 | 2.26 |
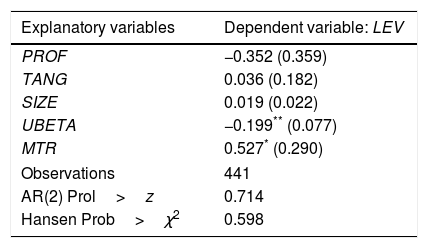
Estimation results of Eq. (2).
| Explanatory variables | Dependent variable: LEV |
|---|---|
| PROF | −0.352 (0.359) |
| TANG | 0.036 (0.182) |
| SIZE | 0.019 (0.022) |
| UBETA | −0.199** (0.077) |
| MTR | 0.527* (0.290) |
| Observations | 441 |
| AR(2) Prol>z | 0.714 |
| Hansen Prob>χ2 | 0.598 |
GMM regression coefficients estimated from Eq. (2) with standard errors, adjusted by employing the finite sample correction proposed by Windmeijer (2005), in parentheses. AR(2) is a second-order serial correlation test. (We do not reject the null hypothesis of no autocorrelation of the residuals (Arellano & Bond, 1991).) Hansen is a test of the over-identifying restrictions, asymptotically distributed as χ2 under the null of no correlation between the instruments and the error term. (That statistic is far from rejecting the null hypothesis, indicating that our instruments are appropriate (Baum, Schaffer, & Stillman, 2007).)
Statistical significance at 0.05 level.
*** Statistical significance at 0.01 level.
Table A1 in the Appendix provides definitions of all the variables.
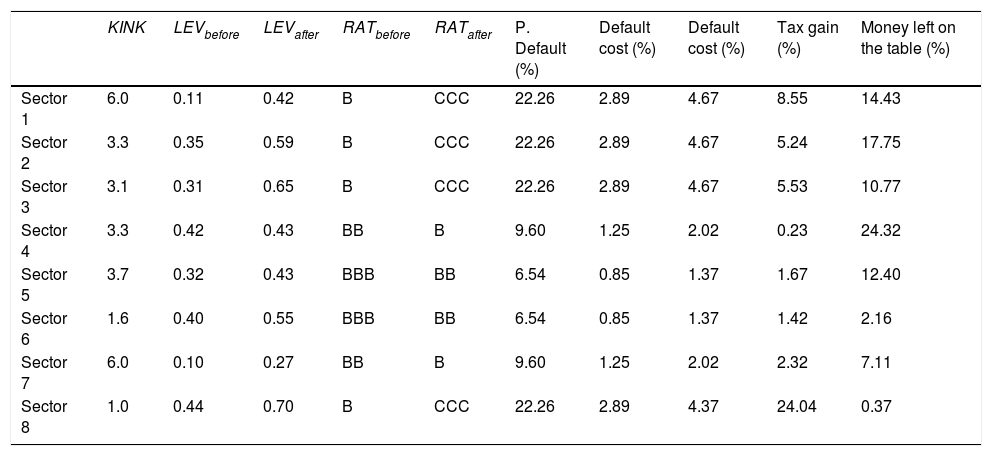
Debt tax benefits versus financial distress costs by economic sectors.
| KINK | LEVbefore | LEVafter | RATbefore | RATafter | P. Default (%) | Default cost (%) | Default cost (%) | Tax gain (%) | Money left on the table (%) | |
|---|---|---|---|---|---|---|---|---|---|---|
| Sector 1 | 6.0 | 0.11 | 0.42 | B | CCC | 22.26 | 2.89 | 4.67 | 8.55 | 14.43 |
| Sector 2 | 3.3 | 0.35 | 0.59 | B | CCC | 22.26 | 2.89 | 4.67 | 5.24 | 17.75 |
| Sector 3 | 3.1 | 0.31 | 0.65 | B | CCC | 22.26 | 2.89 | 4.67 | 5.53 | 10.77 |
| Sector 4 | 3.3 | 0.42 | 0.43 | BB | B | 9.60 | 1.25 | 2.02 | 0.23 | 24.32 |
| Sector 5 | 3.7 | 0.32 | 0.43 | BBB | BB | 6.54 | 0.85 | 1.37 | 1.67 | 12.40 |
| Sector 6 | 1.6 | 0.40 | 0.55 | BBB | BB | 6.54 | 0.85 | 1.37 | 1.42 | 2.16 |
| Sector 7 | 6.0 | 0.10 | 0.27 | BB | B | 9.60 | 1.25 | 2.02 | 2.32 | 7.11 |
| Sector 8 | 1.0 | 0.44 | 0.70 | B | CCC | 22.26 | 2.89 | 4.37 | 24.04 | 0.37 |
Sector 1 includes agriculture, mining and quarrying, Sector 2 is manufacturing, Sector 3 includes electricity, gas and water, Sector 4 is construction, Sector 5 includes wholesale and retail trade, transportation and accommodation, Sector 6 includes information and communication, Sector 7 is real state activities, and Sector 8 includes professional, scientific and support service activities. LEVbefore is the current leverage, while LEVafter is the leverage after increasing interest to the kink. RATbefore is the companies’ rating for the current leverage, while RATafter is the companies’ rating for the leverage after increasing interest to the kink. P. Default is the change in expected default probabilities caused by the change in ratings provided by Standard and Poor's (Standard & Poor's Rating Services, 2015). The default cost columns are a result of multiplying the increase in default probabilities by Branch's (2002) estimation of total bankruptcy-related costs to firm and claimholders (13–21%). Tax gain refers to the proportional tax gain generated by the leverage increase from LEVbefore to LEVafter, assuming linearity in our estimated tax gains. Money left on the table is the additional tax benefit that could be obtained if firms with a kink greater than one levered up to the kink in their interest benefit functions. Table A1 provides definitions of all the variables.
Debt tax benefits versus financial distress costs for Industria de Diseño Textil, S.A.
| KINK | LEVbefore | LEVafter | RATbefore | RATafter | P. Default (%) | Default cost (%) | Default cost (%) | Tax gain (%) | Money left on the table (%) | |
|---|---|---|---|---|---|---|---|---|---|---|
| 2010 | 8.0 | 0.21 | 0.84 | AA | A | 0.24 | 0.03 | 0.05 | 2.40 | 5.79 |
| 2011 | 8.0 | 0.20 | 1.17 | AA | A | 0.24 | 0.03 | 0.05 | 3.36 | 4.95 |
| 2012 | 8.0 | 0.22 | 1.34 | AA | A | 0.24 | 0.03 | 0.05 | 2.77 | 3.75 |
| 2013 | 8.0 | 0.11 | 1.25 | AA | A | 0.24 | 0.03 | 0.05 | 2.94 | 2.01 |
| Total | 8.0 | 0.21 | 0.89 | AA | A | 0.24 | 0.03 | 0.05 | 2.04 | 4.28 |
LEVbefore is the current leverage, while LEVafter is the leverage after increasing interest to the kink. RATbefore is the companies’ rating for the current leverage, while RATafter is the companies’ rating for the leverage after increasing interest to the kink. P. Default is the change in expected default probabilities caused by the change in ratings provided by Standard and Poor's (Standard & Poor's Rating Services, 2015). The default cost columns are the result of multiplying the increase in default probabilities by Branch's (2002) estimation of total bankruptcy-related costs to firm and claimholders (13–21%). Tax gain refers to the proportional tax gain generated by the leverage increase from LEVbefore to LEVafter, assuming linearity in our estimated tax gains. Money left on the table is the additional tax benefit that could be obtained if firms with a kink greater than one levered up to the kink in their interest benefit functions. Table A1 provides definitions of all the variables.
Debt tax benefits versus financial distress costs for Papeles y Cartones de Europa, S.A.
| KINK | LEVbefore | LEVafter | RATbefore | RATafter | P. Default (%) | Default cost (%) | Default cost (%) | Tax gain (%) | Money left on the table (%) | |
|---|---|---|---|---|---|---|---|---|---|---|
| 2009 | 3.0 | 0.64 | 0.76 | CC | C | 14.91 | 1.94 | 3.13 | 2.74 | 30.71 |
| 2010 | 3.0 | 0.61 | 0.81 | CCC | CC | 33.30 | 4.33 | 6.99 | 5.00 | 31.06 |
| 2011 | 2.0 | 0.58 | 0.72 | B | CCC | 22.26 | 2.89 | 4.67 | 4.05 | 16.61 |
| 2012 | 3.0 | 0.58 | 0.72 | B | CCC | 22.26 | 2.89 | 4.67 | 4.36 | 35.99 |
| 2013 | 3.0 | 0.55 | 0.69 | B | CCC | 22.26 | 2.89 | 4.67 | 3.64 | 27.54 |
| Total | 2.8 | 0.57 | 0.59 | B | CCC | 22.26 | 2.89 | 4.67 | 0.50 | 29.16 |
LEVbefore is the current leverage, while LEVafter is the leverage after increasing interest to the kink. RATbefore is the company rating for the current leverage, while RATafter is the companies’ rating for the leverage after increasing interest to the kink. P. Default is the change in expected default probabilities caused by the change in ratings provided by Standard and Poor's (Standard & Poor's Rating Services, 2015). The default cost columns are the result of multiplying the increase in default probabilities by Branch's (2002) estimation of total bankruptcy-related costs to firm and claimholders (13–21%). Tax gain refers to the proportional tax gain generated by the leverage increase from LEVbefore to LEVafter, assuming linearity in our estimated tax gains. Money left on the table is the additional tax benefit that could be obtained if firms with a kink greater than one levered up to the kink in their interest benefit functions. Table A1 provides definitions of all the variables.
Debt tax benefits versus financial distress costs for Tubacex, S.A.
| KINK | LEVbefore | LEVafter | RATbefore | RATafter | P. Default (%) | Default cost (%) | Default cost (%) | Tax gain (%) | Money left on the table (%) | |
|---|---|---|---|---|---|---|---|---|---|---|
| 2009 | 2.0 | 0.21 | 0.43 | CCC | CC | 33.30 | 4.33 | 6.99 | 2.62 | 2.61 |
| 2010 | 2.0 | 0.29 | 0.41 | CC | C | 14.91 | 1.94 | 3.13 | 1.61 | 3.67 |
| 2011 | 2.0 | 0.28 | 0.36 | CCC | CC | 33.30 | 4.33 | 6.99 | 1.39 | 4.65 |
| 2012 | 2.0 | 0.29 | 0.42 | B | CCC | 22.26 | 2.89 | 4.67 | 2.07 | 4.73 |
| 2013 | 2.0 | 0.31 | 0.43 | BB | B | 9.60 | 1.25 | 2.02 | 2.17 | 5.69 |
| Total | 2.2 | 0.24 | 0.46 | B | CCC | 22.26 | 2.89 | 4.67 | 3.47 | 4.61 |
LEVbefore is the current leverage, while LEVafter is the leverage after increasing interest to the kink. RATbefore is the companies’ rating for the current leverage, while RATafter is the companies’ rating for the leverage after increasing interest to the kink. P. Default is the change in expected default probabilities caused by the change in ratings provided by Standard and Poor's (Standard & Poor's Rating Services, 2015). The default cost columns are the result of multiplying the increase in default probabilities by Branch's (2002) estimation of total bankruptcy-related costs to firm and claimholders (13–21%). Tax gain refers to the proportional tax gain generated by the leverage increase from LEVbefore to LEVafter, assuming linearity in our estimated tax gains. Money left on the table is the additional tax benefit that could be obtained if firms with a kink greater than one levered up to the kink in their interest benefit functions. Table A1 provides definitions of all the variables.
Debt tax benefits versus financial distress costs for Viscofán, S.A.
| KINK | LEVbefore | LEVafter | RATbefore | RATafter | P. Default (%) | Default cost (%) | Default cost (%) | Tax gain (%) | Money left on the table (%) | |
|---|---|---|---|---|---|---|---|---|---|---|
| 2010 | 0.2 | 0.18 | 0.30 | BBB | BB | 6.54 | 0.65 | 1.50 | 0.00 | 0.00 |
| 2011 | 6.0 | 0.12 | 0.25 | BBB | BB | 6.54 | 0.65 | 1.50 | 0.33 | 1.49 |
| 2012 | 6.0 | 0.17 | 0.22 | BBB | BB | 6.54 | 0.65 | 1.50 | 0.09 | 1.31 |
| 2013 | 6.0 | 0.17 | 0.26 | BB | B | 9.60 | 0.96 | 2.21 | 0.13 | 1.21 |
| Total | 3.7 | 0.17 | 0.19 | BBB | BB | 6.54 | 0.65 | 1.50 | 0.04 | 0.80 |
LEVbefore is the current leverage, while LEVafter is the leverage after increasing interest to the kink. RATbefore is the companies’ rating for the current leverage, while RATafter is the companies’ rating for the leverage after increasing interest to the kink. P. Default is the change in expected default probabilities caused by the change in ratings provided by Standard and Poor's (Standard & Poor's Rating Services, 2015). The default cost columns are the result of multiplying the increase in default probabilities by Branch's (2002) estimation of total bankruptcy-related costs to firm and claimholders (13–21%). Tax gain refers to the proportional tax gain generated by the leverage increase from LEVbefore to LEVafter, assuming linearity in our estimated tax gains. Money left on the table is the additional tax benefit that could be obtained if firms with a kink greater than one levered up to the kink in their interest benefit functions. Table A1 provides definitions of all the variables.
A detailed review of the literature on the role of non-debt tax shields in corporate finance is provided by Graham (2003).
There is also scant research contrasting this view, such as Ju, Parrino, Poteshman, and Weisbach (2005).
For example, under certain circumstances, International Financial Reporting Standards (IFRS) require foreign subsidiaries to consolidate under the parent company, but the earnings coming from the subsidiaries are not recognized as taxable income until they are actually transferred to the parent company. Consequently, companies may permanently defer income tax through reinvestment abroad.
Closely related to this respect, Clemente-Almendros and Sogorb-Mira (2016) analyze the impact of the 2012 new capitalization rule approved by the Spanish Government on corporate debt policy.
We have also considered an alternative leverage ratio with market values. Unreported results are in the same vein as those obtained in “Empirical results” section, and are available upon request to the authors.
Untabulated results are qualitatively the same as those obtained with RAT dependent variable in Eq. (1), and are available upon request to the authors.
Another way to look at this numerator is to consider the amount of interest required in order to make earnings after interest and before taxes equal to zero.
As in many other countries, data based on financial statements do not reflect tax accounting conventions and companies’ actual tax incentives. In addition, Plesko (2003) suggests that the relation between financial and tax reporting may be very weak.
Among these other issues, it is worth noting income and expenses recognized directly in equity that are not considered as taxable income, including changes in the value of assets and liabilities, or fiscal differences in business combinations.
As Blouin et al. (2010) note, a drawback of this analysis is that default costs may vary for other reasons besides firm leverage. Notwithstanding, our aim is to produce findings comparable to prior research within this area.

www.publicationethics.org.