


Introduction
Recording biological signals provides a primary doorway to the understanding of how the human body behaves under normal and pathological conditions. The rhythmical activity of the heart, for example, might be studied by measuring the difference of electric potential between two appropriate locations on the body surface. Similarly, bodily temperature and metabolism may be monitored with the use of specific devices. Once acquired, these biological signals demand proper treatments to unveil relevant information. Standards for the conditioning, acquisition and processing of biological signals are consolidated into widespread techniques of measurement1-3.
The possibility of studying the activation of skeletal muscles, through the recording of electrical potentials produced during muscle contractions (the electromyogram [EMG]), is of particular relevance in sports science and rehabilitation medicine. For instance, by issuing adequate commands to skeletal muscles in the body, the figure skaters, for example, perform gracious spins and jumps. Rowers, on the other hand, control their skeletal muscles to periodically produce explosive leg extensions, followed by a firmly pull of the oar. The EMG provides a window into the scaling of the intensity and velocity of muscle contraction and thus into the regulation of the forces exerted over the body joints2,4-6.
Electromyography is the technique for the detection and analysis of EMGs7. With electrodes placed on the surface of the skin or inserted in the muscle tissue8,9, it is possible to study how the controlling commands, issued by rowers or figure skaters, translate into muscle activation. For obvious reasons, the use of surface electrodes became more accepted in clinical and physiological applications. However, the interpretation of surface EMGs urges care. De Luca10 wisely stated that «EMG is too easy to use and consequently too easy to abuse».
This review synthesizes chief aspects concerning the detection and application of surface EMGs and describes how the use of arrays of surface electrodes adds to the current knowledge of the neuromuscular system. Recent reviews reporting detailed issues on the detection, processing and application of intramuscular and surface EMGs are available to the interested reader11-15.
The myoelectric activity
The motor unit action potential (MUAP)
Motor units (MUs) are the functional entities of the neuromuscular system. Each MU comprises a single motoneurone and the muscle fibers supplied by its axonal branches16. Once a motoneurone discharges, action potentials are generated at its neuromuscular junctions and then propagate along all the muscle fibers, toward the tendon regions. The summation of these potentials is termed motor unit action potentials (MUAP) and is responsible for the muscle contraction.
The compound surface electromyogram
The gradation of muscle force depends on the number of MUs active and on the rate with which the active units discharge17-20. Both mechanisms are known as spatial and temporal summation of MUAPs. The relative contribution of these mechanisms to the regulation of muscle force is controversial, as it varies between muscles, with the target force and with the contraction type18,19. In general, MUs are recruited from the smallest to the largest (for example MUs with the fewest fibers are recruited first). This seems to be a corollary of muscle force production21.
This orderly recruitment of MUs was termed the size principle21. Although such principle has been verified extensively22-25, the recruitment of MUs might be shaped by the muscle mechanical work26, the length of muscle fibers27 and the localization of muscle fibers belonging to single MUs28.
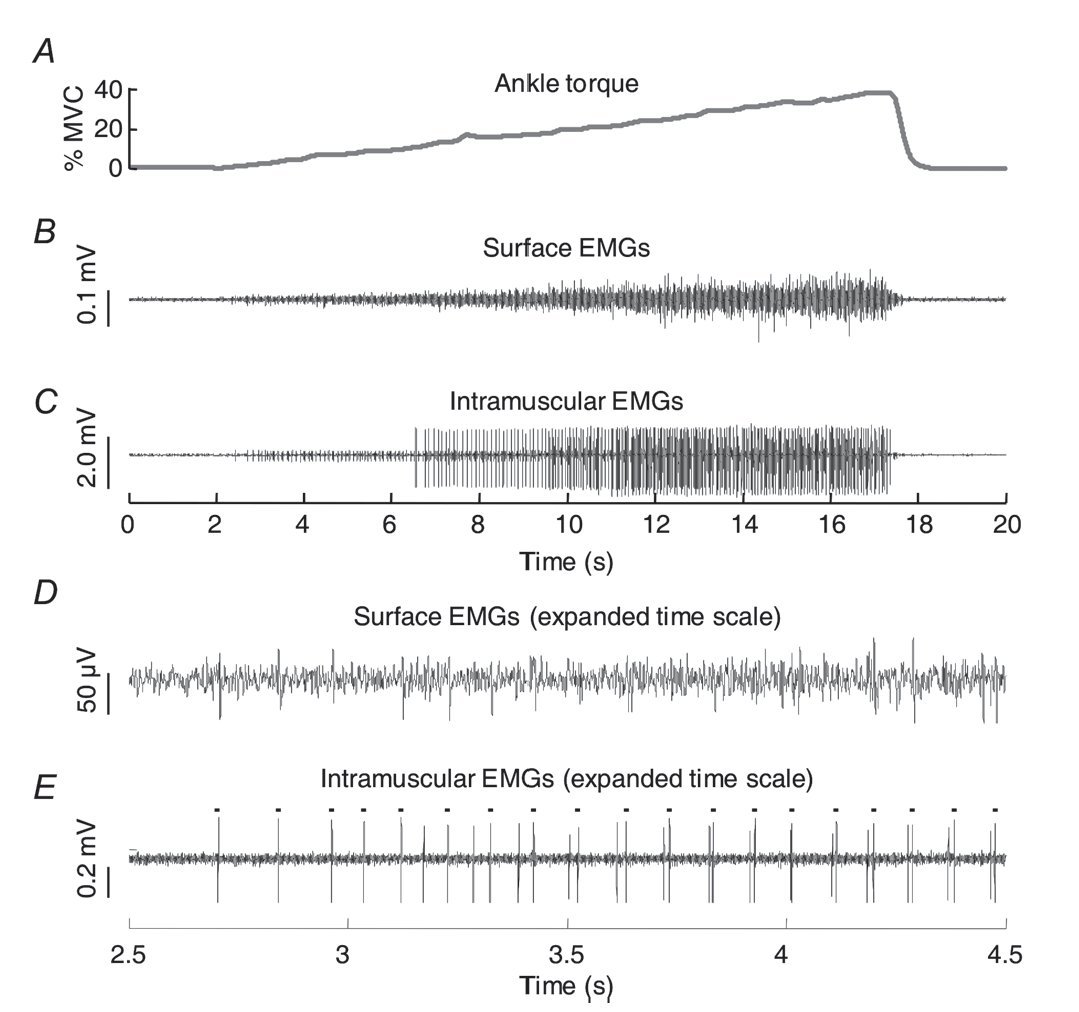
The extent to which individual MUAPs are observable in the surface EMG depends on how many MUs are active. Consider, for example, the force and EMG traces recorded from a subject who isometrically increased his plantar flexion force up to 40% of his maximal voluntary contraction (MVC). Ankle torque increased (fig. 1A) with the amplitude of both surface and intramuscular EMGs (figs. 1B, C), after some milliseconds delay (for example due to the electromechanical delay29).

Fig. 1. Electromyograms and motor unit action potentials. A) shows the plantar flexion torque during a isometric ramp contraction, from 0 to 40% MVC. Surface and intramuscular EMGs recorded from the medial gastrocnemius muscle are shown in B) and C) respectively. Short epoche of these signals are shown in D) and E). Note the correspondence between the intramuscular and the surface action potentials of the firstly recruited motor unit (dots in E denote its discharge instant).
Spikes in the intramuscular EMG correspond to individual MUAPs. It is clear, then, that MUs were recruited throughout the contraction, starting from the smallest unit (small spikes in fig. 1C). Conversely, MUAPs are not equally evident in the surface EMG (fig. 1B). As surface electrodes are less selective than intramuscular electrodes30, the surface EMG conveys many action potentials from a population of MUs. This summation of MUAPs is aggravated by the fact that the nervous system regulates muscle force incessantly, using suitable interactions between MU recruitment and firing rate31-33. At low contraction levels, however, single MUAPs might be visible in the interference surface EMG (figs. 1D,E). Therefore, depending on whether EMGs are collected with intramuscular or surface pairs of electrodes, and on the intensity of muscle contraction, different views of MUAPs are obtained.
In summary, the information extracted from the surface EMG give global and, rarely, individual indications of MUs activity. In the next two sections, we synthesize the methodological aspects and describe the physiological information obtained when the conventional bipolar electrodes are used to record surface EMGs. Section before last one focus on the description of new insights gained into the acquisition and interpretation of surface EMGs with the use of arrays of electrodes.
Methodological issues in the acquisition of surface electromyogram
Similarly to other biological signals, the surface EMG demands a checklist of what should be done concerning its acquisition and processing. Despite the availability of sophisticated systems for EMG acquisition and of easy-to-use software for the processing of EMGs, misleading conclusions may be drawn by non-expert users. Being familiar with methodological issues regarding the use of surface electromyography is, therefore, a sine qua non condition.
Electrodes material, size, montage and positioning
There is an assortment of detection systems for the recording of surface EMGs, developed with different materials, dimensions and configurations of detection30.
Surface electrodes are usually made of silver/silver chloride (Ag/ AgCl), silver chloride (AgCl), silver (Ag) or gold (Au). Electrodes made of Ag/AgCl are often preferred over the others, as they are almost nonpolarizable electrodes, which mean that the electrode-skin impedance is a resistance and not a capacitance. Therefore, the surface potential is less sensitive to relative movements between the electrode surface and the skin34. Additionally, these electrodes provide a highly stable interface with the skin when electrolyte solution (for example gel) is interposed between the skin and the electrode. Such a stable electrode-skin interface ensures high signal to noise ratios (for example the amplitude of EMGs exceeds fairly the noise amplitude), reduces the power line interference in bipolar derivations (50 Hz or 60 Hz frequencies and their harmonics) and attenuates the artifacts due to body movements35.
Concerning the dimension of surface electrodes, it varies in size from some millimeters to a few centimeters in diameter or length, depending on whether electrodes are circular or rectangular. Considering a single surface electrode as a series of point electrodes dispersed across its contact area on the skin, the potential detected is the average potential recorded by each of these point electrodes. For this reason, the larger an electrode is the more information is lost from the detected surface EMG36,37. The size of electrodes relates also to the size of the muscle. Small electrodes (∼2 mm diameter) allow for the positioning of numerous electrodes on the same muscle, which might be useful for the study of specific muscle features not detectable with a single pair of electrodes38,39. To obtain representative EMGs of the activity of large muscles, as the triceps surae, electrodes with larger detection surfaces are sought (∼1cm diameter or larger) 28,40. Then, the decision of using small or big electrodes, with short or large interelectrode distances, must conform to the aim of each study, to the size of the muscle investigated and to the spatial resolution we wish to achieve.
The electrodes montage is another important issue for the detection of surface EMGs. Usually, EMGs are acquired in either monopolar or bipolar configuration. Monopolar EMGs correspond to the electrical potential detected on the surface of the skin, immediately above the muscle tissue, with respect to that measured with a reference electrode located at bony regions on the skin41 (fig. 2; block 1 in fig. 3). While the monopolar derivation assures the recording of the actual surface potentials, it might also record interferences from outside sources (for example power line) or the activity of sources (for example distant muscles) other than the muscle investigated. The latter phenomenon, known as crosstalk, is likely reduced with the use of bipolar montages. The amplitude of MUAPs generated in distant muscles, or by deep MUs in the muscle studied, distributes evenly across the skin surface, where electrodes are located42,43. Consequently, these potentials appear with the same amplitude in the monopolar EMG. Given that a bipolar EMG (also referred as single differential EMG) results from the difference between two monopolar EMGs (fig. 2 right panel), the common-mode voltage embedded in both signals, due to crosstalk, to the activity of deep MUs, to power line interference or to any other interfering source, appear with very similar amplitudes on both electrodes and, then, is fairly attenuated in the differentiated signal. The degree of cancellation of the common-mode depends on the common mode rejection rate (CMRR), which is a characteristic of differential amplifiers, and on the unbalance in the electrode-skin impedances between the two recording sites (see Merletti et al15 for further details on the common-mode cancellation). While bipolar recordings are less sensitive to interference and cross-talk, they reduce the «detection volume» and attenuate the contribution of deep MUs to the surface EMGs.
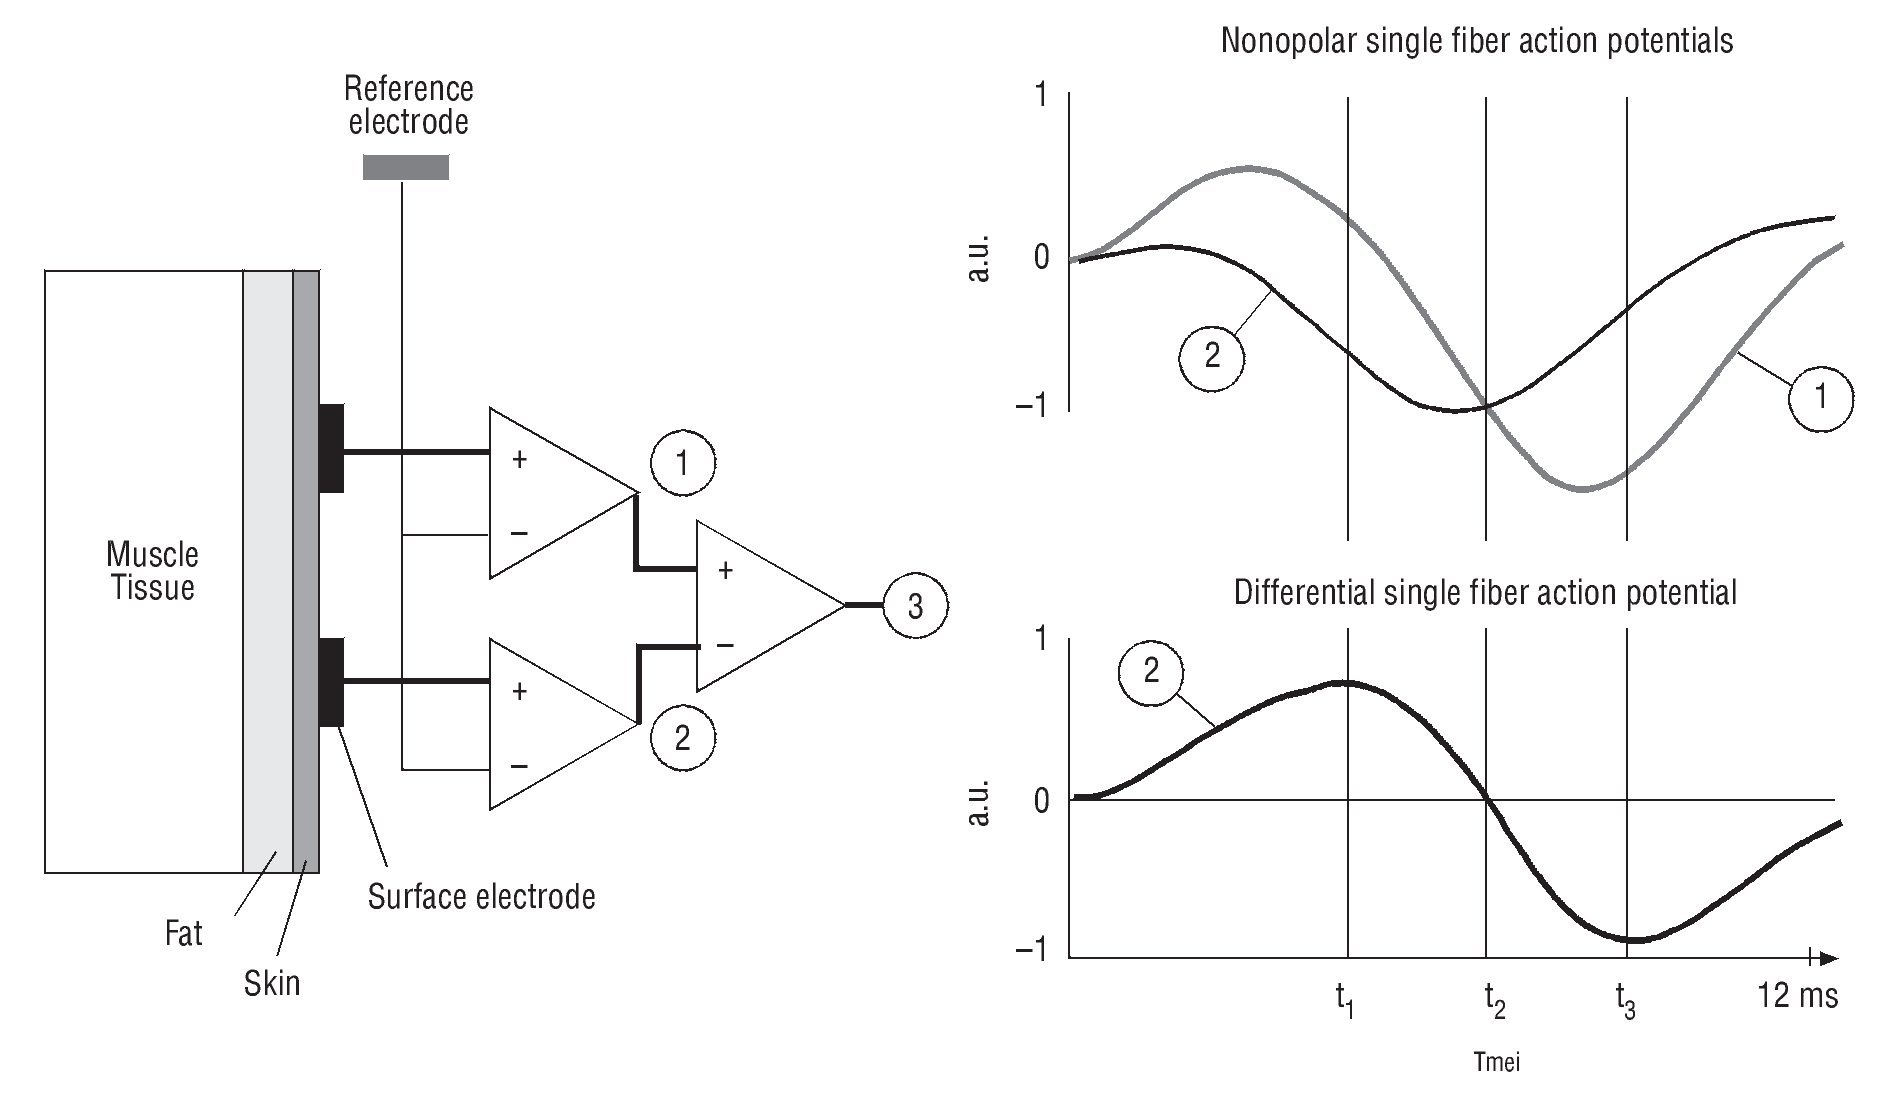
Fig. 2. Conventional electrode montages. A schematic representation of the positioning of surface electrodes is shown, including the detected surface EMGs. Two electrodes are positioned at skin locations immediately above the muscle tissue, whereas a reference electrode is located close to bony regions on the skin. The monopolar EMGs detected with the couple of surface electrodes are shown on the top right. Each of these EMGs (traces 1 and 2) corresponds to the difference between the electrical potentials detected by each surface electrode and that detected by the reference electrode (presumably zero). The usual bipolar EMG (trace 3) is obtained by further differentiating the two monopolar EMGs. For clarity, dashed vertical lines indicate instants when the difference between traces 1 and 2 is maximal, zero and minimal (t1, t2 and t3, respectively). Monopolar EMGs shown in the right panel are examples of single fiber action potentials simulated as described in Vieira et al91.

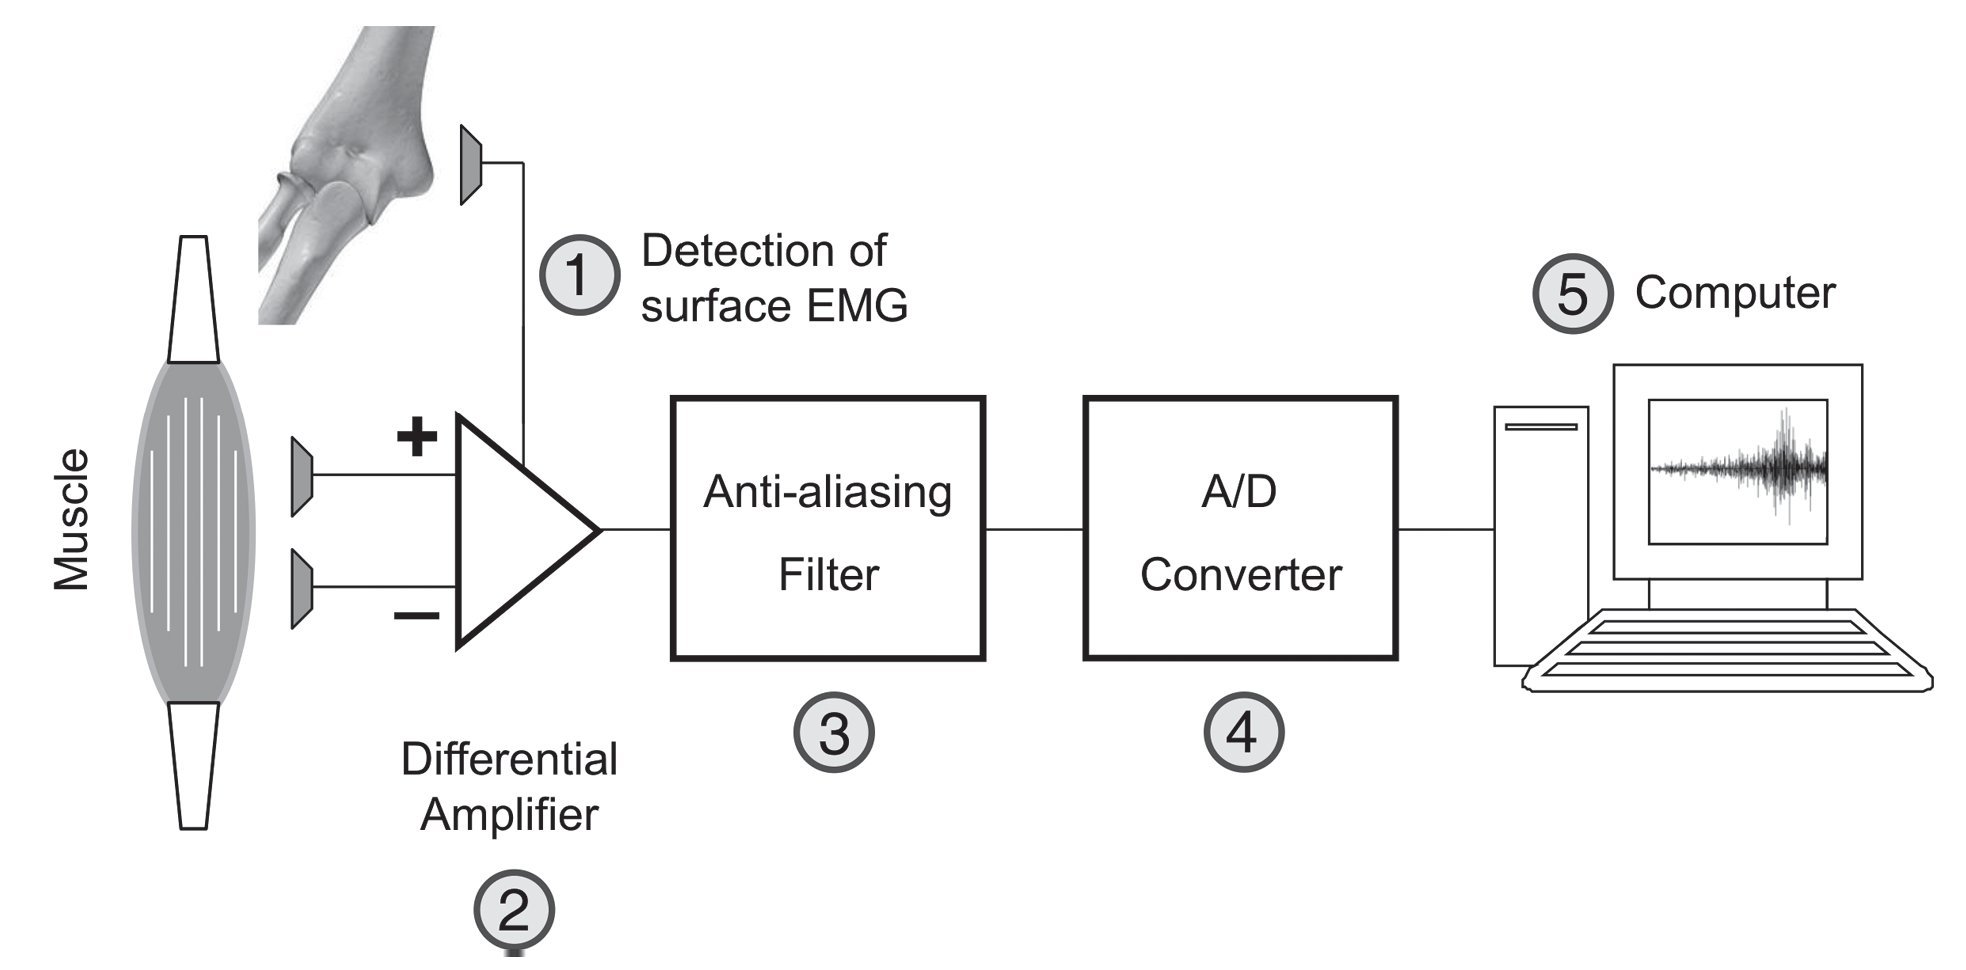
Fig. 3. Simplified block diagram of surface electromyogram acquisition. Block diagram showing each of the main steps regarding the acquisition of surface electro-myograms: (1) the detection of myoelectric potentials with surface electrodes and a reference electrode, schematically illustrated on the medial epicondyle of the humerus; (2) the amplification of such potentials with differential amplifiers; (3) analog filtering of the amplified potentials to avoid aliasing and, finally; (4) the sampling of the surface electromyogram into digital voltage values to be stored on a computer (5).
The fact that common-mode signals are cancelled in the differential EMGs has implications for the positioning of surface electrodes. Consider, for example, two surface electrodes located symmetrically at both sides of the innervations zone (IZ), which is the mean location of neuromuscular junctions, and parallel to the muscle fibers. As the action potentials propagate in opposite direction from the IZ, each surface electrode would record the same monopolar potential at the same time. Thus, contributions from this MU would not appear in the differential EMG. It is not surprising that several studies suggest the location of bipolar detection systems to be somewhere between the IZ and the tendon regions44-48. This recommendation prompts from the use of high-density detection systems and regards muscles whose fibers are coplanar to the skin. Defining recommendations for the appropriate positioning of surface electrodes on muscles with pinnate architecture, however, is not straightforward28. Although guidelines for the positioning of surface electrodes were proposed in the SENIAM project49, the use of high-density systems further illuminated this issue. In section High-density surface electromyogram will further discuss the issues related to the positioning of surface electrodes, the propagation of action potentials and the orientation of muscle fibers.
Skin preparation
Cleansing of the skin is useful to provide EMG recordings with low noise levels. Appropriate preparation of the skin assures the removal of body hair, oils and flaky skin layers and, consequently, reduces the impedance in the electrode-gel-skin interface. Shaving, wetting and rubbing with alcohol, acetone or ether, are often considered for the cleansing of the skin. Different methods for the preparation of the skin give different results15. Bottin and Rebecchi50 showed that the use of abrasive solution seems to work better than alcohol, both for reducing electrode-skin impedance and for minimizing allergic responses. Some authors are still working on the improvement of electrode-skin contact, as it is imperative on determining surface EMGs of high quality. Nevertheless, preliminary results show that rather than, or in addition to abrasion, wetting the clean skin with water seems to be the most effective factor to reduce the electrode-skin impedance15.
Basic properties of systems for surface electromyogram acquisition
The myoelectric activity appears on the surface of the skin as electric potentials with limited bandwidth, from 15 to 400 Hz, and with very small amplitude, from some micro- to a few milli- Volts peak-to-peak, depending on the intensity of muscle contraction. Very sensitive instruments are then required for the detection, amplification, conditioning and digitization of surface EMGs, according to the simplified block diagram shown in figure 3. In addition to these blocks, other stages are involved in the acquisition of surface EMGs. Sample-and-hold circuits as well as multiplexers, for example, often precede the amplification stage in sophisticated electromyographic systems. Rather than focusing on detailed electronics, here, we briefly describe basic aspects concerning the instrumentation sought for surface EMG recording. The interested reader will find an exhaustive description of circuitries in the recent review published by Merletti et al15.
Differential amplifiers multiply the difference between two voltage signals by a constant value, the amplifier gain, and are a crucial stage in acquisition systems for surface EMG. Amplification (block 2; fig. 3) is important for the amplitude of the detected EMGs to match the dynamic range of the A/D converter (block 4). Usually, the dynamic range of A/D converter in electromyographic systems varies from ± 2.5 V to ± 10 V. For this reason, the small surface EMGs must be amplified before their digitization, otherwise the digitized signal does not comprise the actual fluctuations in EMG amplitude resulting from the activity of MUs. As a general indication, amplifiers for surface EMG recording should have high input impedance (> MΩ), to minimize eventual power line interference introduced by unbalanced impedance in the electrode-skin interfaces, and high CMRR, to ensure the cancellation of common mode voltages detected by individual surface electrodes.
Any signal may be represented with a summation of sinusoids of different frequencies. The surface EMGs are composed of sinusoids from 15 Hz to 400 Hz. When analog signals are sampled at rates smaller than twice of their highest frequency (for example less than 800 samples/s for the surface EMGs), sinusoids with frequencies above this threshold are superimposed on the low frequency sinusoids. This phenomenon, known as aliasing, is suppressed with the use of low-pass analog filters (block 3 in fig. 3). Removing undesired components from the surface EMG is also possible after its digitization, with the use of digital filters. The power line interference, for example, might be attenuated with digital notch filters51 or with the spectral interpolation technique52. Similarly, the movement artifacts appearing at frequencies below 20 Hz can be removed from the surface EMGs with a high-pass filter. Usually, band-pass filters with cutoff frequencies set at 15 Hz and 400 Hz are recommended for the digital filtering of surface EMGs.
Another relevant issue for the acquisition of surface EMGs it the resolution of the A/D converter (block 4 in fig. 3), in particular for low level contractions. The higher the resolution the more voltage levels are used to digitize the amplitude of analog signals. The resolution of A/D converters is defined by dividing its dynamic range by its number of levels. The number of levels N is given by 2B = N, where B is the number of bits. For example, the smallest measurable amplitude by an A/D converter with 12 bits and ± 2.5V dynamic range is 1.22 mV (for example 5 V/212 levels). If EMGs are amplified with a gain of 1,000, the smallest detectable potentials would have peak-to-peak amplitude higher than 1.22 μV (for example 1.22 mV/1,000). Such a configuration likely suffice, for example, to study the activity of the gastrocnemius muscle during standing, as for this effortless condition the MUAPs appear on the surface EMGs with amplitudes not lower than a few dozens of microvolts53. By decreasing the amplifier gain or reducing the resolution of the A/D converter, the activity of small MUs might not contribute correctly to the digitized surface EMG because they appear as staircases with flex steps.
Extracting physiological information from surface electromyogram
The estimation of individual or global muscle force and the identification of muscles contributing to specific motor tasks, or responding to stretching stimuli, are some examples of applications for the surface electromyography54-59. As the control of muscle force demands modulation in the number as well as in the firing rate of active MUs, and given that the surface distribution of the myoelectric activity results from the summation of MUAPs (see section The myoelectric activity), variations in muscle force and in the amplitude of the compound interferential EMG are orthodoxical. The higher the target force, the more MUAPs are summed and, thus, the higher the amplitude of EMGs detected on the skin surface. Although variations in the amplitude of EMGs and muscle force are not simultaneous, due to the inherent delay between the generation of MUAPs and the muscle contraction (also termed electromechanical delay29), amplitude indexes of surface EMGs reflect the actual degree of muscle activation.
While the amplitude indexes of surface EMGs gives indication regarding the intensity of muscle contractions, changes in the shape or width of MUAPs might be investigated with the frequency analysis of surface EMGs. During sustained voluntary contractions, for example, the MUAPs propagate at progressively slower speeds6. Similarly, the surface potentials measured during electrically elicited contractions, also termed M-waves, show decreased conduction velocity for prolonged periods of stimulation60,61. M-waves detected from the biceps brachii muscle with a couple of surface electrodes are shown in figure 4A, for five different instants throughout the 25 s of stimulation. The bipolar pulses of stimulation were delivered at 16 Hz and had supra-maximal amplitude (for example the amplitude of each pulse was higher than the value providing the highest detectable M-wave). Because of the slowing of M-waves with fatigue, the surface potential detected toward the end of the stimulation protocol had markedly longer duration than that recorded at the beginning (compare the thickest and the thinnest traces in 4A). It is clear, then, that the frequency content of surface EMGs relates to the conduction velocity of MUAPs. Since the estimation of conduction velocity requires the appropriate positioning of at least two couples of bipolar electrodes along the muscle fibers48 (see section High density surface electromyogram), the frequency analysis might be useful for the estimation of myoelectric manifestations of muscle fatigue from single bipolar EMGs.
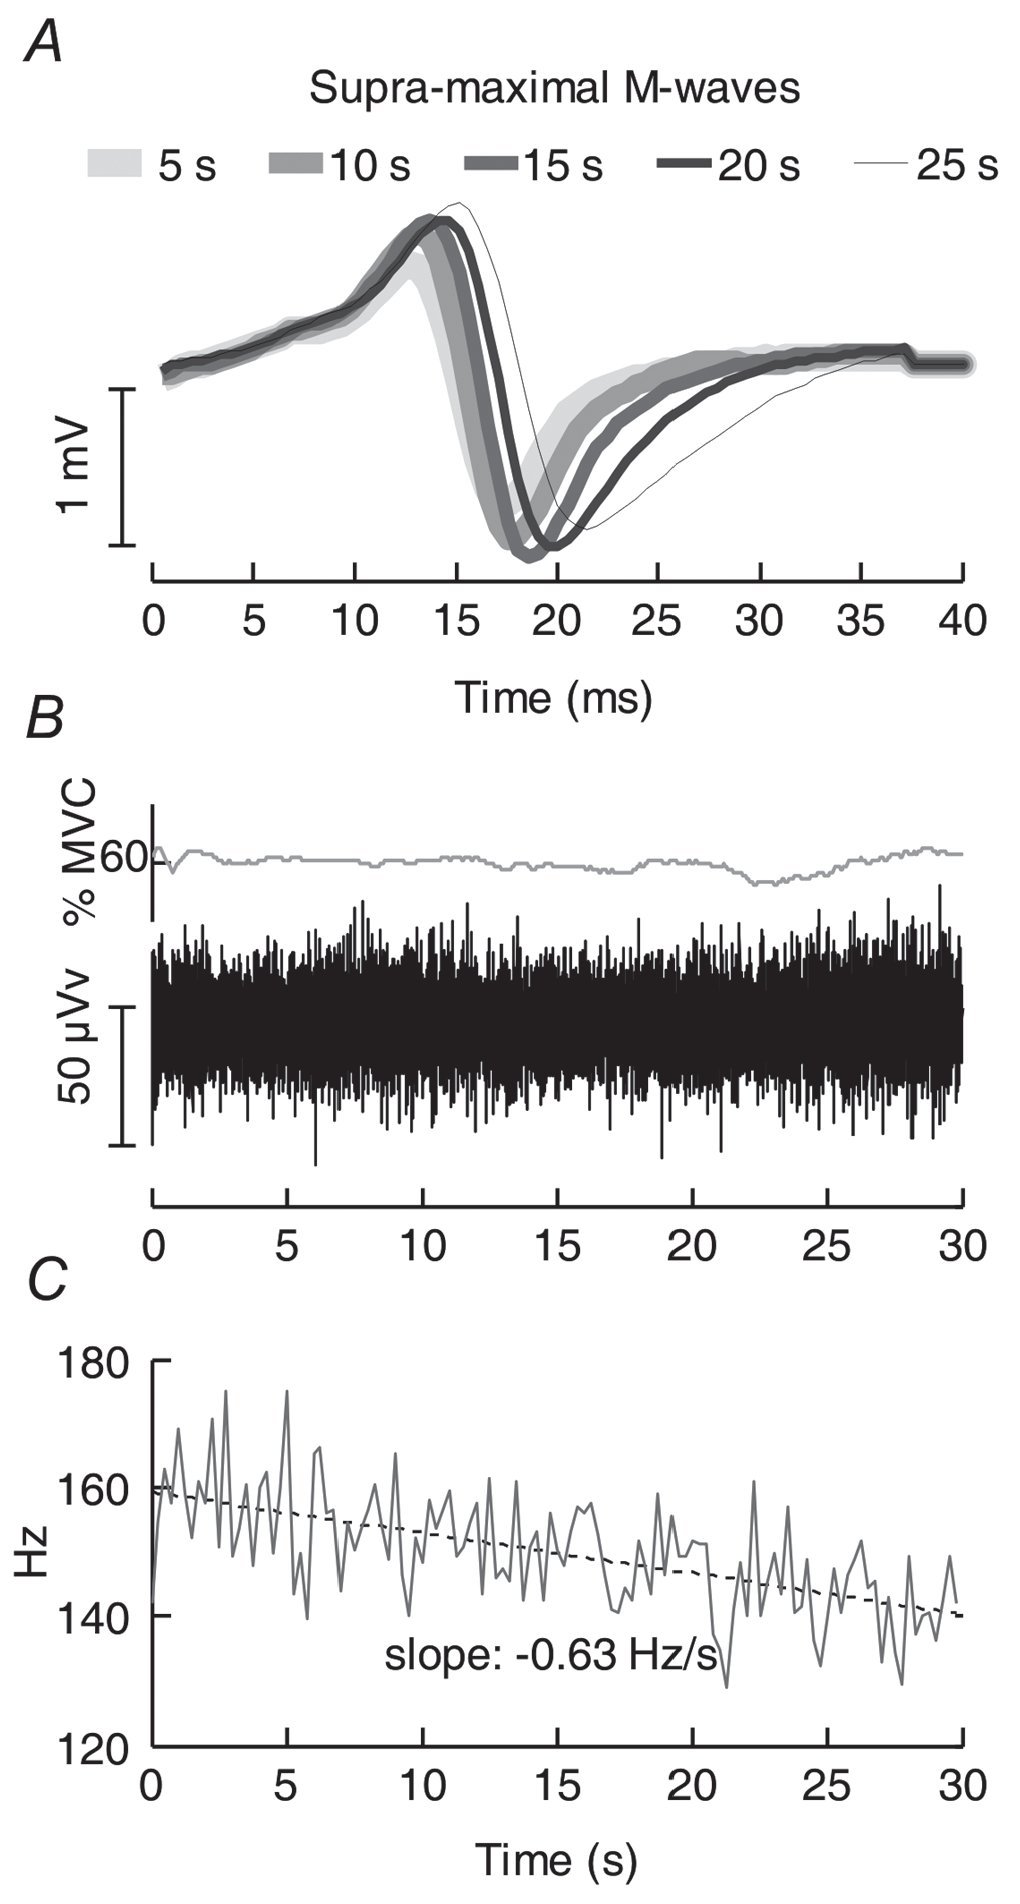
Fig. 4. Myoelectric manifestations of muscle fatigue. A) illustrates the M-waves detected from the biceps brachii muscle at five different instants. From the beginning (5 s) to the end of stimulation (25 s), M-waves are represented with progressively thinner and darker traces. B) shows the ankle torque and the surface EMG from the MG muscle during 30 s of isometric plantar flexion at 60% MVC. C) The mean frequency of the surface EMG, computed for epochs of 250 ms, reduced from ∼160 Hz to ∼141 Hz throughout the sustained isometric contraction.
Amplitude descriptors of surface electromyograms
Different indexes might be used to estimate the amplitude of surface EMGs. One could simply consider the difference between the smallest and highest amplitude values (for example the peak-to-peak amplitude) as an indication of how large the recorded EMG is. However, given that the instantaneous amplitude of surface EMGs depends on several factors, as for example the summation of MUAPs with different shapes, the peak-to-peak amplitude is not a robust descriptor. Common amplitude descriptors consist on the averaging of rectified or squared samples of the raw surface EMG across the duration of a motor task. These descriptors are known as the averaged rectified value (ARV) and the root mean square (RMS) amplitude and are defined as:
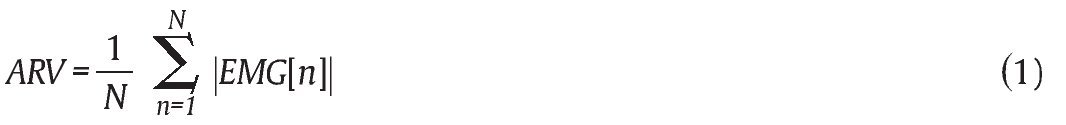
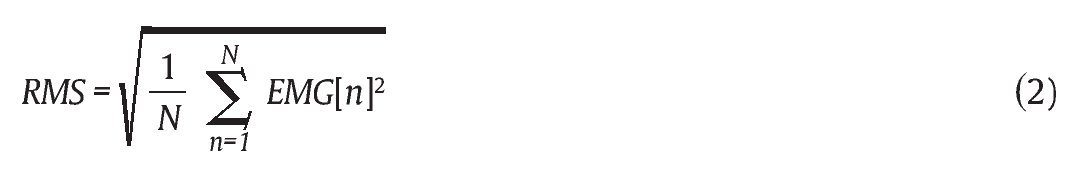
where N stands for the number of samples to be averaged.
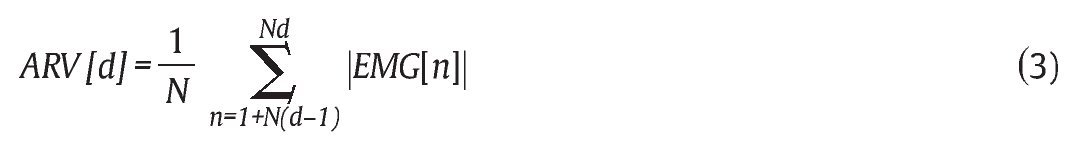
From these equations it is clear that only one amplitude value, estimated either with the ARV or RMS descriptor, is obtained from N samples of the surface EMG. Frequently, the investigation of temporal variations in the amplitude of surface EMGs is useful (for example for the estimation of muscle force from the myoelectric activity) 57,62. In this case, the amplitude of EMGs is estimated across short epochs, usually lasting 250 ms or 500 ms, throughout the whole recording duration. Equations 1 and 2 are thus rewritten as:

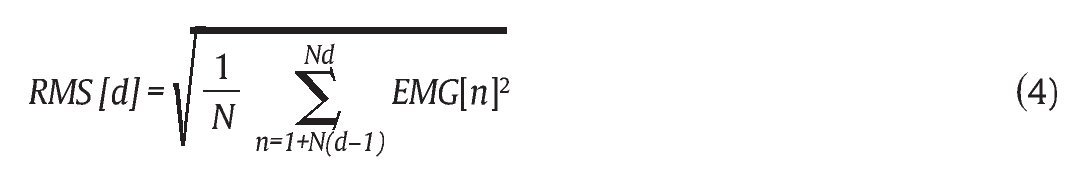
where d corresponds to the epoch over which ARV or RMS amplitude is computed.
Although both descriptors succeed in tracking the variations in EMG amplitude, they provide slightly different results. Because of the square operator, the RMS descriptor weights EMG samples differently. Samples with small amplitude are attenuated, while samples with high EMG amplitude are emphasized. For this reason, when the RMS descriptor is used, periods of high myoelectric activity are more evident with respect to periods of low activity. On the other hand, temporal variations in the amplitude of surface EMGs, estimated with the ARV descriptors, relate directly to the degree of myoelectric activity. Despite the dissimilar weighting of EMGs samples, the RMS might be preferred over the ARV descriptor, as it posits a physical meaning (for example the RMS descriptor measures the power of EMGs, whereas ARV measures the area under the signal).
For the interested reader, more sophisticated approaches might be used for the estimation of surface EMG amplitude, based either on the using of whitening filters before the estimation of RMS or ARV amplitude63 or on the integration of rectified EMGs64.
Spectral descriptors of surface electromyograms
In a very simple view, the application of frequency analysis to the surface EMGs allows for the verification of how fast the myolectric activity changes. As mentioned in section Electrodes material, size, montage and positioning, from a mathematica stand point the surface EMGs are composed of sinusoids with frequencies ranging from 15 Hz to 400 Hz. The relative contribution of each of these sinusoids to the compound EMG can be estimated with the use of specific algorithms. The power spectral density function describes the distribution of signal power across all the frequencies composing a stationary signal (for example it gives the signal spectrum; readers not familiar with the concept of frequency analysis might find useful information on)65,66. Therefore, any variation in the shape of MUAPs, due to changes in their conduction velocity (fig. 4A) or to any other factors, would be observed in the spectral representation of surface EMGs. As MUAPs propagate at slower speeds with muscle fatigue, the relative contribution of low frequencies to the surface EMG expectedly increases throughout a fatiguing contraction (figs. 4B,C). Spectral descriptors are, then, useful to capture variations in the distribution of power across the sinusoids compounding the surface EMG, especially during fatiguing motor tasks.
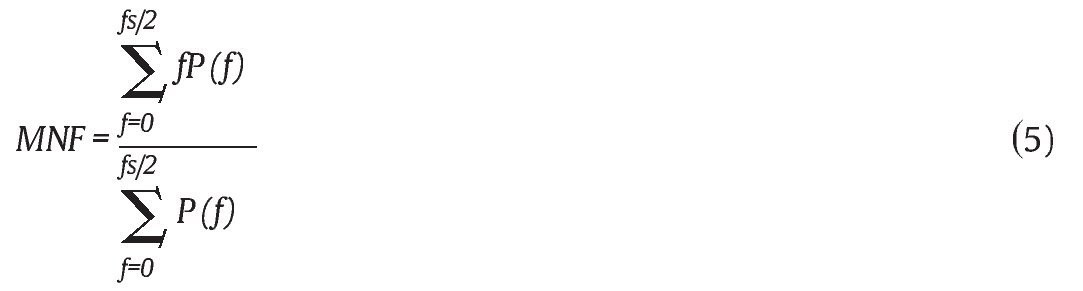
Mean frequency (MNF) and median frequency (MDF) are examples of spectral descriptors commonly used in surface electromyography6,67. These indexes are measures of central tendency and, then, indicate about which frequency the power of surface EMGs distributes. Once the power spectrum (P) of a surface EMG is estimated, its MNF can be calculated as:

where f corresponds to the frequencies represented in P, varying from 0 (for example mean or D.C value) to half of the frequency (fs) at which EMGs are sampled.
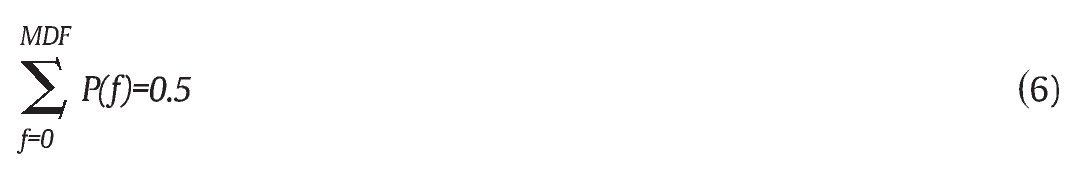
Conversely, the MDF separates the EMG power spectrum into two regions of equal power:

As for the amplitude descriptors, MNF and MDF might be calculated over short epochs, allowing for the temporal monitoring of variations in the frequency content of surface EMGs. Changes in MNF during a sustained plantar flexion contraction (60% MVC) are shown for a bipolar EMG recorded from the medial gastrocnemius muscle (fig. 4B,C). MNF was estimated for 250 ms epochs and the couple of surface electrodes was positioned on the distal region of the muscle, where gastrocnemius fibers are parallel to the skin surface28. Notwithstanding the constant plantar flexion torque and constant amplitude of the raw EMG (fig. 4B), the MNF decreased linearly (0.63 Hz/s) from the beginning of contraction (fig. 4C), indicating the myoelectric manifestation of MG fatigue.
All the concepts described so far pertain to the conventional bipolar EMG. With the use of high-density detection systems, much has been gained into the understanding of the neuromuscular system.
High-density surface electromyogram
Traditionally, a single pair of electrodes is used for the recording of surface EMGs from individual muscles. The possibility of sampling the myoelectric activity from different locations on the same muscle, however, is attracting progressively more clinicians, physical therapists and researchers. In this section, we describe which information might be gained when multiple surface electrodes, rather than the conventional bipolar configuration, are used for the detection of EMGs. Readers interested in the technical aspects of the high-density technique are invited to refer to key reviews published recently11,15,30.
The terminologies multi-channel and high-density have been used interchangeably to denote the sampling of myoelectric activity with several surface electrodes. On this respect, multi-channel is generic and, thus, confusing, as it possibly refers either to the sampling from the same or from different muscles. Henry et al58, for example, investigated the formation of postural synergies using multiple pairs of electrodes, each positioned on a different muscle in the lower limbs and in the trunk. These authors have, then, used a multi-channel system to record surface EMGs from different muscles. Conversely, to identify which muscle location provides surface recordings with highest quality, Sacco et al68 recorded multiple EMGs from individual muscles in the lower limb. In this case, a multi-channel system was used to sample from different regions of a single muscle. While high-density is less ambiguous, and preferred over multi-channel, when referring to the ability to record multiple EMGs from individual muscles, there are no indications concerning the number of electrodes for a detection system to be classified as high-density. Currently, high-density-surface-EMG (HD-sEMG) implies multiple electromyograms recorded from a single muscle with either mono- or bi-dimensional arrays of surface electrodes.
Systems for the detection of HDs-EMG show great diversity with respect to the size and the shape of the grid of electrodes, the material with which the grid is built, the distance between electrodes and the electrode-skin contact (dry or gelled). This assortment of attributes relies chiefly on the muscles from which EMGs shall be recorded. A small grid of closely spaced electrodes (from 2.5 to 5.0 mm interelectrode distance; IED) fits well for the acquisition of HDs-EMG from the tiny muscles of the hand and face. McNaught et al38, for example, used a grid of silver-pin electrodes (2.5 mm IED) to investigate the ability of subjects to control the recruitment and the rate coding of single motor units in the adductor pollicis muscle. Lapatki et al39 studied the activity of individual motor units in the facial musculature with a flexible, bi-dimensional grid of 60 silver-coated electrodes (4 mm IED), mounted on a Polymid carrier. This matrix was fixed on the skin with double-sided adhesive foam and the electrode-skin contact was assured with a conductive cream. In contrast, mapping the myoelectric activity in muscles of greater dimension requires larger arrays of electrodes. The individual contribution of each of the calf muscles to the total plantar flexion torque has been assessed with a large matrix of 128 electrodes, either during isometric contractions or in quiet standing28,40. Depending on the muscle architecture, a particular detection system could be urged. To detect HD-sEMG from the external anal sphincter, a muscle with circular architecture, Merletti et al69 designed a circumferential array of 16 equally spaced electrodes, embedded on a cylindrical probe with 14 mm diameter. Rather than reflect a lack of needed standards, all the available grids of electrodes indicate how peculiar a muscle or a motor task might be.
What information can be obtained from the high-density-surface electromyogram?
At a first glimpse, looking at the surface EMGs acquired with a high-density system conjecture great redundancy. Figure 5 shows single differential EMGs recorded from the long head of the biceps brachii muscle with a linear array of 16 surface electrodes (10 mm IED), during 21 s of isometric contraction at 40% MVC. Inspection of figure 5 reveals remarkable similitude between signals. After the first second, the force of elbow flexion starts to increase (fig. 5A) and a somewhat increase in amplitude was observed similarly for some EMGs (fig. 5B). While the surface EMGs have small amplitude in some channels (from channel 1 to 5 and channel 15), other channels detected significantly higher myoelectric activity. Then, one could promptly argue that a couple of electrodes, positioned somewhere in the vicinity of channels 6-14, would likely suffice to study the activation of the biceps brachii. It might, indeed, be the case if we are interested in knowing whether this muscle is active or not. However, other anatomical and physiological information can be extracted from the HD-sEMG.
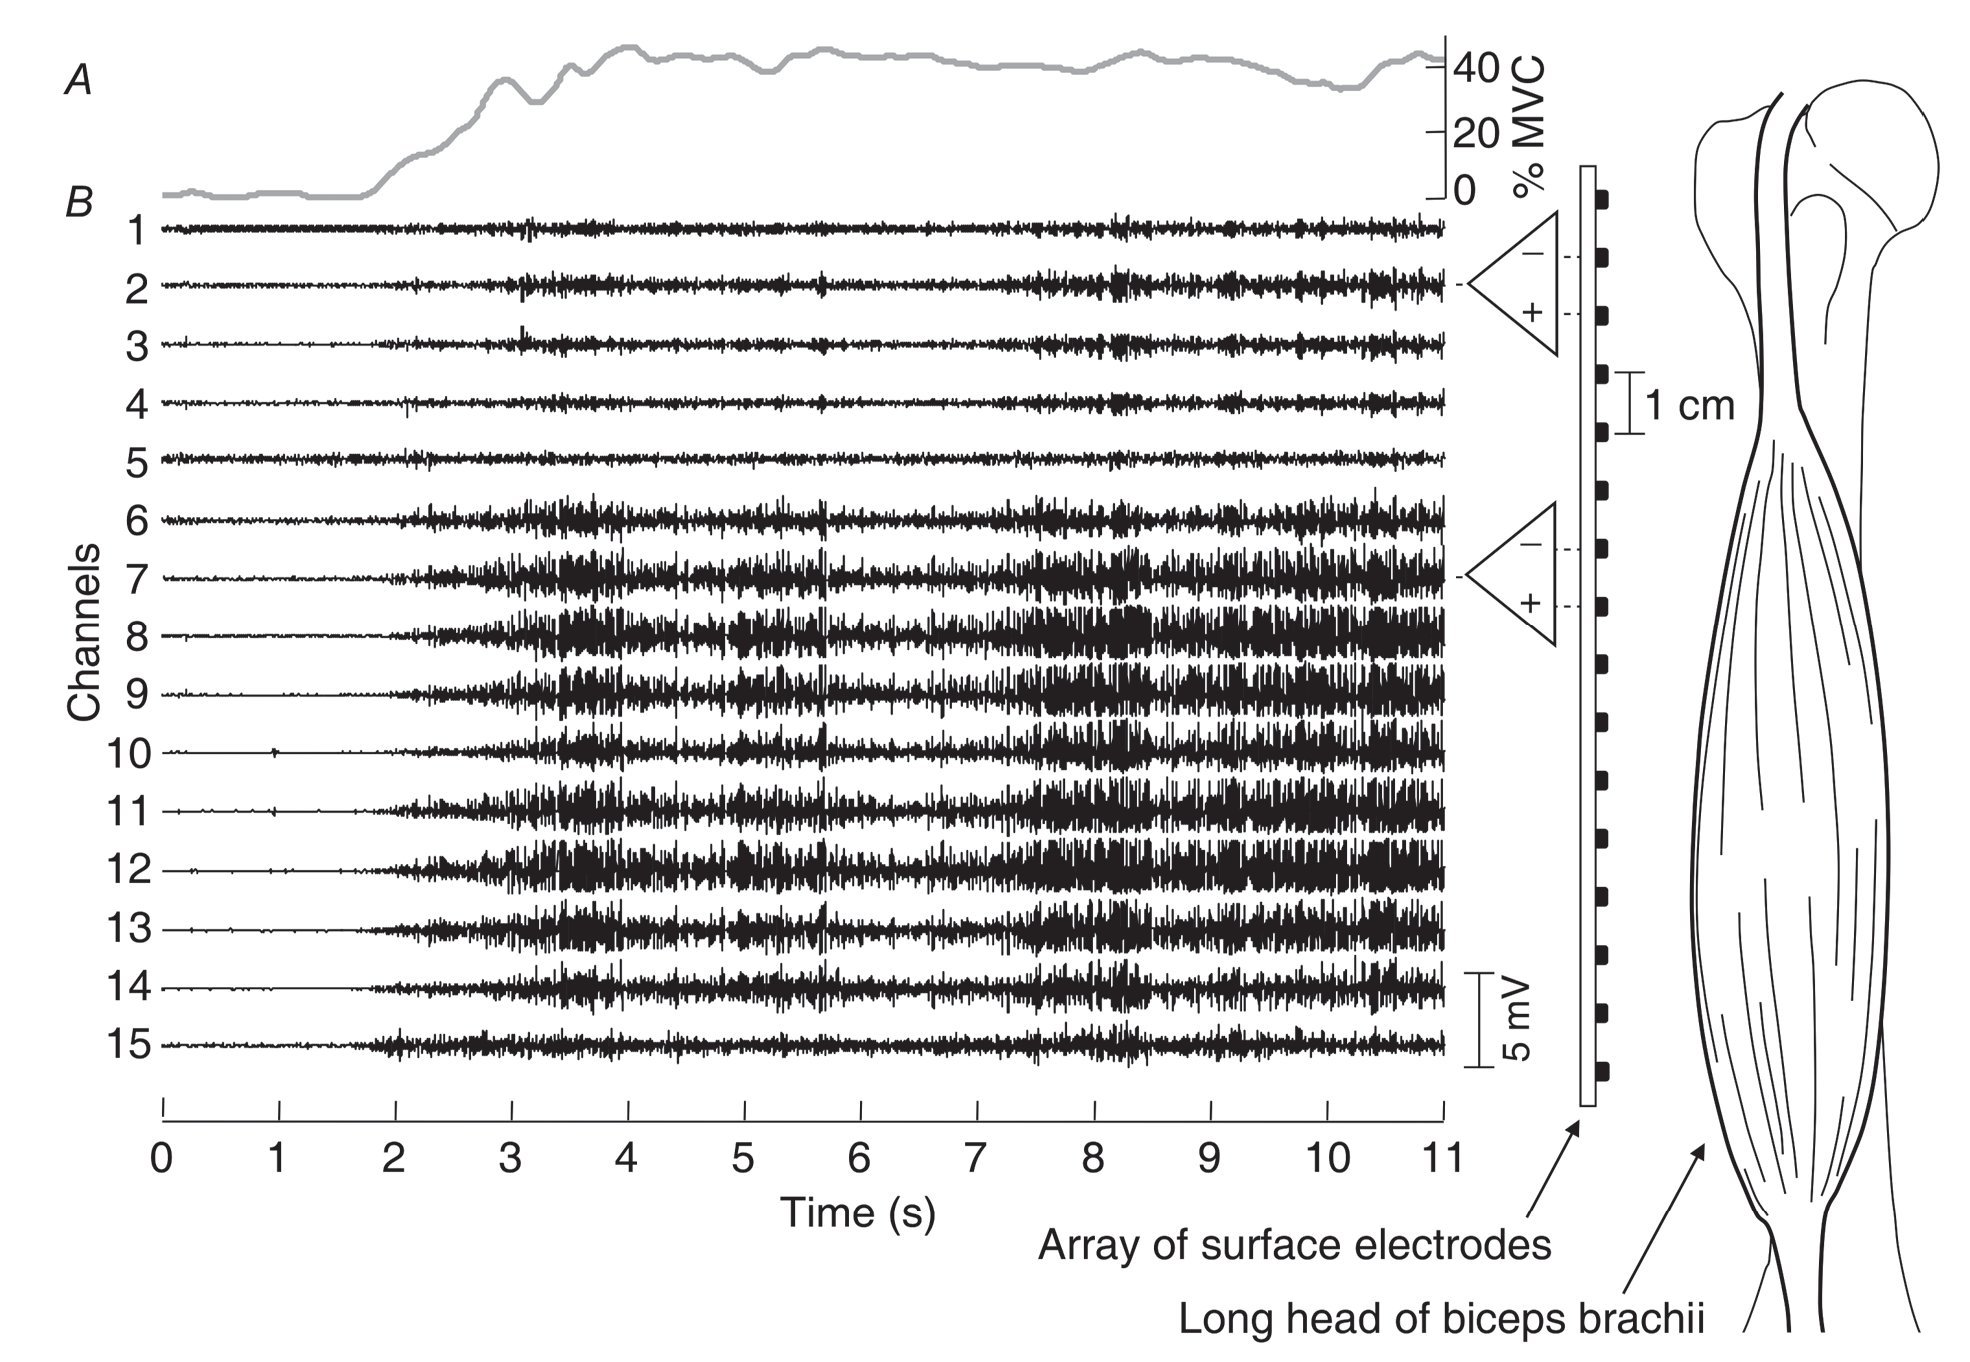
Fig. 5. Extracting information from high-density-surface electromyogram. A) shows the profile of elbow flexion force. The 15 surface EMGs recorded from the biceps brachii muscle, are shown in panel B) wich includes a schematic representation of the position of the array of electrodes with respect to the muscle. For convenience, only the long head of the biceps brachii is shown. Note how much the amplitude of EMGs changes with the location of the channel (for example pair of electrodes) in which they where recorded.
When the surface EMGs are displayed in single differential derivation, the motor unit action potentials appear with very low amplitude at the location where they are generated. Once the depolarization of the membrane of muscle fibers exceeds some threshold (ca. -45 mV), action potentials are generated. Then, the depolarized regions propagate in opposite directions from the end-plate location, toward both the proximal and distal tendons. Considering that the single differential signals result from the difference between two monopolar EMGs detected by a couple of electrodes (fig. 2), the detected EMG would have almost zero amplitude if the end-plate location is halfway between consecutive surface electrodes44,45. Conversely, if the end-plate location coincides exactly with that of any electrode in the linear array, then, because of their propagation, the action potentials recorded in the channels on either side of the end-plate location appear with similar amplitude and opposed phase (fig. 6; the notion of propagating potentials will be further explained below). When the motor unit action potentials reach the tendon they are extinguished, originating a surface potential with far-field properties (for example the electrical potential distributes evenly across the skin surface; see figure 4 in Stegeman et al70). This phenomenon is also termed end-of-fiber effect71. As a result, different surface electrodes detect, at the same time, the same monopolar potential. In differential derivation, this common-mode signal is attenuated, leading to surface EMGs with small amplitude.
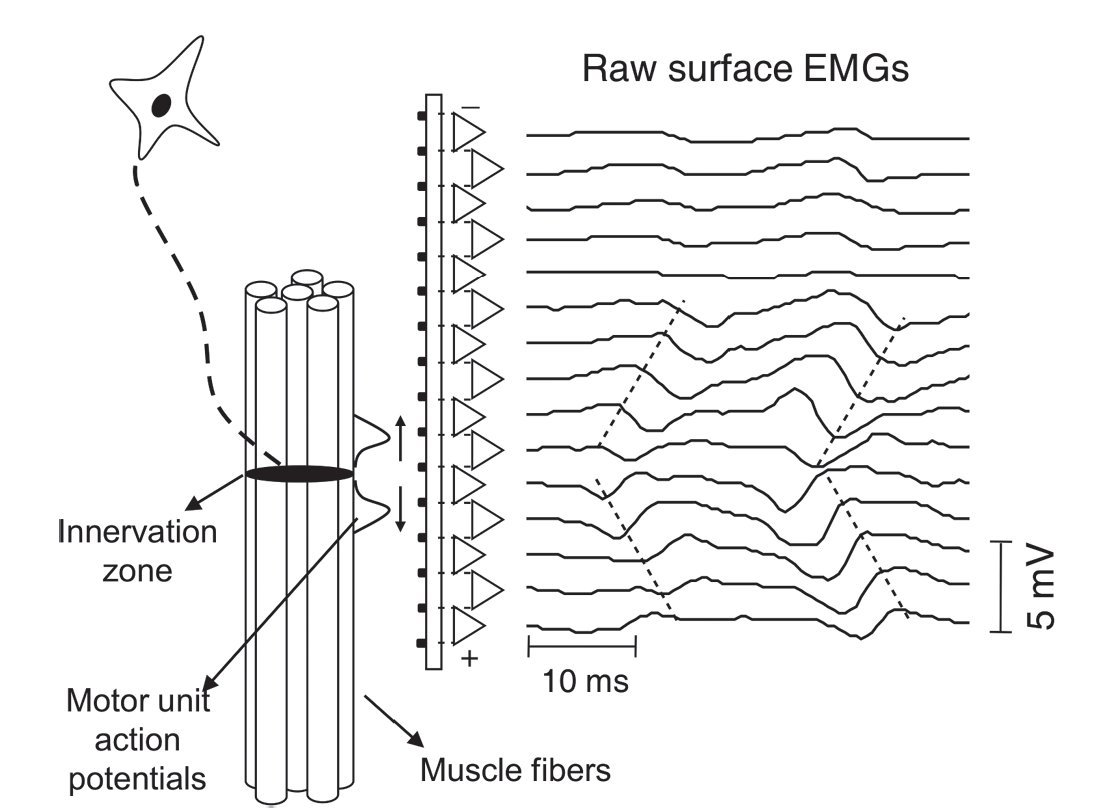
Fig. 6. Propagation of surface potentials in the high-density-surface electro-myogram. A short epoch (100 ms) of the surface EMGs depicted in figure 5B and the position of the array of electrodes with respect to a motor unit are shown. Action potentials are observed only from the channel 6 to 15. These potentials are first seen in channel 10 and 11, with opposite phases. A few mili-seconds later, because of the propagation of action potentials toward both tendon regions, the surface potentials appear in the adjacent channels. The delay between potentials recorded in different channels is better represented with inclined dotted lines.
Based on the amplitude of the myoelectric activity detected, the location of tendons and end-plates, as well as the length of muscle fibers, can be estimated from the HD-sEMG. For instance, the proximal and distal muscle-tendon interfaces seem to be localized, respectively, about the channel 5 and further distal from channel 15 of the array shown in figure 5. A rough estimation of the length of muscle fibers (longer than 100 mm) in the long head of the biceps brachii can be obtained multiplying the IED (10 mm) by the number of channels with EMGs of high amplitude (10 channels, at least; fig. 5B). Identifying the location of the end-plates, however, is less straightforward in this case. The tenth channel recorded an EMG with smaller amplitude than those in the adjacent channels. Notwithstanding its small amplitude, the EMG in the tenth channel comprised surface potentials with opposed phase when compared to the surface potentials in the channel 11 (fig. 6). Therefore, according to the arguments above, the neuromuscular junction is somewhere in between channels 10 and 11. It is also worth to mention that the location of end-plates does not concentrate on a single cross-section of skeletal muscles. Instead, it is dispersed slightly along the longitudinal axis of the muscle fibers72. For this reason, the term IZ (innervation zone) is preferred over end-plate location. In the case of figure 5, it can be observed that the IZ of motor units whose potentials were recorded with the array of electrodes, resides not more proximal than channel 10 neither more distal than channel 11. Knowing the position of the linear array of electrodes on the arm, the tendon regions and the IZ can be marked on the surface of the skin and compared with the location of anatomical landmarks. This procedure is usually considered for the appropriate positioning of surface electrodes48. In addition, identifying the actual location of IZs could be potentially useful for preventing the denervation of the external anal sphincter during episiotomy69 and for the treatment of spastic patients, through the guided injection of botulinum toxin73.
The conduction velocity of action potentials propagating along the muscle fibers can be estimated as well when a high-density system is used for the acquisition of surface EMGs. If an array of surface electrodes is positioned on the skin, parallel to the direction of the muscle fibers, then, each electrode would record a delayed version of the MUAPs. Figure 6 shows a short epoch of the surface EMGs depicted in figure 5. A surface potential appears firstly in the two channels closest to the IZ (see potential in channels 10 and 11 in fig. 6). The phase opposition observed for these potentials results from the fact that action potentials propagate in opposite directions from the IZ (for example in between channels 10 and 11). For the channels progressively more distant, the same surface potential emerges after a delay proportional to the distance between electrodes (see potentials in the channels 6-10 and channels 11-15 in fig. 6). The conduction velocity is, thus, the ratio between IED and the delay between surface EMGs recorded by successive electrodes or electrode pairs. Different techniques have been proposed to estimate the delay between EMGs in the domain of time74,75 and frequency76,77. For a detailed review on different methods for the estimation of conduction velocity from surface EMGs see Farina and Merletti78. One should bear in mind that the conduction velocity estimated from the surface EMGs reflects, but does not represent, the conduction velocity of individual motor unit action potentials. If the reader is interested in the estimation of the conduction velocity for individual motor units, either the spike-triggered averaging technique79 or the decomposition of the HD-sEMG80 should be considered.
Representativeness of muscle activation in the high-density-surfaceelectromyogram
Applications involving surface electromyography concern, in general, the investigation of whether skeletal muscles are active59,81, or the intensity with which they are active54,82 and of how many muscles are active (for example synergies)58,83 in a specific motor task. When a couple of surface electrodes is used for any of these purposes, it is presumed that the detected EMG represents the general muscle activity. If this is the case, the use of high-density systems would certainly provide «redundant» surface EMGs. The intensity and the timing of activation of the biceps brachii muscle, for example, are estimable equally well from the surface EMGs in any of the six channels, from channel 10 to 15, of the array of electrodes shown in figure 5. Nevertheless, when using either a set of bipolar surface electrodes or a high-density detection system, an uneven distribution of the eletromyographic activity has been observed for individual muscles in the lower limb28,40,81,84.
The extent to which the surface EMGs represent the neuromuscular activity depends on the position and orientation of the electrodes with respect to the muscle fibers. International recommendations for the positioning of surface electrodes suggest, usually, the muscle belly as the better location for the recording of high-quality EMGs49. Such an indication relies on an obsolete reasoning that from the muscle belly, where the muscle cross-sectional area is often the largest, the surface electrodes sample representative myoelectric activity. Figure 5 shows, and several studies report6,45,69 the surface EMGs to do not represent the actual activity of motor units when the detection system is located close to the IZ. In dynamic tasks, the positioning of electrodes is more critical. With variations in the joint angle, the location of both the muscle fibers and the IZ changes in relation to the position of the detection system5. In addition, depending on the orientation of surface electrodes and muscle fibers, the amplitude of EMGs differs dramatically. For a linear array of electrodes aligned perfectly parallel to the longitudinal axis of muscle fibers, all the channels in the array detect surface potentials with similar amplitude and with a different time delay (for example because of the propagation of action potentials). In the limiting case of perpendicular alignment between the detection system and the muscle fibers, the amplitude of single differential EMGs decreases substantially with the distance between the fibers supplied by the active motoneurons and the surface electrodes43,85,86. Therefore, only the surface electrodes close to the territory of the active motor units record significant myoelectric activity. While care is demanded for the positioning of a couple of surface electrodes on the skin, the use of high-density systems provides more representative EMGs.
Localized activation of skeletal muscles further aggravates the representation of myolectric activity in the surface EMGs. It has been shown that skeletal muscles are partitioned into functional subunits, the neuromuscular compartments55,87,88 (for a review see English et al89). Since individual compartments are supplied by distinct main nerve branches, the independent activation of a single compartment might be possible. Evidences supporting the localized activation of skeletal muscles in humans are growing28,40,55,81,84. Vieira et al28 used a large matrix of 128 surface electrodes (fig. 7A) to investigate if the medial and lateral gastrocnemius muscles are activated simultaneously for the stabilization of human quiet standing posture. One striking result of this study was the variable timing of modulations in the amplitude of EMGs recorded from the same gastrocnemius muscle. When subjects swayed forward, the amplitude of surface EMGs detected in different channels of a same column of the matrix of electrodes changed at different instants (see figs. 2, 5 and 9 in Vieira et al90). Interestingly, the delay between EMGs detected in consecutive channels was not congruent with that expected for the propagation of action potentials28. This variable timing was likely due to the sequential activation of motor unit during standing. For the subject whose data is shown in figure 7, it is clear that the medial gastrocnemius was predominantly activated during standing. The mapping of EMGs shows localized activation in this same muscle (compare regions with different colors in fig. 7A). Close inspection of the raw HDs-EMG detected from the medial gastrocnemius reveals, indeed, that action potentials of different motor units are recorded at specific sections along a same column of electrodes (fig. 7B). Then, representing the myoelectric activity of the pinnate gastrocnemius muscle with a couple of surface electrodes possibly masks the activation of different muscle regions.
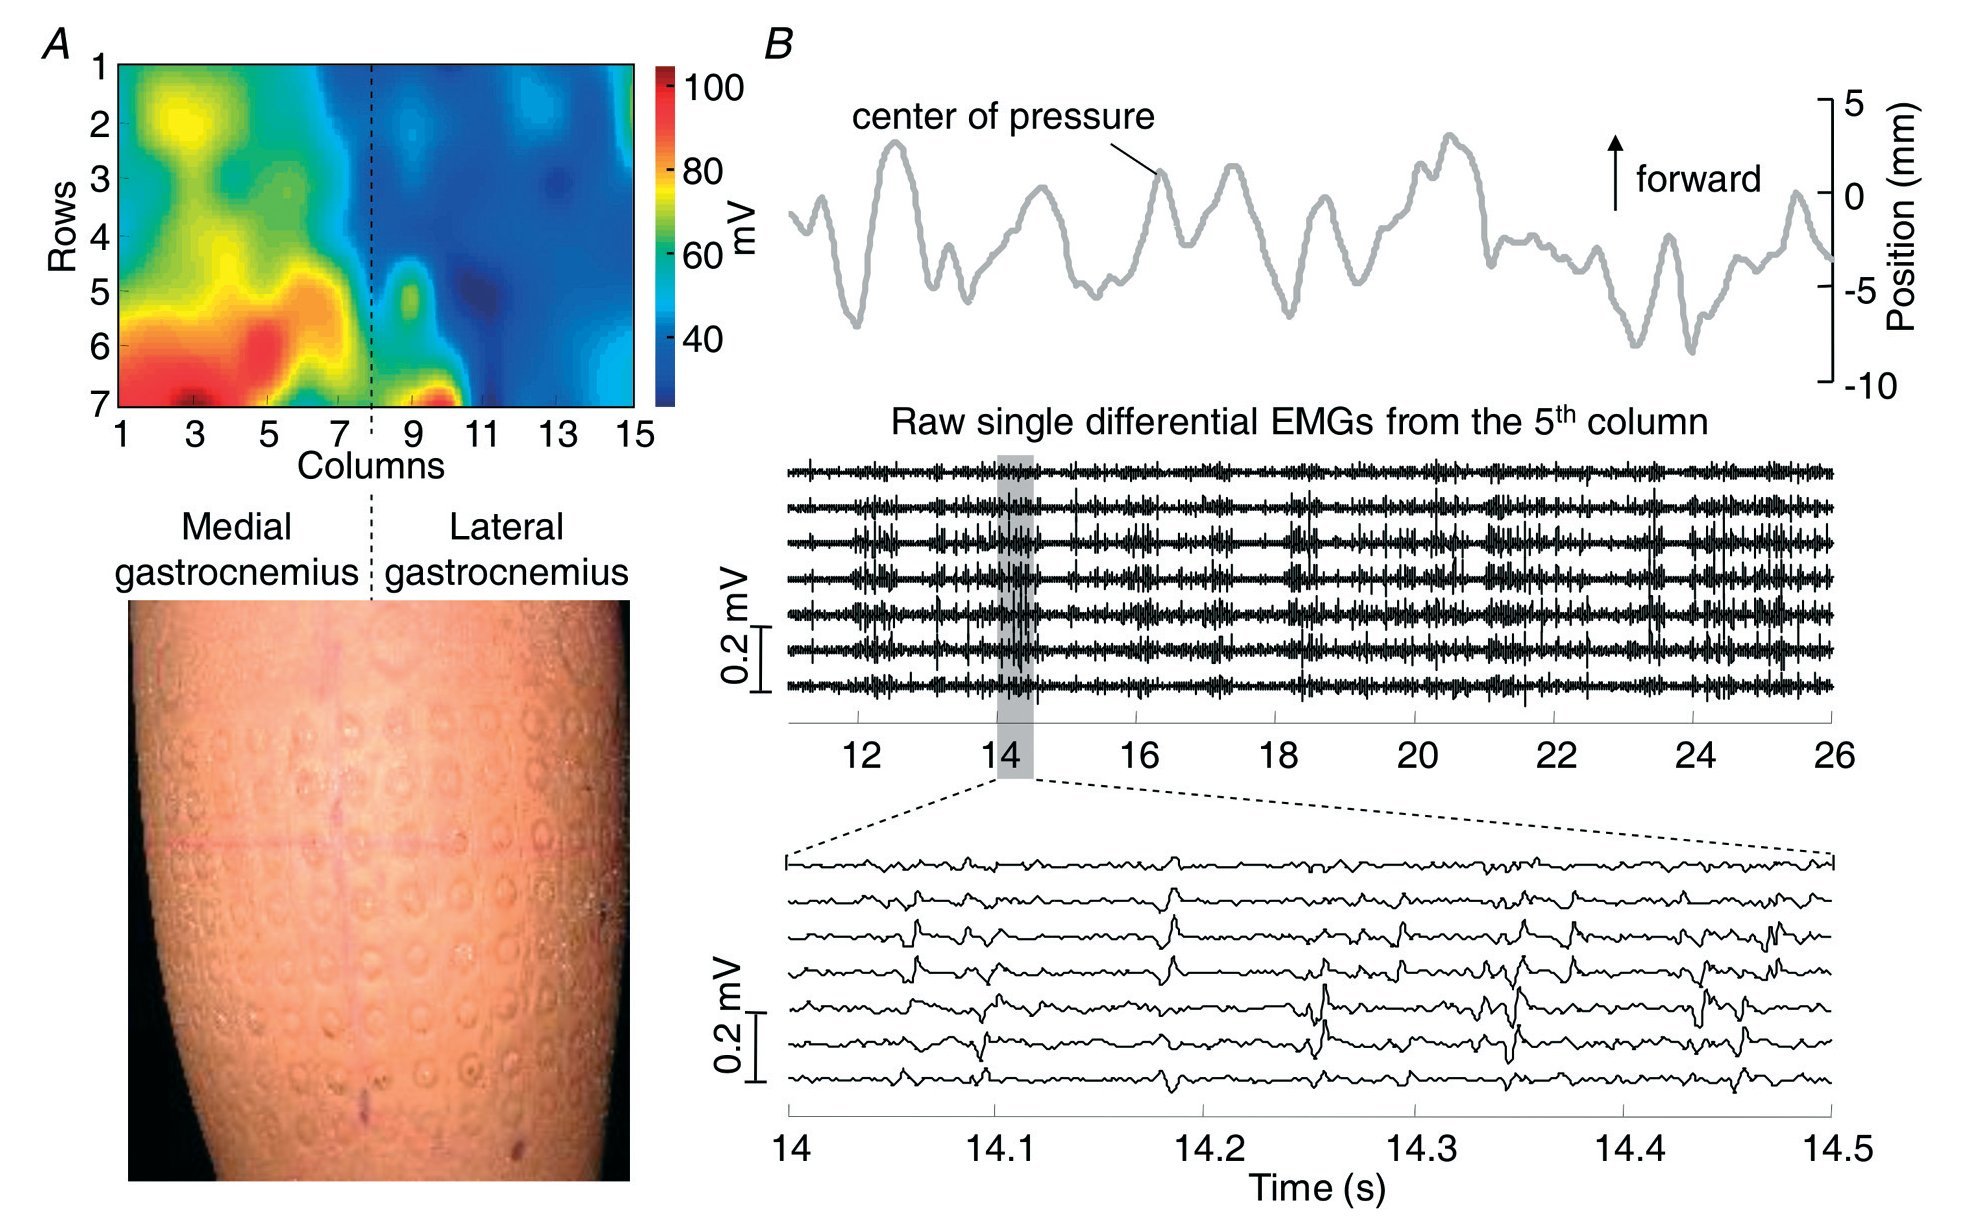
Fig. 7. Mapping electromyograms and localized myoelectric activity. A) shows an interpolated map of ARV amplitude for the surface EMGs recorded from the me-dial and lateral gastrocnemius muscle while the subject stood at ease for 40 s (top; see Vieira et al, 2010 for protocol details). A matrix of 128 eyelet electrodes was used. Prints of the eyelets are visible on the skin, once the matrix is removed (bottom). The junction between both gastrocnemius muscles coincided with the eighth column, as ensured by ultrasound scanning. B) depicts the potision of the body center of pressure (top), 15 s of the raw surface EMGs recorded in the fifth column of the matrix (middle) and a short epoch of these raw signals (bottom). Increased myoelectric activity matches the forward shifts in the center of pressure. Note, in the bottom panel, that action potentials of different motor units appear at different channels in the same column of electrodes.
With the joint use of high-density and intramuscular detection systems, insights have been gained into the interpretation of surface EMGs detected from pinnate muscles. Vieira et al81 triggered and averaged 15 single differential surface EMGs detected along the whole medial gastrocnemius muscle, using the firing pattern of individual motor units identified from the intramuscular EMGs. The surface representation of motor unit action potentials was confined to a small region on the surface of the skin81. This localized representation of motor unit action potentials indicates that, because of its pinnation, the surface EMGs recorded from the gastrocnemius are selective. For this reason, representing the general activation of the gastrocnemius muscles in the surface EMGs demands a high-density detection system. If such a system is not in hand, using a couple of fairly spaced surface electrodes (IED > 2 cm) would likely provide more representative EMGs than the use of closely spaced electrodes on the calf muscles. However, the user must be aware that increasing the distance between electrodes augments the likelihood to record myoelectric activity from other muscles (for example crosstalk)42.
Although the large array of surface electrodes is not yet as popular as the conventional bipolar electrodes, the relevance of HD-sEMG to the study of muscle activation becomes progressively more evident. Algorithms for the automatic identification of localized muscle activation, for example, are currently available40,91. Tracking muscle activation, automatically, could be helpful for the control of prosthetic devices, for the estimation of individual muscle force and net joint torques, as well as for the identification of muscle compartments. The use of high-density detection systems gave birth to numerous applications, once restricted by the inability of conventional systems to sample representative neuromuscular activity.
Conclusion
Advances in surface electromyography progress at an exponential rate. The conventional bipolar montage has been replaced, initially, by the linear array of electrodes and, then, by sophisticated bi-dimensional grids of electrodes. These mono- and bi-dimensional arrays are referred as high-density detection systems for the recording of surface EMGs. While the bipolar electrodes may suffice to monitor the activation of skeletal muscles and the onset of muscles activation, the high-density systems provide unique anatomical and physiological information. The location of innervations zones and tendon regions, the length of muscle fibers, the conduction velocity of individual motor unit action potentials, as well the global «average» conduction velocity, can all be estimated from high-density surface EMGs. In addition, matrixes of electrodes are useful to sample representative myoelectric activity from muscles with particular geometries and from muscles whose activation might be localized. With all the detection systems currently available, the reader might ask: Which detection system is appropriate for my application? The answer is clear but deserves reflection: It depends on the motor task the subjects have to perform, on the muscle under study and, chiefly, on the question you wish to answer.
Acknowledgements
T. Vieira wishes to acknowledge his doctoral scholarship provided by the Conselho Nacional de Pesquisa e Desenvolvimento Científico (CNPq). The authors thank Professor Roberto Merletti (LISiN) for his careful revision and substantial comments. The authors also thank Gabriela Patricia Díaz Ordóñez for helping with the translation of the abstract in Spanish.
Correspondence:
M.A. Cavalcanti Garcia
NEMoH - Departamento de Biociências da Atividade Física.
Escola de Educação Física e Desportos. Universidade Federal do Rio de Janeiro.
Avenida Carlos Chagas Filho, 540 - 2º andar.
Cidade Universitária, Ilha do Fundão.
Rio de Janeiro, Brazil.
CEP: 21941-599
E-mail:garcia@ufrj.br
History of the article:
Received September 10 2010.
Accepted October 9 2010.
