

Kidney transplantation is the best therapeutic option for patients with end-stage renal disease. The current availability of deceased donor organs is inadequate, which has led to consider living donors with high body mass index.
ObjectiveTo compare metabolic type variables, urinary protein excretion and kidney function at baseline and at follow up between donors with overweight or obesity and donors with normal body mass index.
Materials and methodsWe recorded clinical and biochemical variables at the time of donation and during the last follow-up.
Results68 donors were included, with a mean age of 46.4±13.5 years. The total population was divided into group 1 with body mass index ≥ 25kg/m2 and group 2 with body mass index <25kg/m2. The average follow-up was 115.2±84.1 months. Age, triglycerides, proteinuria and body mass index were significantly higher in group 1 at baseline. At follow-up uric acid, cholesterol, glucose, proteinuria and body mass index were significantly higher in group 1. Group 1 showed a significantly greater decline in renal function compared to the decline observed in group 2.
ConclusionDonors with higher body mass index showed higher values in metabolic variables before and after donation. Donors in group 1 had higher proteinuria and higher decline of renal function compared to donors with normal body mass index.
El trasplante renal es la mejor opción terapéutica para pacientes con enfermedad renal terminal; sin embargo, la disponibilidad actual de órganos de donador fallecido resulta insuficiente, lo que ha motivado aceptar donadores vivos con un índice de masa corporal elevado.
ObjetivoComparar variables de tipo metabólico, la excreción urinaria de proteínas y la función renal en el momento de la donación y durante el seguimiento, entre donadores con sobrepeso u obesidad y donadores con índice de masa corporal normal.
Material y métodosSe registraron variables clínicas y bioquímicas en el momento de la donación y durante la última consulta de seguimiento.
ResultadosSe incluyó a 68 donadores, con una edad promedio de 46,4±13,5 años. La población total se dividió en grupo 1, con índice de masa corporal ≥ 25kg/m2, y grupo 2, con índice de masa corporal<25kg/m2. El tiempo de seguimiento promedio fue de 115,2±84,1 meses. La edad, los triglicéridos, la proteinuria y el índice de masa corporal fueron significativamente mayores en el grupo 1 en el momento basal. Al final del seguimiento, el ácido úrico, el colesterol, la glucosa, la proteinuria y el índice de masa corporal fueron significativamente mayores en el grupo 1. El grupo 1 mostró una caída significativamente mayor de la función renal en comparación con el descenso observado en el grupo 2.
ConclusiónLos donadores con mayor índice de masa corporal mostraron valores más altos en variables de tipo metabólico antes y después de la donación. Los donadores del grupo 1 tuvieron mayor proteinuria y mayor pérdida de función renal en comparación con donadores con índice de masa corporal normal.
Kidney transplantation is the best therapeutic option for patients with end stage kidney disease; however the availability of organs from cadaveric donors is insufficient, which has lead to the use of organs from living kidney donors. The prevalence of kidney transplant from living kidney donors varies worldwide: 3.3% in Finland, 8% in France, 47% in the United Kingdom, 49.5% in USA and finally 80% in Japan [1]. The advantages from living kidney transplants are several, among them are: the possibility of performing an elective kidney transplant, ensuring an optimal status of health in the donor and the recipient, reduced incidence of delayed graft function and finally, the patient and allograft survivals are better with living kidney donation. Nevertheless for the donor, it is predicted that the glomerular filtration rate might fall in a period of ten to twenty years after the donation, although until now there is no longitudinal prospective study to prove this because of the difficulty in the follow up of the patients and the gathering of the information. For this reason most of the knowledge about the renal function in kidney donors comes from retrospective studies [2]. In general one of the main consequences of kidney donation is the abrupt reduction in kidney mass causing hyperfiltration which may be accompanied by increment of kidney size and intraglomerular pressure with kidney damage and low glomerular filtration rate lately, however the impact of other variables such as age, gender, blood pressure or body mass index has not been clear in the long term.
Because of the increase in the worldwide prevalence of overweight and obesity it has been necessary to change the donor's selection criteria including those with a body mass index above 30kg/m2.
In the last twenty years the prevalence of obesity has increased 15–30.5% in the adult population in the United States [3]. Today, sixty percent of patients with end stage kidney disease that receive a kidney allograft have overweight or obesity [4].
Obesity is the first modifiable risk factor for chronic kidney disease due to its association with diabetes and high blood pressure. Moreover, obesity by itself increases the risk for developing renal disease through several mechanisms [5].
At the National Institute of Cardiology in Mexico City an average of 40 kidney transplants per year are performed, of which about 50% are living related donors, 25% living unrelated donors and 25% deceased donors. In relation to selection criteria for a potential donor, a person with the following characteristics is considered eligible: BMI ≤30kg/m2, urinary protein excretion less than 200mg/day and a measured or calculated GFR ≥80ml/min, which remain valid and unchanged at the present time, with the exception of BMI, since in the last 5 years some donors with BMI >30kg/m2 have been included, considering each case individually and given the shortage of donors that we currently face.
The aim of the this work is to establish the prevalence of overweight and obesity among kidney donors and compare metabolic type variables, urinary protein excretion and kidney function at baseline and at follow up between donors with overweight or obesity and donors with normal body mass index.
Materials and methodsAll living kidney donors who had complete information on clinical and biochemical variables in the clinical file, both at the time of donation, as well as within a follow-up period of at least 5 years were included, in the period between 1995 and 2010 at the National Institute of Cardiology “Ignacio Chávez” in México City. The cases that did not have this information were excluded from the study, so we could only include 68 cases. Considering that information began to be collected more than two years ago, no cases were included after the year 2010 because they would have an incomplete follow-up period.
The analyzed variables included weight, height, body mass index, proteinuria/creatinuria ratio, systemic blood pressure and serum levels of creatinine, uric acid, glucose, cholesterol and triglycerides at the time of nephrectomy and in the last visit to the nephrology clinic during follow up.
The following definitions were used: hyperuricemia: a serum value of uric acid >6mg% in women and >7mg% in men, hypercholesterolemia: a serum cholesterol value >200mg% and hypertriglyceridemia: a serum triglycerides value >150mg%.
This is a comparative observational study between two groups of donors classified according to BMI. WHO overweight definition based on a BMI ≥25kg/m2 was used to divide the study groups. A BMI <25kg/m2 was considered normal.
The results are expressed in mean±SD, median and interquartile range or proportions as appropriate. The comparison of means among groups was carried out with a t-test for independent samples, or with its non-parametric alternative. The comparison of proportions among groups was done with an X2 test. For evaluating the change in intra-group variables (pre–post nephrectomy), a t-test for related samples was performed. A p<0.05 value was considered significant. SPSS version 18 for Windows was used as the statistical package.
ResultsDuring the study period, a total of 622 transplants were performed, which included living related donors, living unrelated donors, and deceased donors. The main reason for excluding cases from the present study was not having complete records of information in the clinical file during follow-up, which was related to short periods of follow-up, death or loss at follow-up. We do not have the exact number of cases excluded for each of the reasons mentioned above. We included 68 living kidney donors identified in a period of ten years, 43 women (63.3%) and 25 men (36.7%), with a mean age of 46.4±13.5 years. For the total group baseline variables (time of nephrectomy) were the following: serum creatinine 0.93±0.23mg% (range 0.6–1.52), MDRD estimated glomerular filtration rate 104±24.06ml/min (range 62.06–161.9), serum uric acid 5.4±1.55mg% (range 3.2–9.6), serum cholesterol 187±30mg% (range 116–236), triglycerides 138.3±69mg% (range 42.7–378), serum glucose 94±15mg% (range 71–112), urinary protein excretion 0.11±0.072g/g (range 0.01–0.32), and finally body mass index (BMI) 26.08±4.17kg/m2 (range 17.2–38.6).
The total group was divided in two groups according to their BMI: group 1 (with overweight or obesity) with BMI ≥25kg/m2 and group 2 (not obese) with BMI <25kg/m2.
According with the BMI at the moment of donation (basal value), the group 1 included 40 donors, of which 27 (67.5%) had overweight and 13 (32.5%) had obesity. The group 2 included 28 donors.
The time of follow up post nephrectomy for the total group was 115.2±84.1 months (range 4–360), with no significant difference between groups.
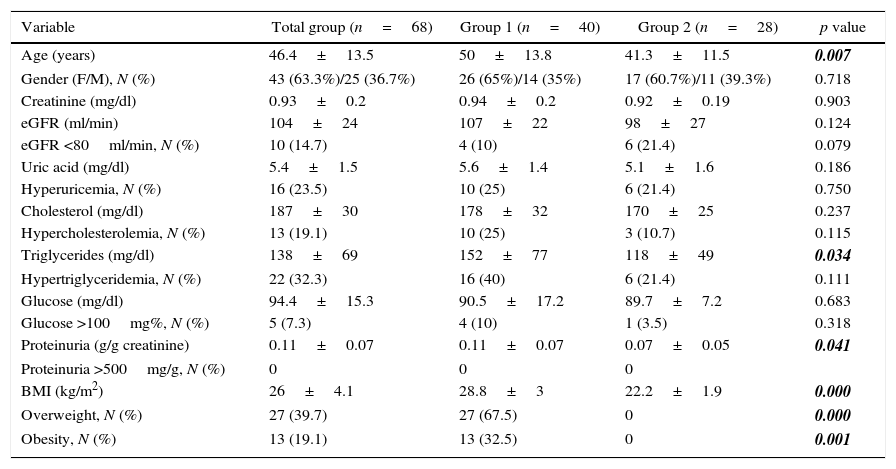
The comparison between groups of the different variables at baseline is shown in Table 1, highlighting that age, triglycerides, proteinuria and BMI were significantly higher in group 1 (50±13.8 vs. 41.3±11.5 years, 152±77.1 vs 118.4±49mg/dl, 0.11±0.07 vs 0.07±0.05g/g and 28.8 ±3 vs 22.2±1.9kg/m2 for group 1 and group 2, respectively).
Variables at the time of nephrectomy.
| Variable | Total group (n=68) | Group 1 (n=40) | Group 2 (n=28) | p value |
|---|---|---|---|---|
| Age (years) | 46.4±13.5 | 50±13.8 | 41.3±11.5 | 0.007 |
| Gender (F/M), N (%) | 43 (63.3%)/25 (36.7%) | 26 (65%)/14 (35%) | 17 (60.7%)/11 (39.3%) | 0.718 |
| Creatinine (mg/dl) | 0.93±0.2 | 0.94±0.2 | 0.92±0.19 | 0.903 |
| eGFR (ml/min) | 104±24 | 107±22 | 98±27 | 0.124 |
| eGFR <80ml/min, N (%) | 10 (14.7) | 4 (10) | 6 (21.4) | 0.079 |
| Uric acid (mg/dl) | 5.4±1.5 | 5.6±1.4 | 5.1±1.6 | 0.186 |
| Hyperuricemia, N (%) | 16 (23.5) | 10 (25) | 6 (21.4) | 0.750 |
| Cholesterol (mg/dl) | 187±30 | 178±32 | 170±25 | 0.237 |
| Hypercholesterolemia, N (%) | 13 (19.1) | 10 (25) | 3 (10.7) | 0.115 |
| Triglycerides (mg/dl) | 138±69 | 152±77 | 118±49 | 0.034 |
| Hypertriglyceridemia, N (%) | 22 (32.3) | 16 (40) | 6 (21.4) | 0.111 |
| Glucose (mg/dl) | 94.4±15.3 | 90.5±17.2 | 89.7±7.2 | 0.683 |
| Glucose >100mg%, N (%) | 5 (7.3) | 4 (10) | 1 (3.5) | 0.318 |
| Proteinuria (g/g creatinine) | 0.11±0.07 | 0.11±0.07 | 0.07±0.05 | 0.041 |
| Proteinuria >500mg/g, N (%) | 0 | 0 | 0 | |
| BMI (kg/m2) | 26±4.1 | 28.8±3 | 22.2±1.9 | 0.000 |
| Overweight, N (%) | 27 (39.7) | 27 (67.5) | 0 | 0.000 |
| Obesity, N (%) | 13 (19.1) | 13 (32.5) | 0 | 0.001 |
BMI=body mass index.
All variables are expressed as mean±SD or % as appropriate. eGFR=estimated glomerular filtration rate.
Bold-italic numbers highlight statistically significant values.
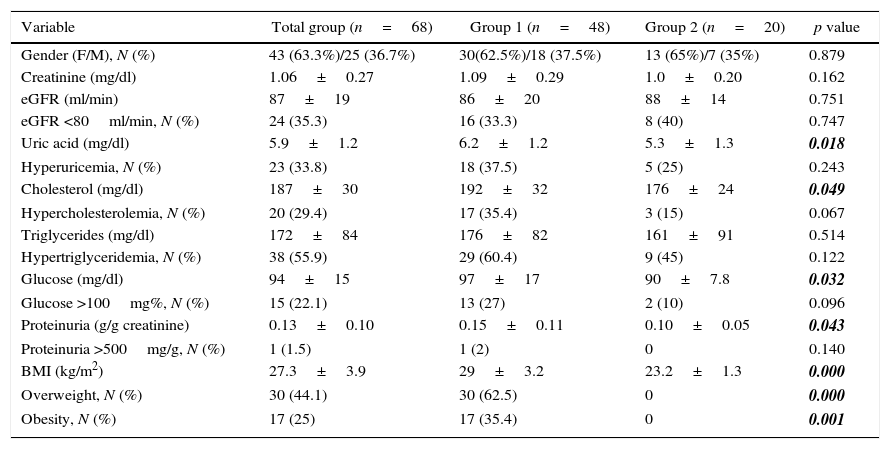
The analyzed variables in the last visit at follow up are shown in Table 2. Serum uric acid, cholesterol, glucose, proteinuria and BMI were significantly higher in the group with overweight and obesity (6.1±1.2 vs 5.3±1.3mg%, 192±32 vs 176±24mg%, 97±17 vs 90±7.8mg%, 0.15±0.11 vs. 0.10±0.05g/g and 29±3.2 vs 23.2±1.3kg/m2 for group 1 and group 2, respectively).
Variables at the end of follow up.
| Variable | Total group (n=68) | Group 1 (n=48) | Group 2 (n=20) | p value |
|---|---|---|---|---|
| Gender (F/M), N (%) | 43 (63.3%)/25 (36.7%) | 30(62.5%)/18 (37.5%) | 13 (65%)/7 (35%) | 0.879 |
| Creatinine (mg/dl) | 1.06±0.27 | 1.09±0.29 | 1.0±0.20 | 0.162 |
| eGFR (ml/min) | 87±19 | 86±20 | 88±14 | 0.751 |
| eGFR <80ml/min, N (%) | 24 (35.3) | 16 (33.3) | 8 (40) | 0.747 |
| Uric acid (mg/dl) | 5.9±1.2 | 6.2±1.2 | 5.3±1.3 | 0.018 |
| Hyperuricemia, N (%) | 23 (33.8) | 18 (37.5) | 5 (25) | 0.243 |
| Cholesterol (mg/dl) | 187±30 | 192±32 | 176±24 | 0.049 |
| Hypercholesterolemia, N (%) | 20 (29.4) | 17 (35.4) | 3 (15) | 0.067 |
| Triglycerides (mg/dl) | 172±84 | 176±82 | 161±91 | 0.514 |
| Hypertriglyceridemia, N (%) | 38 (55.9) | 29 (60.4) | 9 (45) | 0.122 |
| Glucose (mg/dl) | 94±15 | 97±17 | 90±7.8 | 0.032 |
| Glucose >100mg%, N (%) | 15 (22.1) | 13 (27) | 2 (10) | 0.096 |
| Proteinuria (g/g creatinine) | 0.13±0.10 | 0.15±0.11 | 0.10±0.05 | 0.043 |
| Proteinuria >500mg/g, N (%) | 1 (1.5) | 1 (2) | 0 | 0.140 |
| BMI (kg/m2) | 27.3±3.9 | 29±3.2 | 23.2±1.3 | 0.000 |
| Overweight, N (%) | 30 (44.1) | 30 (62.5) | 0 | 0.000 |
| Obesity, N (%) | 17 (25) | 17 (35.4) | 0 | 0.001 |
BMI=body mass index.
All variables are expressed as mean±SD or % as appropriate. eGFR=estimated glomerular filtration rate.
Bold-italic numbers highlight statistically significant values.
Analyzing the proportion of individuals with overweight or obesity and those with normal IBM in the last visit to the nephrology clinic, we found that 48 cases (70.6%) belonged to group 1 of which 30 had overweight and 18 obesity, so the increment in overweight and obesity comparing the basal moment and the last revision at follow up was 11.8%.
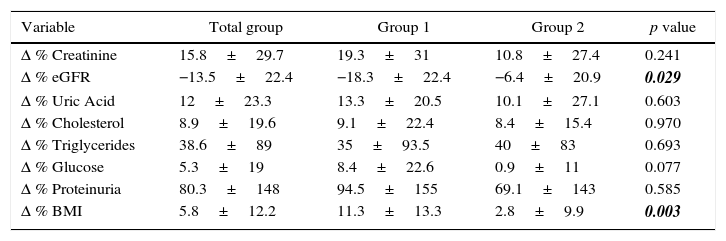
When we analyzed the changes in different variables before and after nephrectomy, we observed that group 1 had a fall significantly higher in estimated glomerular filtration rate in comparison with the fall seen in group 2 (21 vs 10ml/min and 18.3 vs 6.4% change in group 1 and group 2, respectively). We observed a trend toward a higher percentage of change in uric acid, cholesterol, glucose and urinary protein excretion in group 1. Likewise, the percentage change in BMI was significantly higher in group 1 compared to group 2. These results are shown in Table 3.
Comparison of % change between both groups.
| Variable | Total group | Group 1 | Group 2 | p value |
|---|---|---|---|---|
| Δ % Creatinine | 15.8±29.7 | 19.3±31 | 10.8±27.4 | 0.241 |
| Δ % eGFR | −13.5±22.4 | −18.3±22.4 | −6.4±20.9 | 0.029 |
| Δ % Uric Acid | 12±23.3 | 13.3±20.5 | 10.1±27.1 | 0.603 |
| Δ % Cholesterol | 8.9±19.6 | 9.1±22.4 | 8.4±15.4 | 0.970 |
| Δ % Triglycerides | 38.6±89 | 35±93.5 | 40±83 | 0.693 |
| Δ % Glucose | 5.3±19 | 8.4±22.6 | 0.9±11 | 0.077 |
| Δ % Proteinuria | 80.3±148 | 94.5±155 | 69.1±143 | 0.585 |
| Δ % BMI | 5.8±12.2 | 11.3±13.3 | 2.8±9.9 | 0.003 |
BMI=body mass index.
The values are shown as % change (mean±SD). eGFR=estimated glomerular filtration rate.
Bold-italic numbers highlight statistically significant values.
The values of systolic and diastolic blood pressure were not significantly different between groups, neither at the basal moment nor at the last visit to the nephrology clinic. We not identify significant changes in blood pressure within each group comparing pre and post nephrectomy values.
No significant differences were found when comparing between groups the percentages of patients with abnormal values of GFR, uric acid, cholesterol, triglycerides and glucose. In relation to urinary protein excretion, no case with a value ≥500mg/day was presented in the baseline period and at the end of the follow-up only one case with that value was identified in group 1.
DiscussionIn this study we observed that the presence of overweight or obesity at the moment of nephrectomy is related with the development of higher but non-pathological proteinuria. This phenomenon perhaps is a manifestation of the increase in intraglomerular pressure due to hyperfiltration and adaptive changes in podocytes. As well, the increase in renal metabolic demand may contribute to the risk of chronic kidney disease in patients with overweight and obesity. At birth, we have a certain number of nephrons and with the increase of weight there is an increment in the work load for each one of them, which is manifested by an increase in glomerular filtration rate and effective renal blood flow compared with adult people with ideal weight [6]. Also, it has been described that during hyperfiltration, podocytes are unable to replicate in response to hemodynamic changes imposed by obesity, therefore podocytes diminish in number in a determinate glomerular surface area and remaining podocytes get enlarged to compensate, which predispose them to detach from glomerular basement membrane, increasing the risk of chronic kidney disease in the long term [7].
Pinto-Sietsman published the relationship between BMI and the presence of micro albuminuria in people with diabetes or any other comorbidity, finding that patients with BMI >30kg/m2 had higher micro albuminuria, defined as a protein excretion of 30mg/24h [8]. In this respect, it should be noted that our study population had an average BMI of less than 30kg/m2, however as in Pinto-Sietsman's study, our study shows a tendency that higher BMI relates to a higher degree of proteinuria, which suggests that reduction in renal mass in the context of obesity or overweight confers a higher risk for development of proteinuria with eventual impairment of kidney function. On the other hand, we found that donors with overweight or obesity at the moment of nephrectomy had higher levels of serum triglycerides and although there is no clear relationship between triglycerides levels and kidney function, high triglycerides levels can be included in the spectrum of metabolic syndrome which constitutes a well described risk factor for renal damage. Kurella showed in a cohort of 10,096 patients with normal kidney function that 691 (7%) developed chronic kidney disease defined as glomerular filtration rate below 60ml/min after a follow up of nine years, with an odds ratio adjusted for chronic kidney disease of 1.43 (CI 95% 1.18–1.73) in those with metabolic syndrome [9].
In regard to the characteristics of our population at the last nephrology clinic visit, we observed an increment in the percent of donors with overweight or obesity comparing with baseline, which is related to a higher prevalence of obesity in Mexican population. The National Health Survey in 2012 documented that the prevalence of obesity in Mexico for adults older than 20 years is 32.4% and for overweight is 71.3%, with an annual increase of 1.3%, being higher in the period 2000–2006 (2.1%) [10], which corresponds with the period of follow up in our study. In this respect, there is not enough information in the literature that explains the prognosis of obese kidney donors in the long term. In 2012, O'Brien published his experience with 7 donors with morbid obesity (BMI >40kg/m2) followed for 20 months, reporting only an increase in the number of minor surgical complications and concluded that the procedure is feasible [11].
At last revision, donors of group 1 showed higher values of metabolic type variables, such as uric acid, glucose and cholesterol, not necessarily fulfilling the diagnostic criteria for metabolic syndrome. In this sense, Thomas found an association between metabolic syndrome and impaired renal function during 3.5–12 years of follow up (OR 1.95 for GFR <60ml/min) [12]. In our study we did not identify such association, however when we compared the decline in glomerular filtration rate in each group, we found a major change in group 1, without reaching values lower than 60ml/min.
Comparing our results with data published by Rogers, we can conclude that we did not have donors who developed advanced chronic kidney disease [13].
Finally, comparing data from this study with other series from our country, we found that in the Gracida study, obese donors, with a mean BMI of 32.8kg/m2, had an average percentage loss of 24.8 in GFR at the end of follow up, which represented a greater loss compared to our donors, who had on average a decrease in renal function at the end of follow-up of 18.3% [14]. This is probably related, at least in part, to a lower BMI in the obese donor group in our study. Likewise, other studies such as that of Cuevas-Ramos and colleagues [15] have confirmed the negative impact of metabolic alterations on renal function in the follow-up of a group of donors. In this study, the presence of metabolic syndrome prior to nephrectomy was associated with a significant fall in renal function at follow-up, and although BMI was not independently a risk factor for renal function decline, it is probably the sum of metabolic alterations which explains this effect.
The results of the present study have not modified at the present time our selection criteria for a potential donor, considering among other things the shortage of donors, however, it has been emphasized in our service the need to keep indefinitely close surveillance of donors with overweight or obesity, through the nephrology, endocrinology and nutrition departments.
As limitations of the study we must mention the small sample size, retrospective nature of it and the lack of data regarding the use of drugs.
ConclusionKidney donors with overweight or obesity showed higher levels of metabolic type variables at baseline and at last visit of follow up. Likewise, donors with overweight or obesity had higher levels of urinary protein excretion and higher decline in glomerular filtration rate compared with donors with normal BMI.
Ethical disclosuresProtection of human and animal subjectsThe authors declare that no experiments were performed on humans or animals for this study.
Confidentiality of dataThe authors declare that no patient data appear in this article.
Right to privacy and informed consentThe authors declare that no patient data appear in this article.
Conflict of interestsOn behalf of all authors, the corresponding author states that there is no conflict of interest.