

Almost half the calories consumed globally today derive directly from grain; of this, about a quarter comes from wheat. Thanks to international trade, wheat is widely consumed in places where its production is virtually impossible, thus making the functioning of wheat markets unique in its importance for world food security. Yet it was not always like that: in historical terms, the globalization of wheat consumption has been a relatively new phenomenon. The aim of this work is twofold. First, it identifies major trends in wheat consumption across different groups of countries from 1939 to 2010. Second, it offers an informed explanation of those trends.
Casi la mitad de las calorías que componen la ingesta calórica mundial proviene de los cereales, y de ese porcentaje, aproximadamente un cuarto proviene del trigo. Gracias al comercio internacional, una gran variedad de productos hechos de trigo es consumida en lugares en los que su producción es prácticamente imposible. Debido a ello, el funcionamiento del mercado internacional de trigo ha adquirido una importancia crucial para la seguridad alimentaria mundial. Sin embargo, esto no siempre ha sido así: en términos históricos, la globalización del consumo de trigo es un fenómeno relativamente reciente. El objetivo de este trabajo es doble. En primer lugar, se identifican las tendencias fundamentales en el consumo de trigo, por diferentes grupos de países, durante el periodo 1939-2010. En segundo lugar, se ofrece una explicación detallada de esas tendencias.
Almost half the calories consumed globally today derive directly from grain; of this, about a quarter comes from wheat. In some parts of the world wheat has long been even more significant than such global average suggests, and its production and distribution a central concern of political economy. Unlike other commodities such as rice, wheat possesses a number of features that facilitate its shipping and storage: it does not break easily and it can be preserved indefinitely as long as it is kept away from humidity and rodents (Maurette, 1922; Mitchell and Mielke, 2005). The “king of grains” is grown in an area larger than any other crop, and – to a great extent due to some of the aforementioned reasons – it is the most traded grain. Thanks to international trade, wheat is widely consumed in places where its production is virtually impossible, thus making the functioning of wheat markets unique in its importance for world food security. Today, wheat is grown in more than 120 countries and it is consumed extensively even in a greater number of places. Yet, it was not always like that: in historical terms, the globalization of wheat consumption has been a relatively new phenomenon.
We know a good deal about the choice of food grains in Europe, up to and including the first two thirds of the 20th Century, thanks to the work of Collins (1993). Collins pointed out that, in 1750, wheat was barely consumed over most northern, eastern and central Europe, and was not the exclusive grain in the Mediterranean. The situation was little changed in the mid-nineteenth Century, since wheat was the preferred grain in only a very few countries such as Spain, Italy, Greece, Bulgaria, Britain and France. However, in nearly all European countries wheat consumption began to grow significantly from the mid-1850s onwards. Data from Malembaum's seminal study on the world wheat economy (Malembaum, 1953) clearly shows that this trend lasted until World War II in most European economies, although the tendency leveled off in the most advanced countries over the interwar period. In order to explain why wheat displaced other staples to become the overwhelmingly preferred grain in Europe, Collins provided several reasons. First, wheat tended to be regarded as superior to all other grains on account of its taste, texture, color and digestibility. Second, increased utilization of wheat had much to do with the growing availability of hard wheats coming from the continental interiors of North America and Eastern Europe in the later nineteenth Century. While soft home-grown wheats were generally used for pastry and biscuits or fed to livestock, hard spring wheats were much better suited for bread-making. The new availability of hard varieties, together with a revolution in milling techniques, made possible “a change not just in the type of grain but in the basic structure of the diet, and was part of a process, beginning in the pre-historic times and still on-going, whereby baked grains replaced boiled grains as the staple grain food”1 (Collins, 1993, p. 32). Finally, Collins pointed out that the process of urbanization also tended to encourage higher wheat consumption. Urbanization reflected differences in relative prices, accessibility, and real income, and working-class diets became progressively based on baker's bread because it was an essential convenience food, particularly where households were not equipped with ovens and fuel was expensive.
Considering this kind of reflections and the observed trends in European wheat consumption, Collins asserted that, “looking to the future, should food habits continue to converge and to conform the European norm, then just possibly wheat may become the universal food grain and the wheat loaf the universal grain-food” (Collins, 1993, p. 7). It has been more than twenty years since the publication of Collins’ study, different consumption patterns have been identified across countries and new data on wheat consumption has been made available on a world scale. Indeed, the work by Collins is part of a much broader field of literature on the determinants of changing eating habits and nutritional transitions worldwide. While the Popkin's model (1993, 2006) considers income as the main driver of the European nutritional transition, other scholars have focused on variables such as technology, sex and age structure, women participation in the labor force, domestic infrastructures, the urbanization process, institutions, etc. (Atkins et al., 2007; Mokyr and Stein, 1997; Collins, 1993; Burnett and Oddy, 1994; Burnett, 1989). There is no doubt that income has been a powerful driver of consumption habits, yet income-elasticity of demand should not be considered as a given variable but as an historical outcome that has to be explained (Pujol and Cussó, 2014). In this regard, the aim of this work is twofold. First, it identifies major trends in wheat consumption across different groups of countries from 1939 to 2010. Second, it offers an informed explanation of those trends, taking into account income trends but also geography and institutional variables such as trade policies. For that purpose, the paper is structured as follows. Section 2 deals with some critical considerations on wheat production and consumption, shedding light on the different end-uses that wheat may have, and providing a synthesis of the most relevant theoretical elucidations concerning wheat demand. Then, since the analysis of the evolution of wheat consumption will make use of a very particular way of aggregating countries, Section 3 begins by explaining that aggregation criteria. The rest of the section provides both a descriptive and an explicative analysis of the major trends in wheat demand. Finally, the concluding section summarizes our major findings.
2Some key considerations on wheat production and consumptionWheat is not simply just wheat (Smith, 2000). In fact, hundreds of different varieties of wheat are produced around the world based on characteristics of the local climate (Ghoshray, 2006). Plant breeding programs differ significantly from one producing region to another, and environmental factors, such as temperature, rainfall, topography, and soil determine wheat characteristics such as protein content and kernel size (Ghoshray, 2006). As shall be explained, some of those characteristics may limit the viability of wheat for various end uses.2 Following Smith (2000), wheat quality attributes may be divided into three general categories: (1) intrinsic characteristics such as hardness, kernel size, color, ash content, disease resistance, and protein quality and quantity; (2) physical condition, including test weight, moisture, purity and damaged kernels, and (3) wholesomeness, including insect damage, pesticide residues, and noxious weed seeds. Wheat is commonly classified according to some of its intrinsic characteristics, which generally are not easy to identify by simple visual inspection. For instance, a commonly-used basis for classifying wheat is according to hardness –a milling characteristic– or according to strength, which is a baking characteristic (Kent and Evers, 1994). The growing season is also commonly used to classify wheat (Inglett, 1974). All these general groupings have resulted in the establishment of seven basic classes of wheat: Hard Red Spring, Hard Red Winter, Soft Red Winter, Soft White, Durum, Unclassed, and Mixed3 (Uri and Douglas Beach, 1997). Many of these wheat classes are further divided into subclasses, according to some of the intrinsic characteristics of wheat. For instance, durum wheat – the hardest – is divided into three subclasses: hard amber durum wheat, amber durum wheat, and durum wheat (Smith, 2000). The producer's decision of choosing one particular variety of wheat above the alternatives has to do with the expected yields and prices for each variety and the potential for unpredictable variations in those yields and prices. While variations in prices among classes of wheat derive from differences in intrinsic characteristics, such as kernel hardness or protein quantity,4 the expected yields are mostly dependent on the suitability of the variety to the climate and soil features of the area. Therefore, although there is a certain degree of substitutability between varieties,5 some of them are always more suitable to certain regions than others. In fact, each of the major exporters have tended to specialize in producing and exporting one type of wheat. For instance, Canada specializes in Hard Red Spring while Argentina is “the main competitor of the US Hard Winter wheat” (Shalaby et al., 1988, p. 25). This has been important in the history of the wheat trade, since higher quality wheat – for instance, the Canadian Western Red Spring Wheat – normally commands a premium on the world market (Larue, 1991). Unfortunately, in spite of the heterogeneous nature of wheat, historical statistics on wheat production and consumption are usually only available in an aggregated form.6
With regard to wheat end-uses, the importance of wheat is not simply because of bread. Hard varieties tend to be higher in protein and are mainly used in bread flour, whereas softer varieties are usually milled into flour for cookies or cakes, due to their lower protein content (Wheat Flour Institute, 1981). In fact, Hard Red Winter wheat is not only utilized in bread production: it is also widely used to make noodles, sweet goods, and all-purpose flour (Smith, 2000). Soft Red Winter wheat is commonly used for cakes, flat breads, pastries, and crackers. Semolina flour, the basic input from which pasta products are made, is obtained from Durum wheat. Wheat is the elementary ingredient for many Mediterranean dishes, such as pizza and pasta, it is a staple in many parts of the world, and it provides roughly one-fifth of the world's calorie supplies (Mitchell and Mielke, 2005). Moreover, wheat uses are not confined to producing food for human consumption: wheat is widely used for animal feed in certain countries, it can be used as biofuel, and it can be utilized as a food additive (starches, gluten, and so on). Of course, wheat consumption is not equally distributed among different end-uses in all countries. For instance, only 8 countries used wheat as biofuel in 2012, and each of those showed very different rates of use (Canals and Amante, 2015).7 As will be discussed later, the rate of use of wheat as animal feed has also varied greatly over time and across regions, and it has come to be truly important in some developed countries (despite wheat being disadvantaged as a feed grain because it costs more to produce than maize but provides less feed energy (Whitman, 1989)).
To a great extent due to the extraordinary relevance of wheat in terms of world nutrition – but also due to its predominant role within world agriculture and its major impact on producer's welfare, trying to understand and predict the evolution of wheat demand has been a major concern throughout history. Since wheat has many different end-uses, it has been pointed out that its demand is a derived demand (Stigler, 1966). The desire for wheat is not based on any intrinsic want for the wheat itself, but rather on the need to use the flour resulting from the milling of the wheat to produce differentiated products such as pastries, bread, and rolls (Uri and Douglas Beach, 1997). This means that “the demand for wheat is determined in the final markets by the demand and supply for wheat derivative products being sold” (Uri and Douglas Beach, 1997, p. 360). Yet, wheat has usually been regarded as a homogeneous product for the purpose of discussing demand trends. This is entirely understandable, since direct human consumption represents by far the largest part of wheat demand,8 and basic demand for food possesses distinctive characteristics. By the end of the 19th Century, the Prussian statistician Ernst Engel had already noticed that, the richer the people, the lower the share of food in total family spending (Scholiers, 2014). Since food has to be obtained in all situations, it was also noticed that food demand was highly inelastic with respect to price: changes in price affected total demand only slightly (Lehfeldt, 1914). The awareness of this peculiarity of food demand – i.e. its low income-elasticity and low price-elasticity9 – led to growing concerns about trends in food prices over the first decades of the 20th Century.10 The fact that there was a clear physiological maximum in per capita wheat demand was certainly taken into account by the authors who aimed to explain wheat overproduction in the 1930s. It was feared that wheat income-elasticity of demand could be negative at certain levels of income: as people would earn more, they would purchase fewer wheat products because they would shift to more expensive sources of calories. These limits to the growth of wheat demand in industrialized countries were soon perceived as an obstacle to overcome the so-called ‘wheat problem’ in exporting countries. There was indeed the view that: the inelasticity of the demand curve for human consumption of wheat means that the possibilities for increasing human consumption by decreasing price were limited indeed. Moreover, one major objective in expanding human consumption, thus increasing demand, was specifically to raise prices. It is clear, therefore, that only basic improvements in living standards and forward strides in the development of less developed areas could bring about such an increased demand for wheat (Malembaum, 1953, p. 196)
Thus, after WWII it was clear to some scholars and policymakers in the United States that supply-management policies would not be enough to tackle the ‘wheat problem’: an increased world demand for wheat was also strongly desirable. World wheat demand chiefly depends on three variables: the percentage of population that consumes wheat, the amount of wheat consumed per capita, and population growth. Considering this, and given the previously-mentioned peculiarities of wheat demand in industrialized countries, it was clear to policymakers in wheat-exporting countries that the most promising possibilities of increased demand were to be found in developing countries.
Indeed, world wheat consumption patterns were transformed at historically unprecedented rates over the 70 years following WWII. This global change in the distribution of wheat demand can be framed within broader patterns of diet transformation over the 20th Century. Of course, these patterns are deeply related with the worldwide process of economic growth and structural change (i.e., with higher real incomes and growing urban populations all over the world). However, as shall be explained in section four, the evolution of wheat demand has had its own peculiarities. Importantly, in order to understand those peculiarities, particular consideration has to be given to institutional variables such as trade policies.
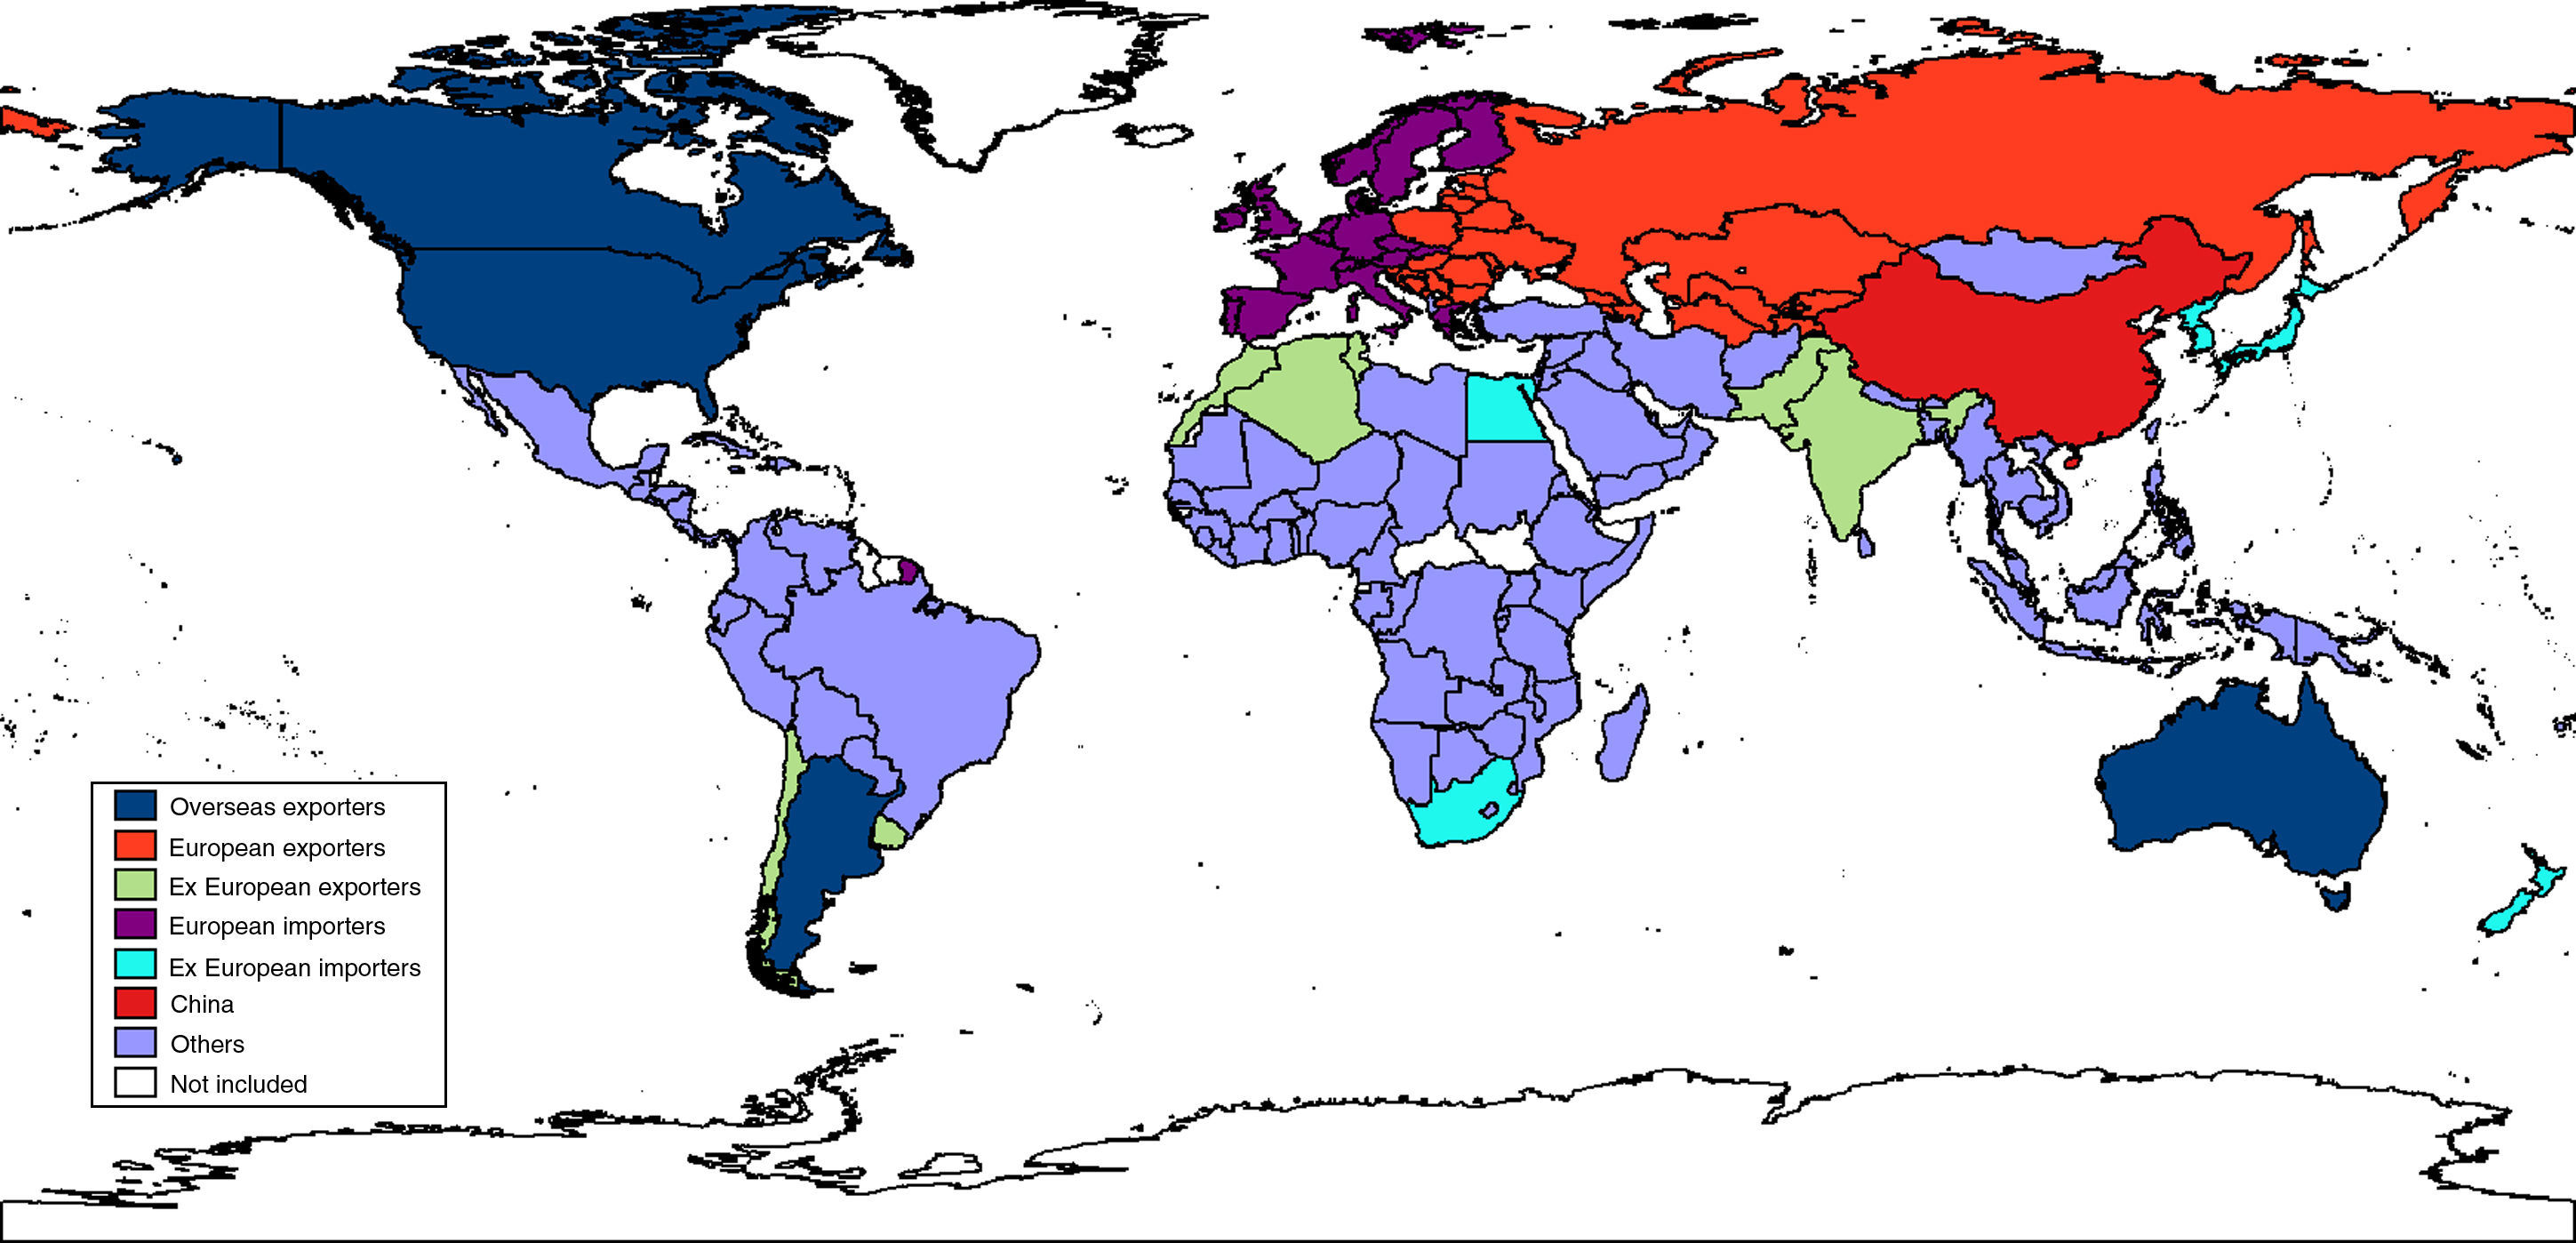
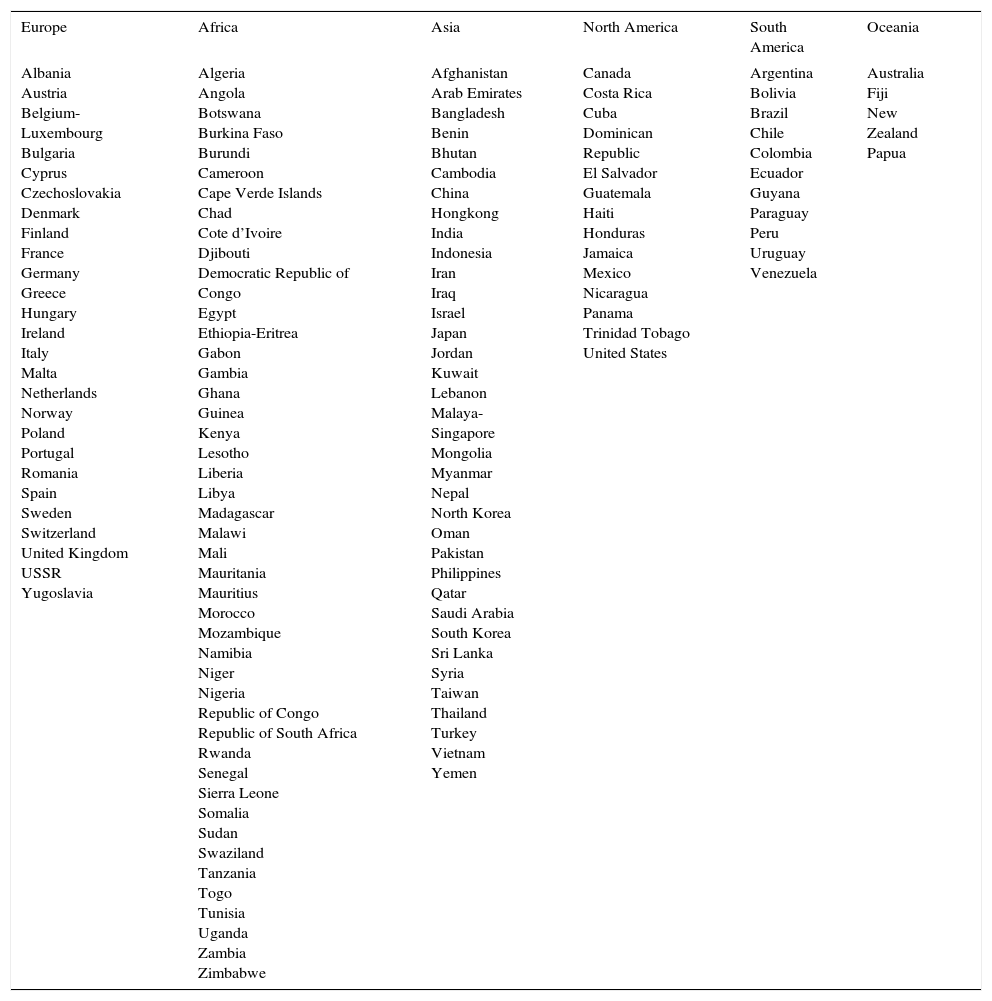
3World wheat consumption trends3.1Classification of countriesOur depiction of wheat consumption between 1939 and 2010 will be based on two different ways of aggregating countries: (1) the continental approach, which may be more useful in order to frame wheat demand geographically, and (2) the grouping of countries according to Malembaum's categorization for the interwar period (Malembaum, 1953), which may be more convenient in order to illustrate the changes with respect to the pre-war situation. Wheat-producing and consuming countries in the interwar period were grouped by Malembaum (1953) according to their usual position in the net balance of international wheat shipments. This author distinguished between the overseas exporters (USA, Australia, Argentina, and Canada, accounting for roughly 80 per cent of all net exports of wheat), the European exporters (USSR, Bulgaria, Hungary, Romania, Yugoslavia, Poland), the ex-European exporters (India, Algeria, Morocco, Tunis, Chile, Uruguay), the European importers (British Isles, France, Germany, Italy, Spain, Austria, Belgium, Czechoslovakia, Finland, Denmark, Greece, Ireland, Netherlands, Norway, Sweden and Switzerland, accounting for roughly 70% of all world imports), and the ex-European importers (Japan, Korea, South Africa, Egypt, New Zealand). Due to the lack of reliable data, China and Manchuria – by far the more significant countries in the remaining twenty percent – were not included in his analysis. Our study will make use of Malembaum's taxonomy to analyze major trends in world wheat consumption after WWII. However, our classification will include China separately – due to its special relevance – and will also include an additional group of 94 countries that were not incorporated in Malembaum's work (see Fig. 1).

Malembaum's classification of countries for the interwar period.
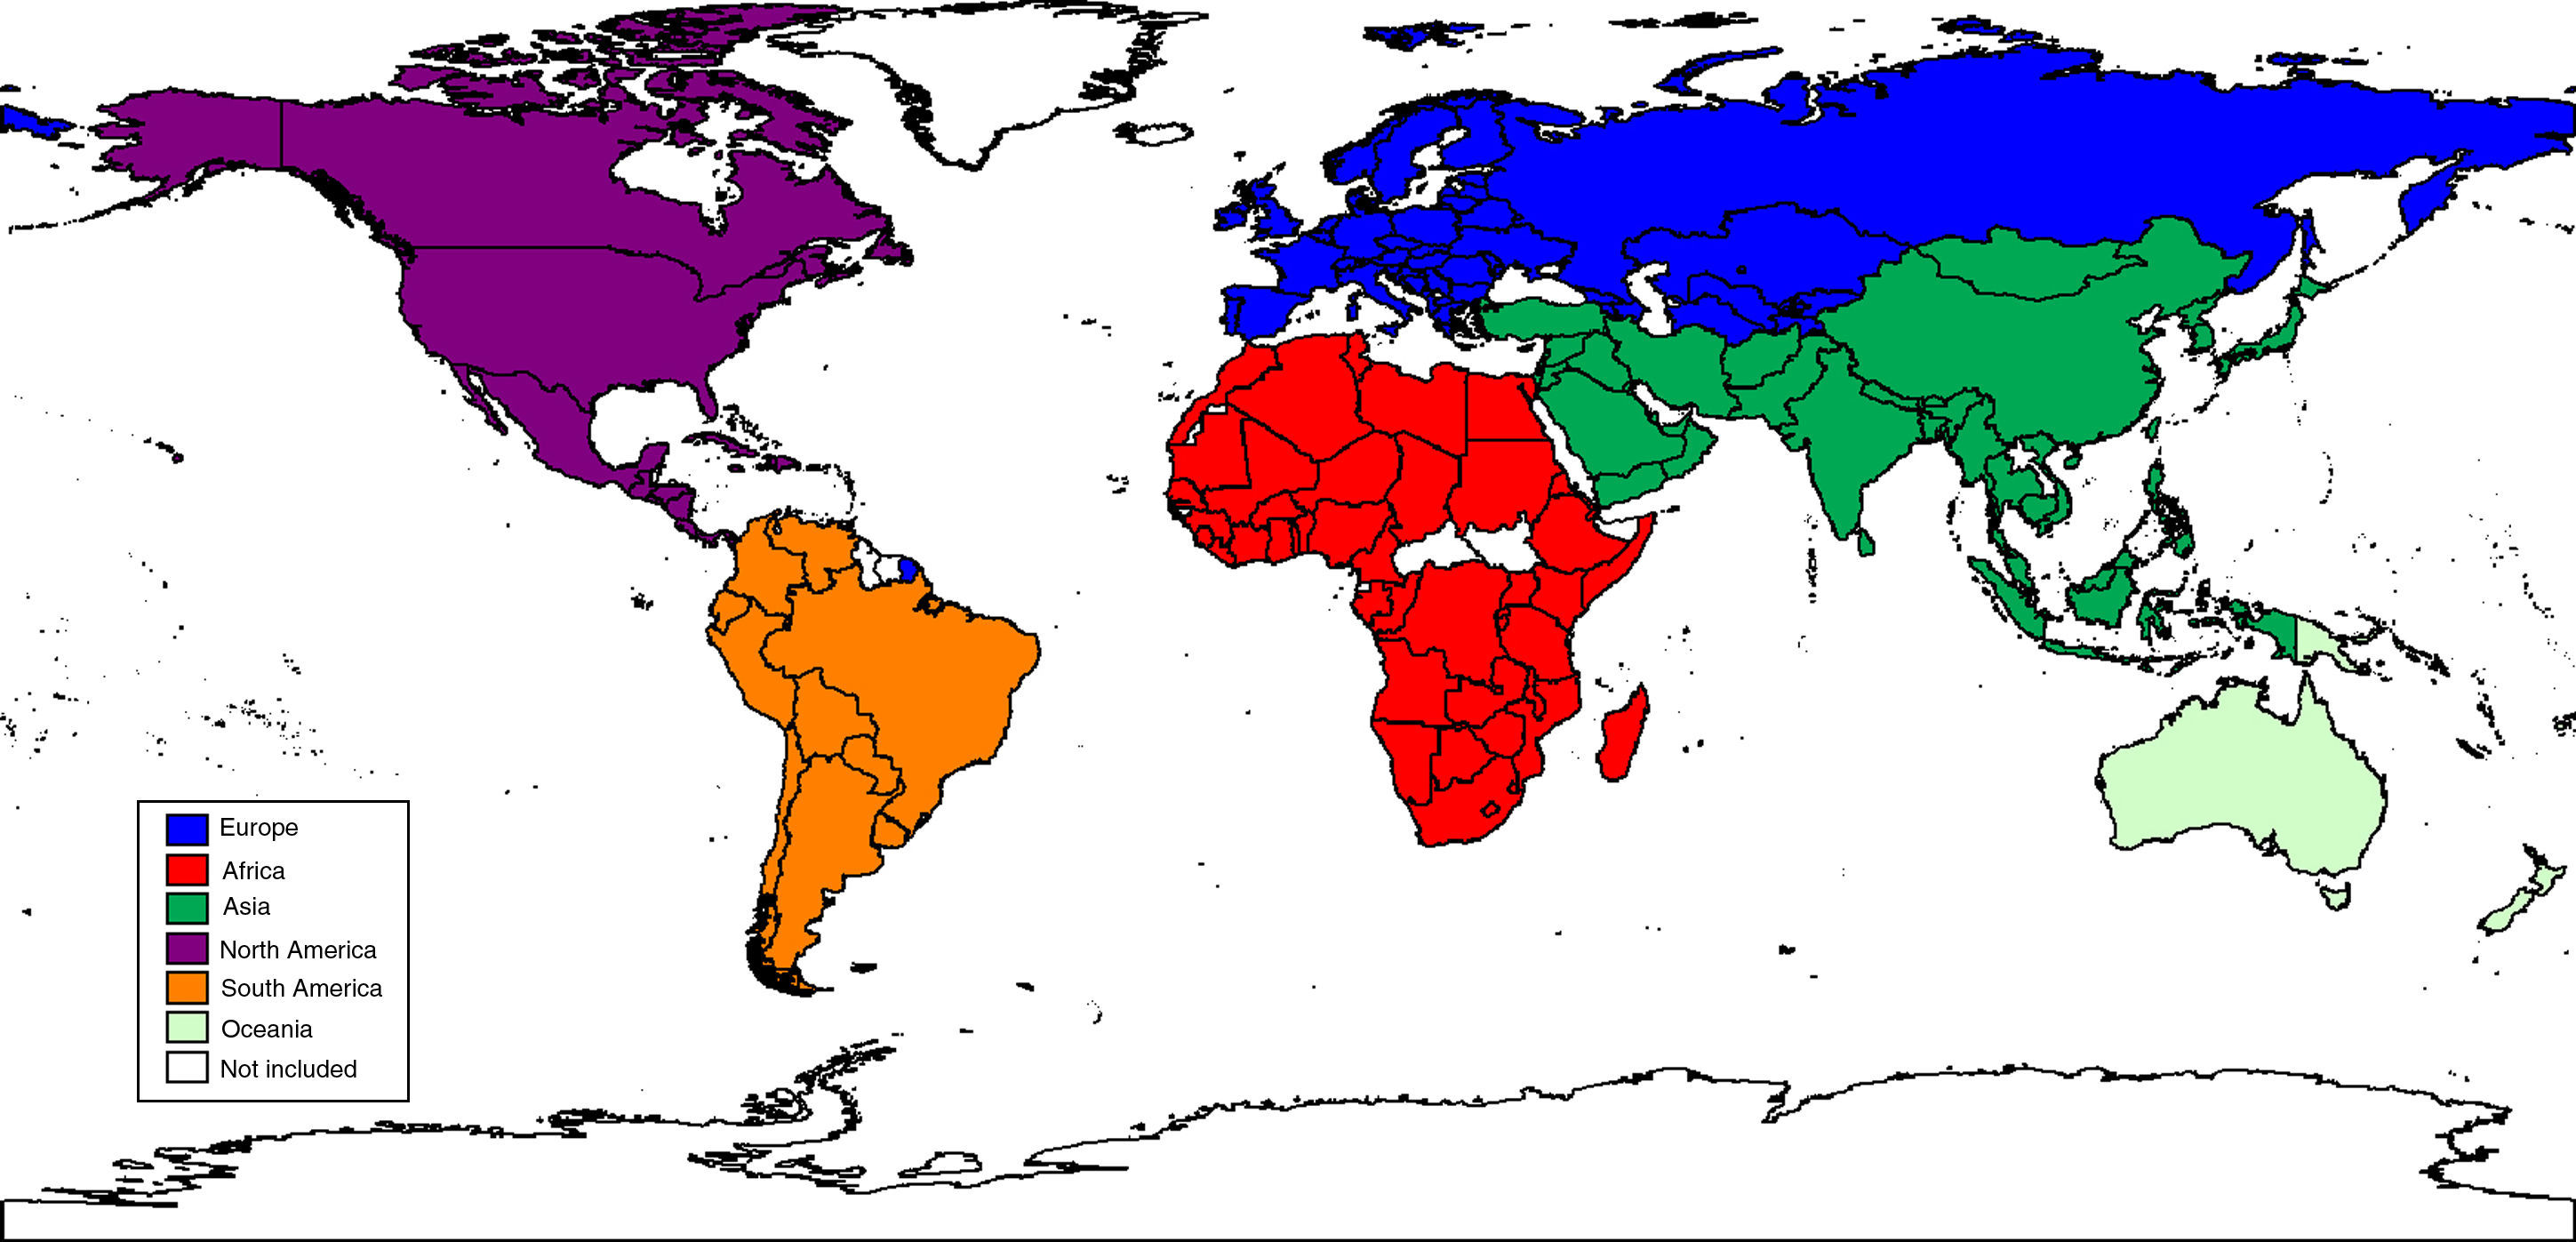
The 94 countries conforming the group of “others” were not included in Malembaum's study due to their lack of importance in the prewar world wheat economy. Wheat was neither produced nor consumed in those countries, and hence they did not actively participate in international wheat markets. Yet, the situation would change significantly after the Second World War. González Esteban (2017a) shows that major transformations in world wheat consumption over the second half of the twentieth Century had tremendous implications for international wheat trade. As will be explained in section 4, this crucial transformation in international markets had much to do with the rapidly growing demand for wheat in the group of “others”. Applying Malembaum's categorization to the study of postwar wheat consumption will allow us to illustrate major changes with respect to the prewar situation. In addition, we will complement our study with a standard inter-continental analysis (classification of countries by continent may be seen in Fig. 2).
3.2The growing wheat supply availability
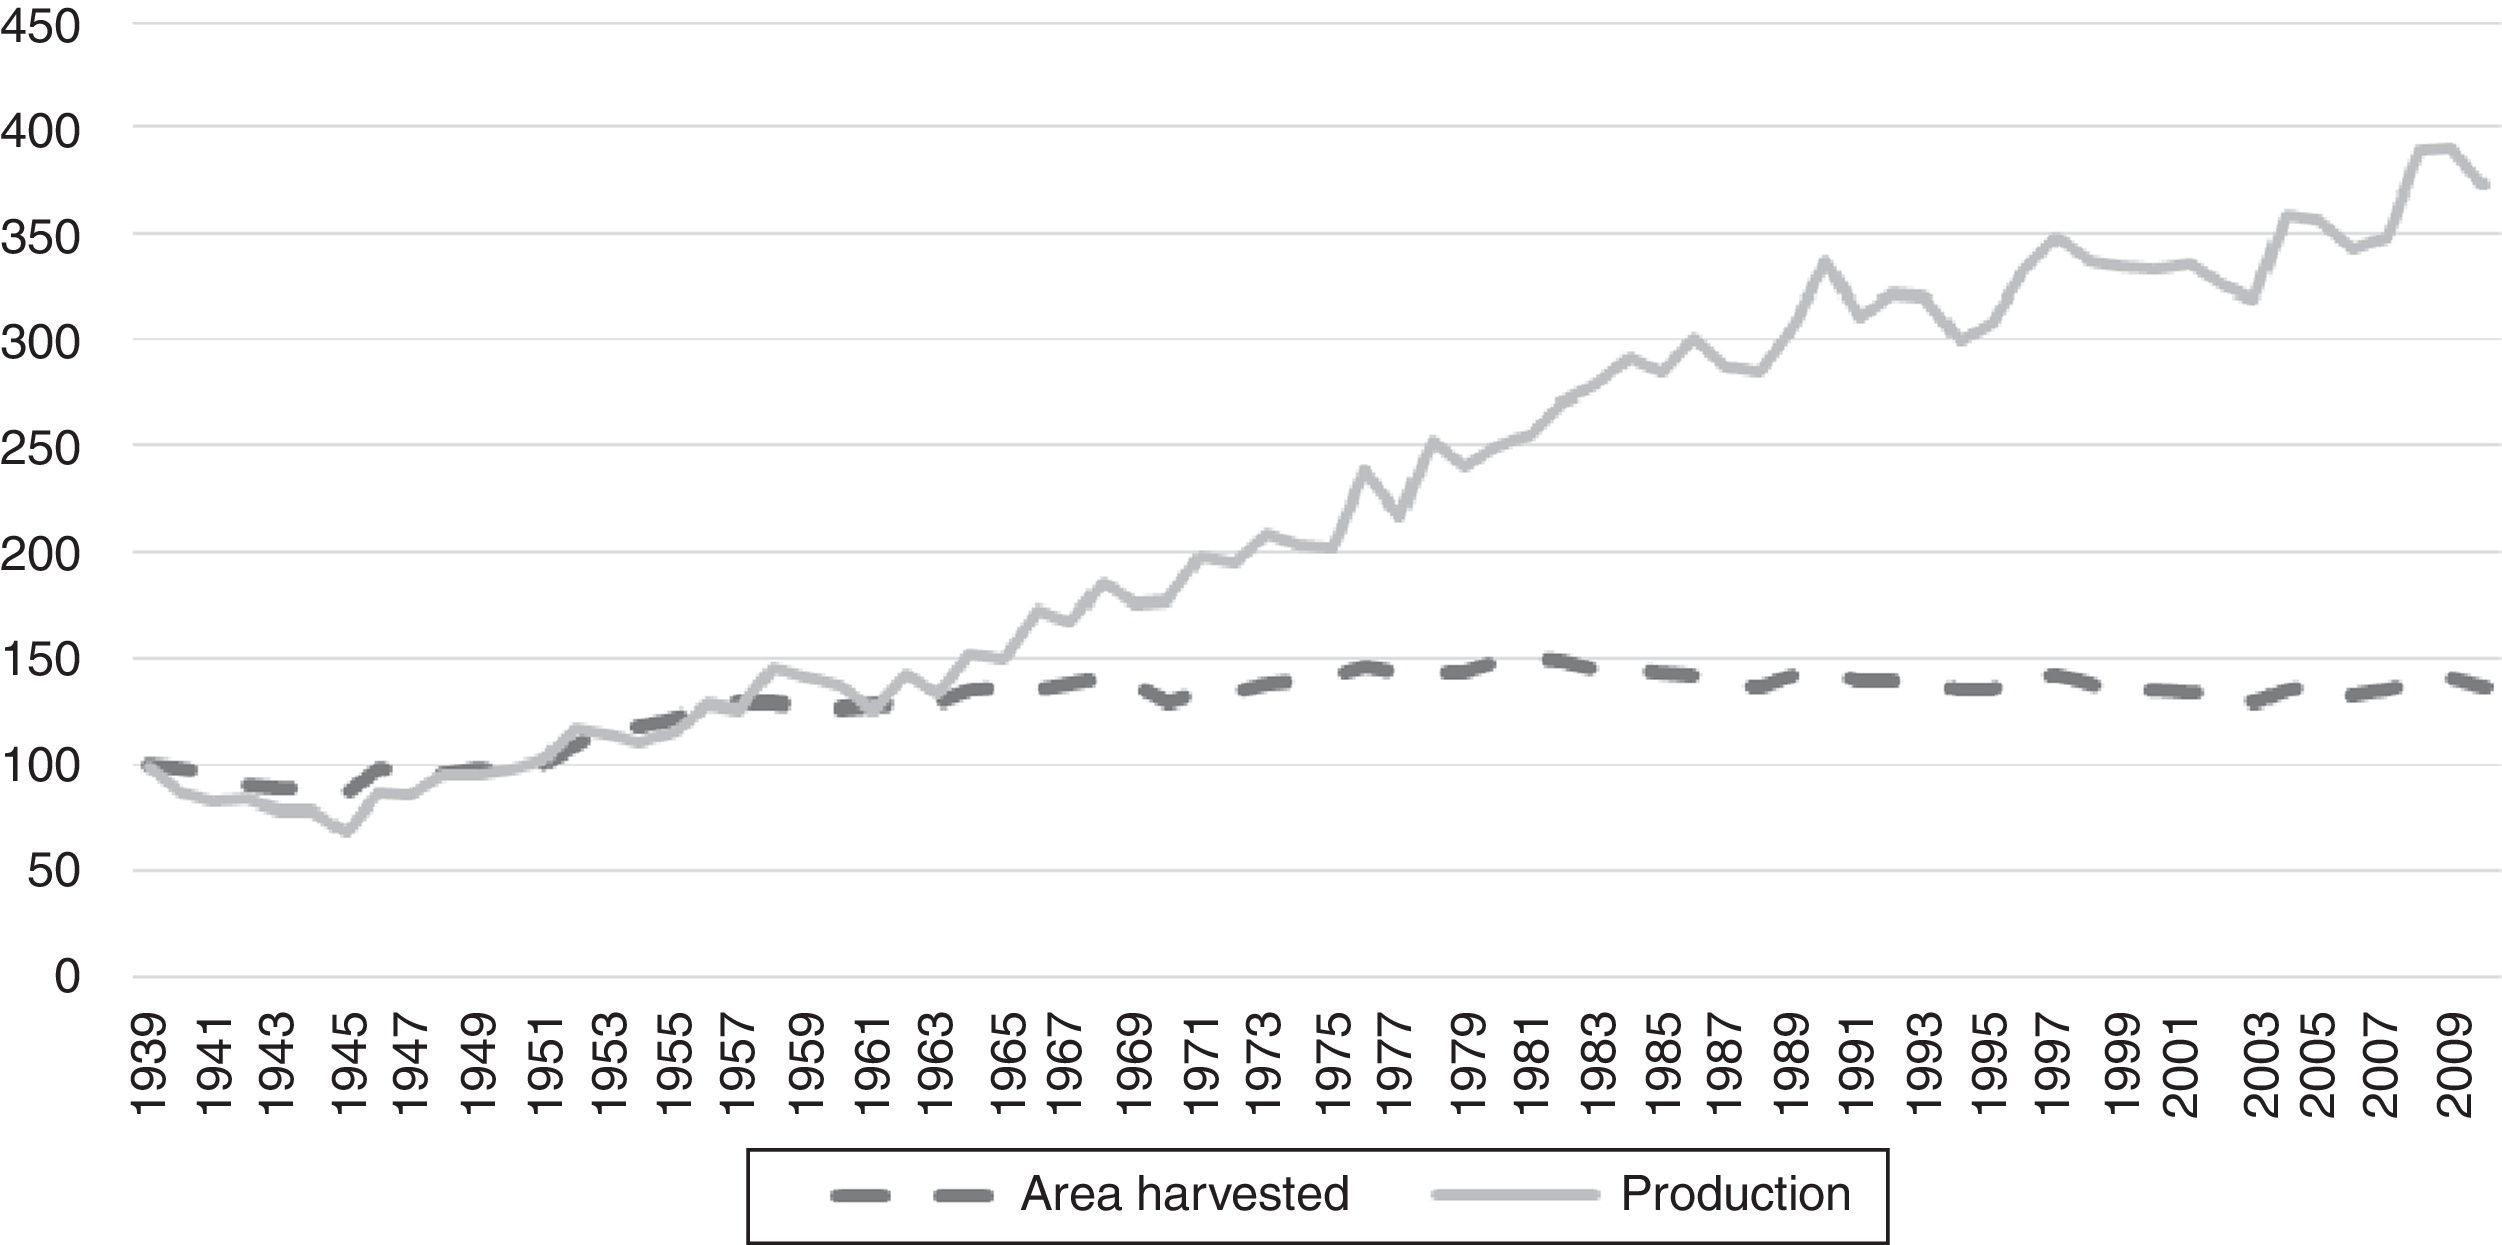
World wheat consumption today is roughly four times what it was in the immediate postwar years. Of course, this has only been possible thanks to a remarkable increase in world wheat supply. Importantly, the extraordinary expansion in wheat production (see Fig. 3) may be considered a somewhat surprising outcome, for two reasons. First, because it has gone hand in hand with an increasingly clear realization that wheat markets are characterized by a persistent tendency toward overproduction. The collapse of wheat markets in the interwar period was mainly due to excess wheat supplies. Overproduction was corrected during the war years, but the main producing nations were beset with the problem of surpluses soon after the war. Wheat production grew so much over the following 40 years that it was claimed that “for the time being, Malthusian prophecies of food scarcities are wrong, at least from the perspective of the North American wheat farmer without whom Malthus might have been right. The question today is the same as it was in the time of the mercantilists: what can we do to sell more goods abroad?” (Dennis, 1987, p. 3). Thus, global wheat production has grown significantly, even when it represented a crucial problem for producers in the main exporting countries, and despite policies often being aimed at limiting output.
 wheat production and area harvested (1939=100).")
The second reason why the growth of wheat production may be surprising is because the global amount of land devoted to growing wheat has not expanded much over the studied period (moreover, it began a downward trend in the 1980s). Production of wheat tended to be highly correlated with acreage in the period before World War II. In fact, it can be said that the general movement of the world wheat output was almost exclusively caused by changes in the acreage sown. According to Malembaum's data and calculations, the coefficient of correlation of world production and world acreage for the period 1885/86 – 1938/39 was 0.983 (Malembaum, 1953, p. 25), this is no longer the case from the mid-1960s onwards. Our estimates of the coefficient of correlation are 0.741 for the period 1939–2010 and only 0.208 for the period 1961–2010. This was indeed a key change in the history of wheat production, since the quantity of land devoted to growing wheat ceased to be the chief determinant of total wheat output after the widespread adoption of new production techniques and inputs in the 1960s and 1970s. This outstanding break with the past may be better observed in Fig. 3, and had much to do with the availability of new wheat breeds suitable for moist growing areas, such as found in Brazil, India, and Mexico (Whitman, 1989). The earliest programs of improved plant varieties, mechanization and commercially produced pesticides, herbicides, and fungicides – the package usually known as the Green Revolution – were initiated by the US foundations and a U.S. government agency but were soon adopted in developing countries (Darlymple, 1974). The new high-yielding semi-dwarf varieties were developed by the Centro Internacional de Mejoramiento de Maíz y Trigo (CIMMYT) in Mexico, and adapted to local conditions. The whole Green Revolution package was very similar to the technology which had already been introduced in North America and western Europe from the late 19th Century, and allowed for an extraordinary increase in yields in both industrialized and developing countries.
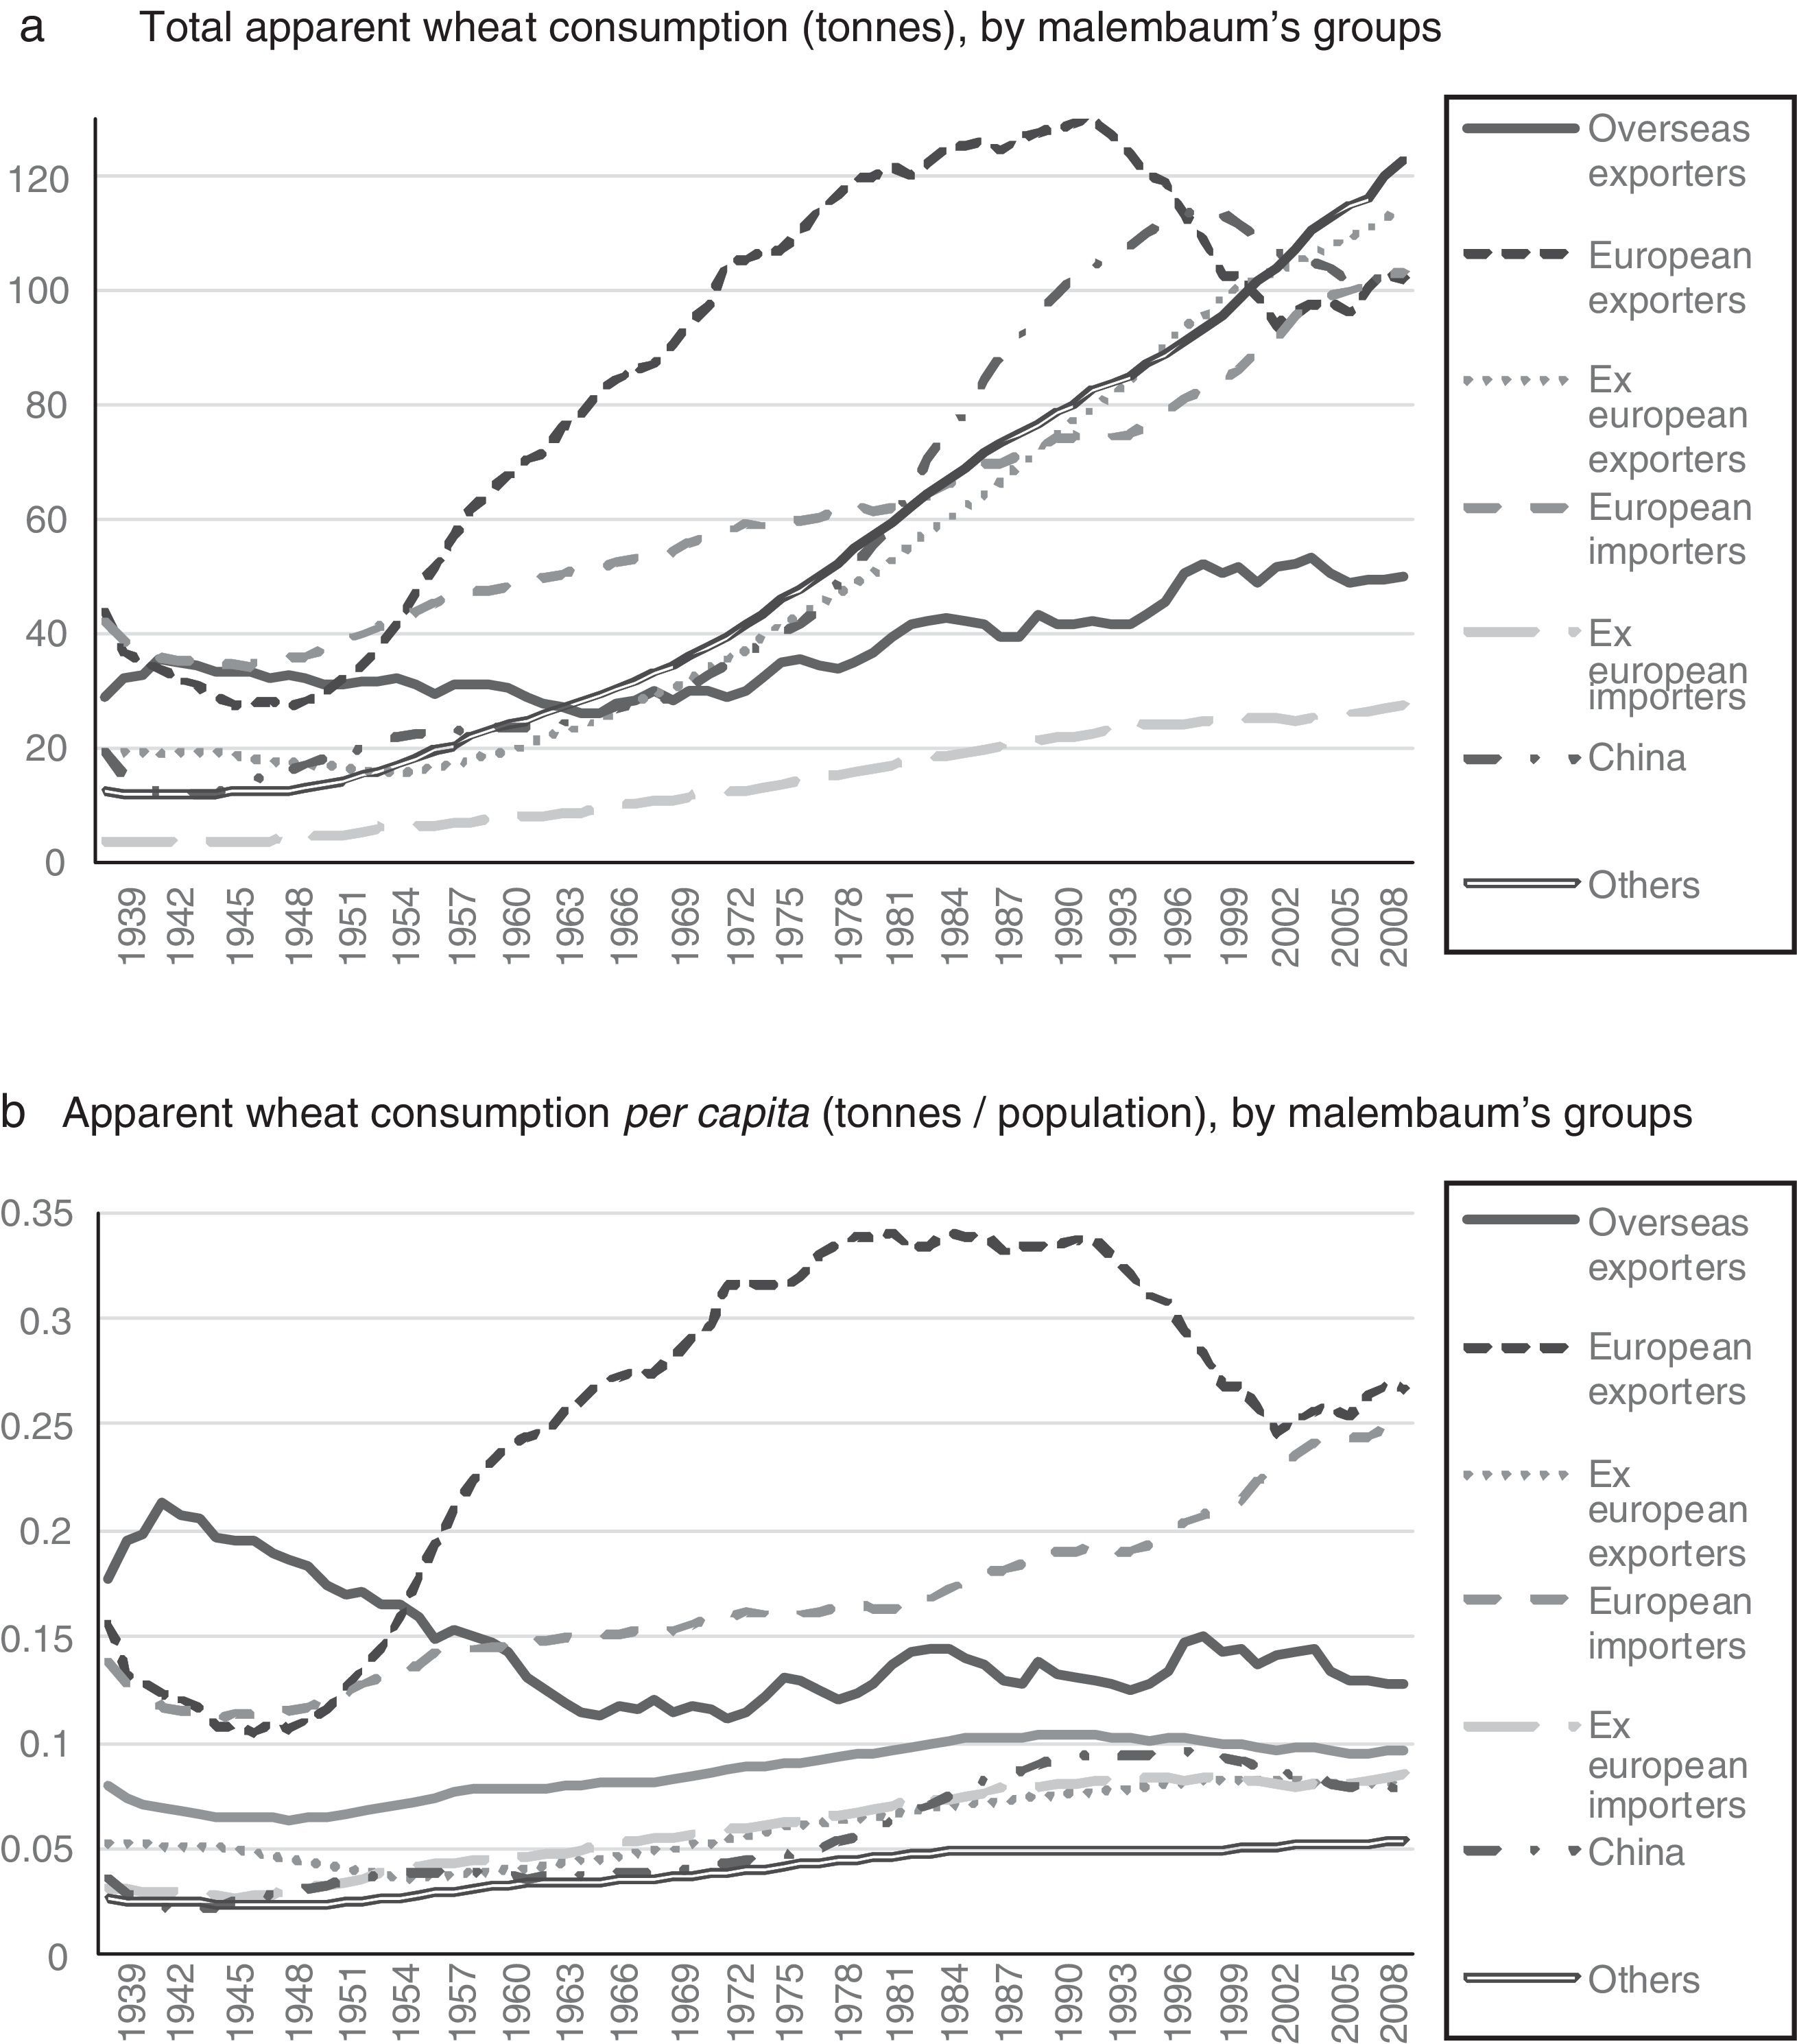
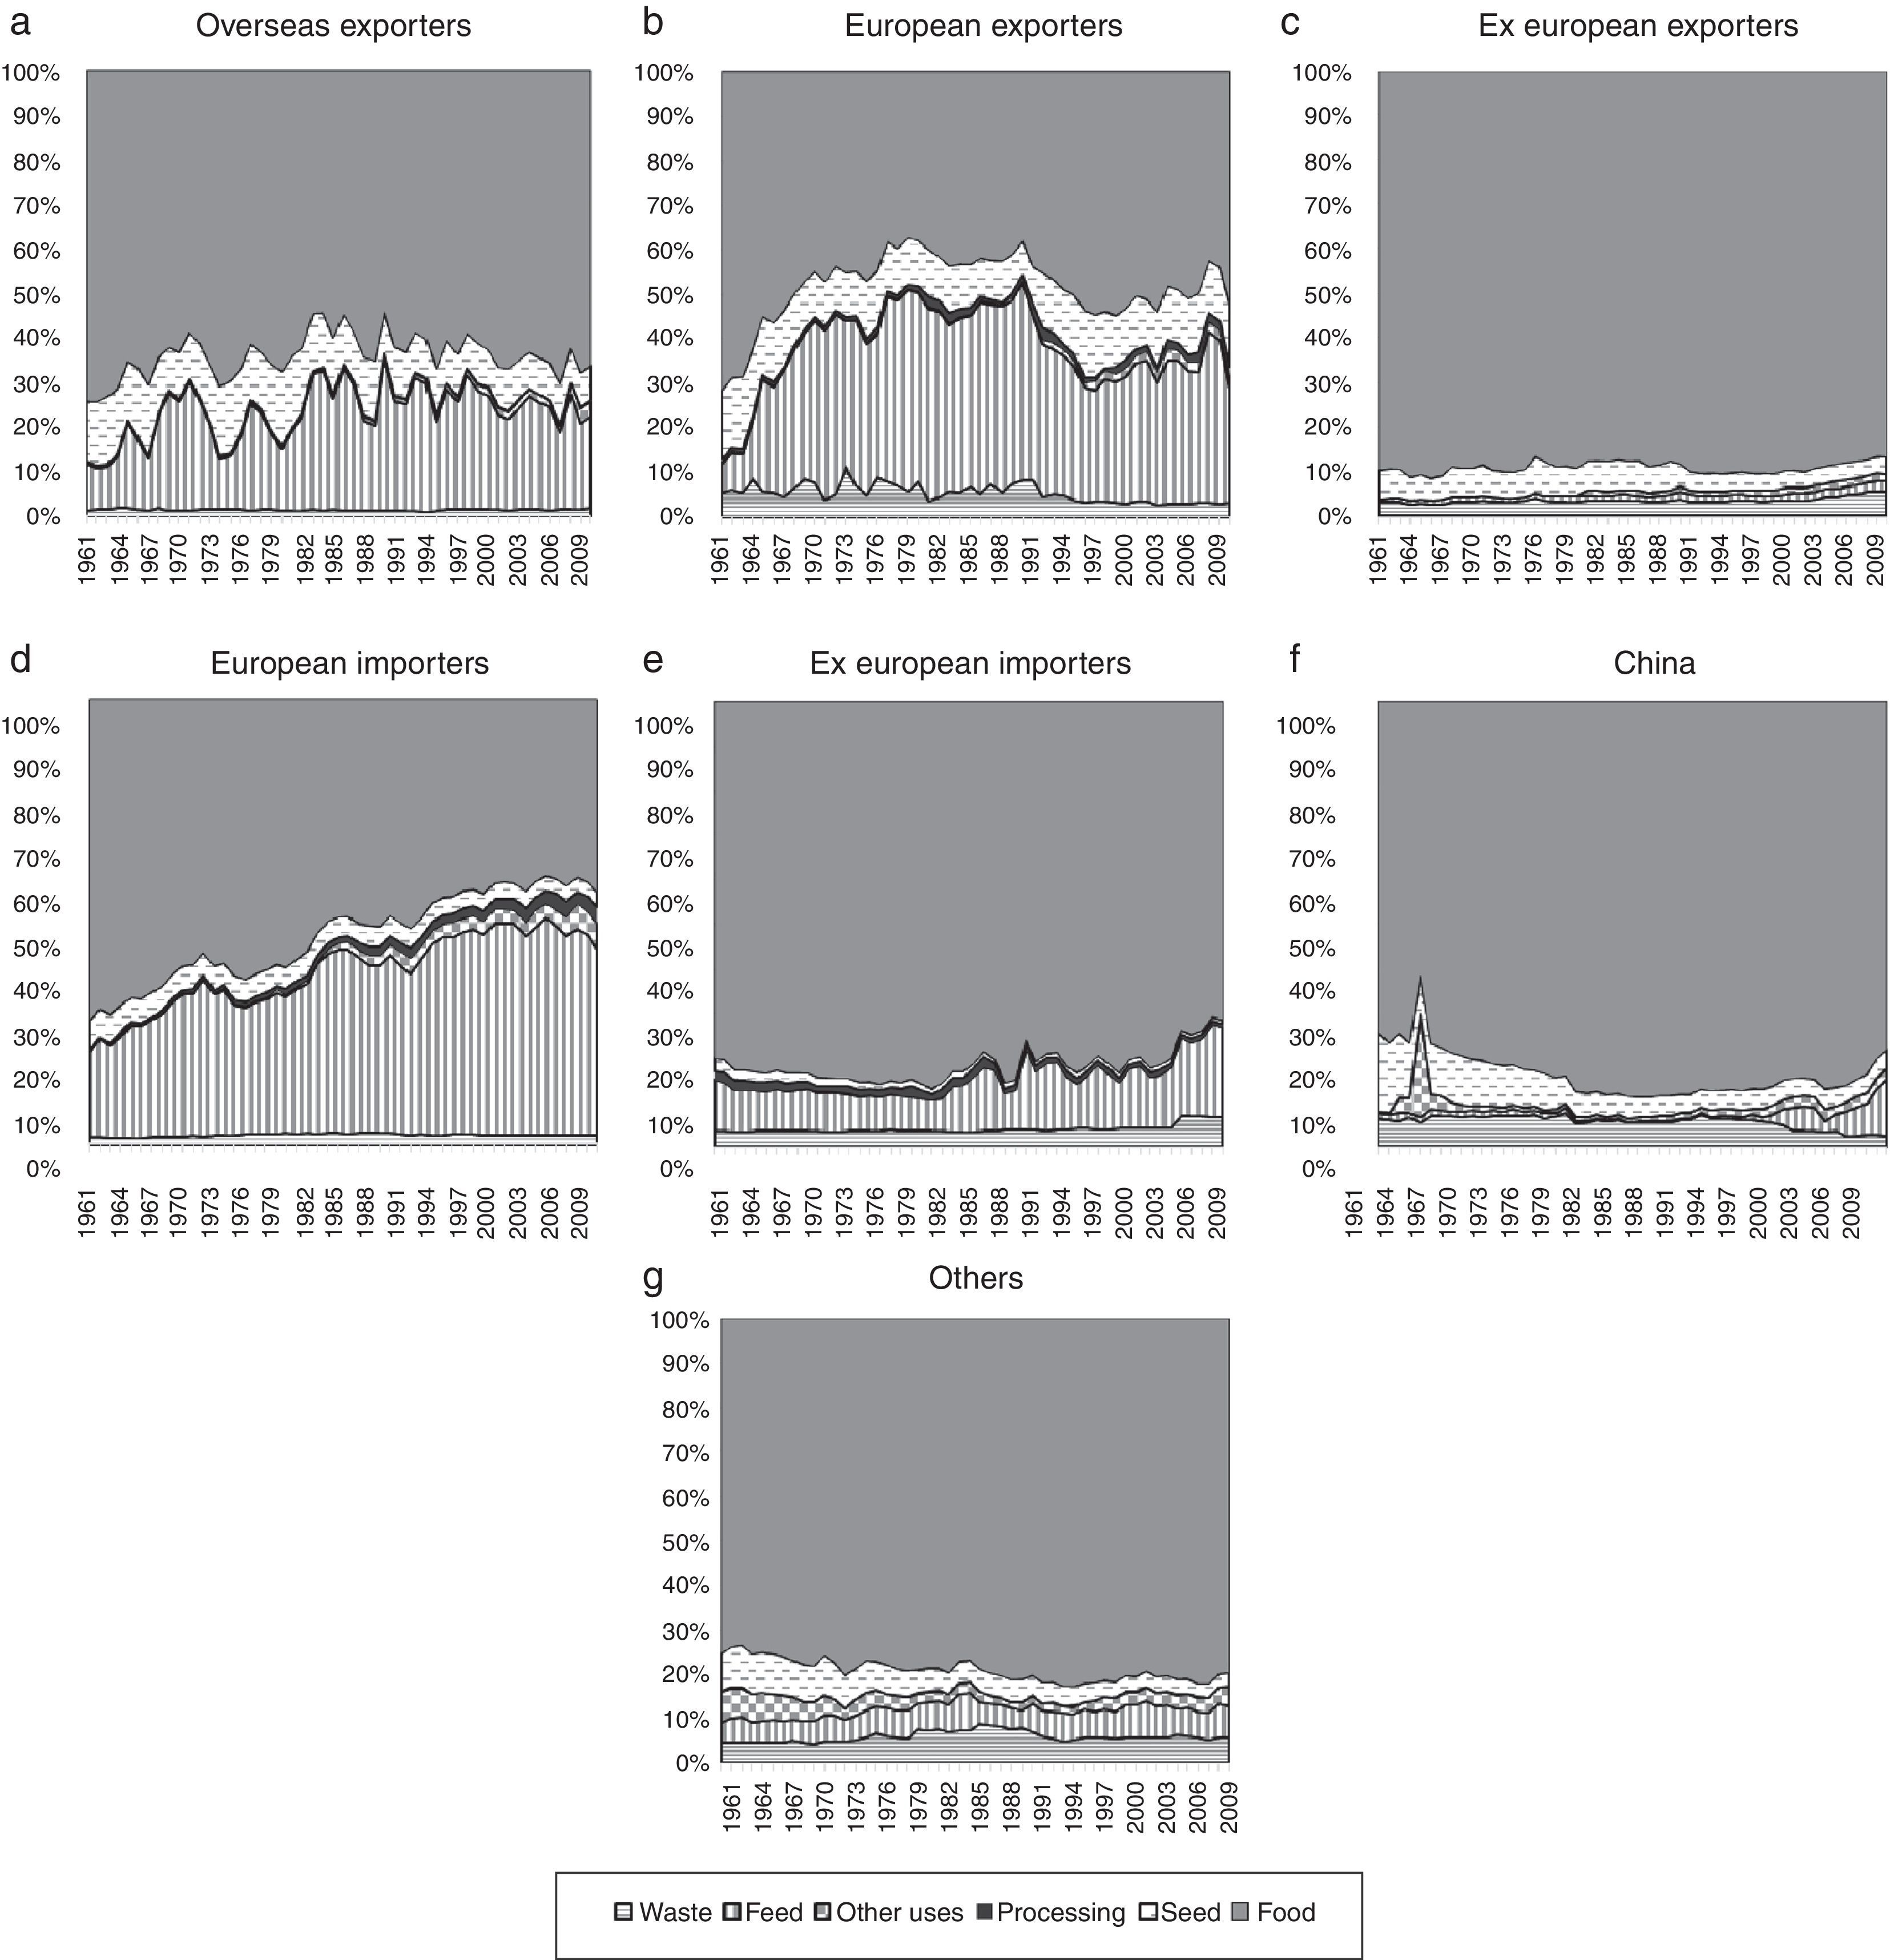
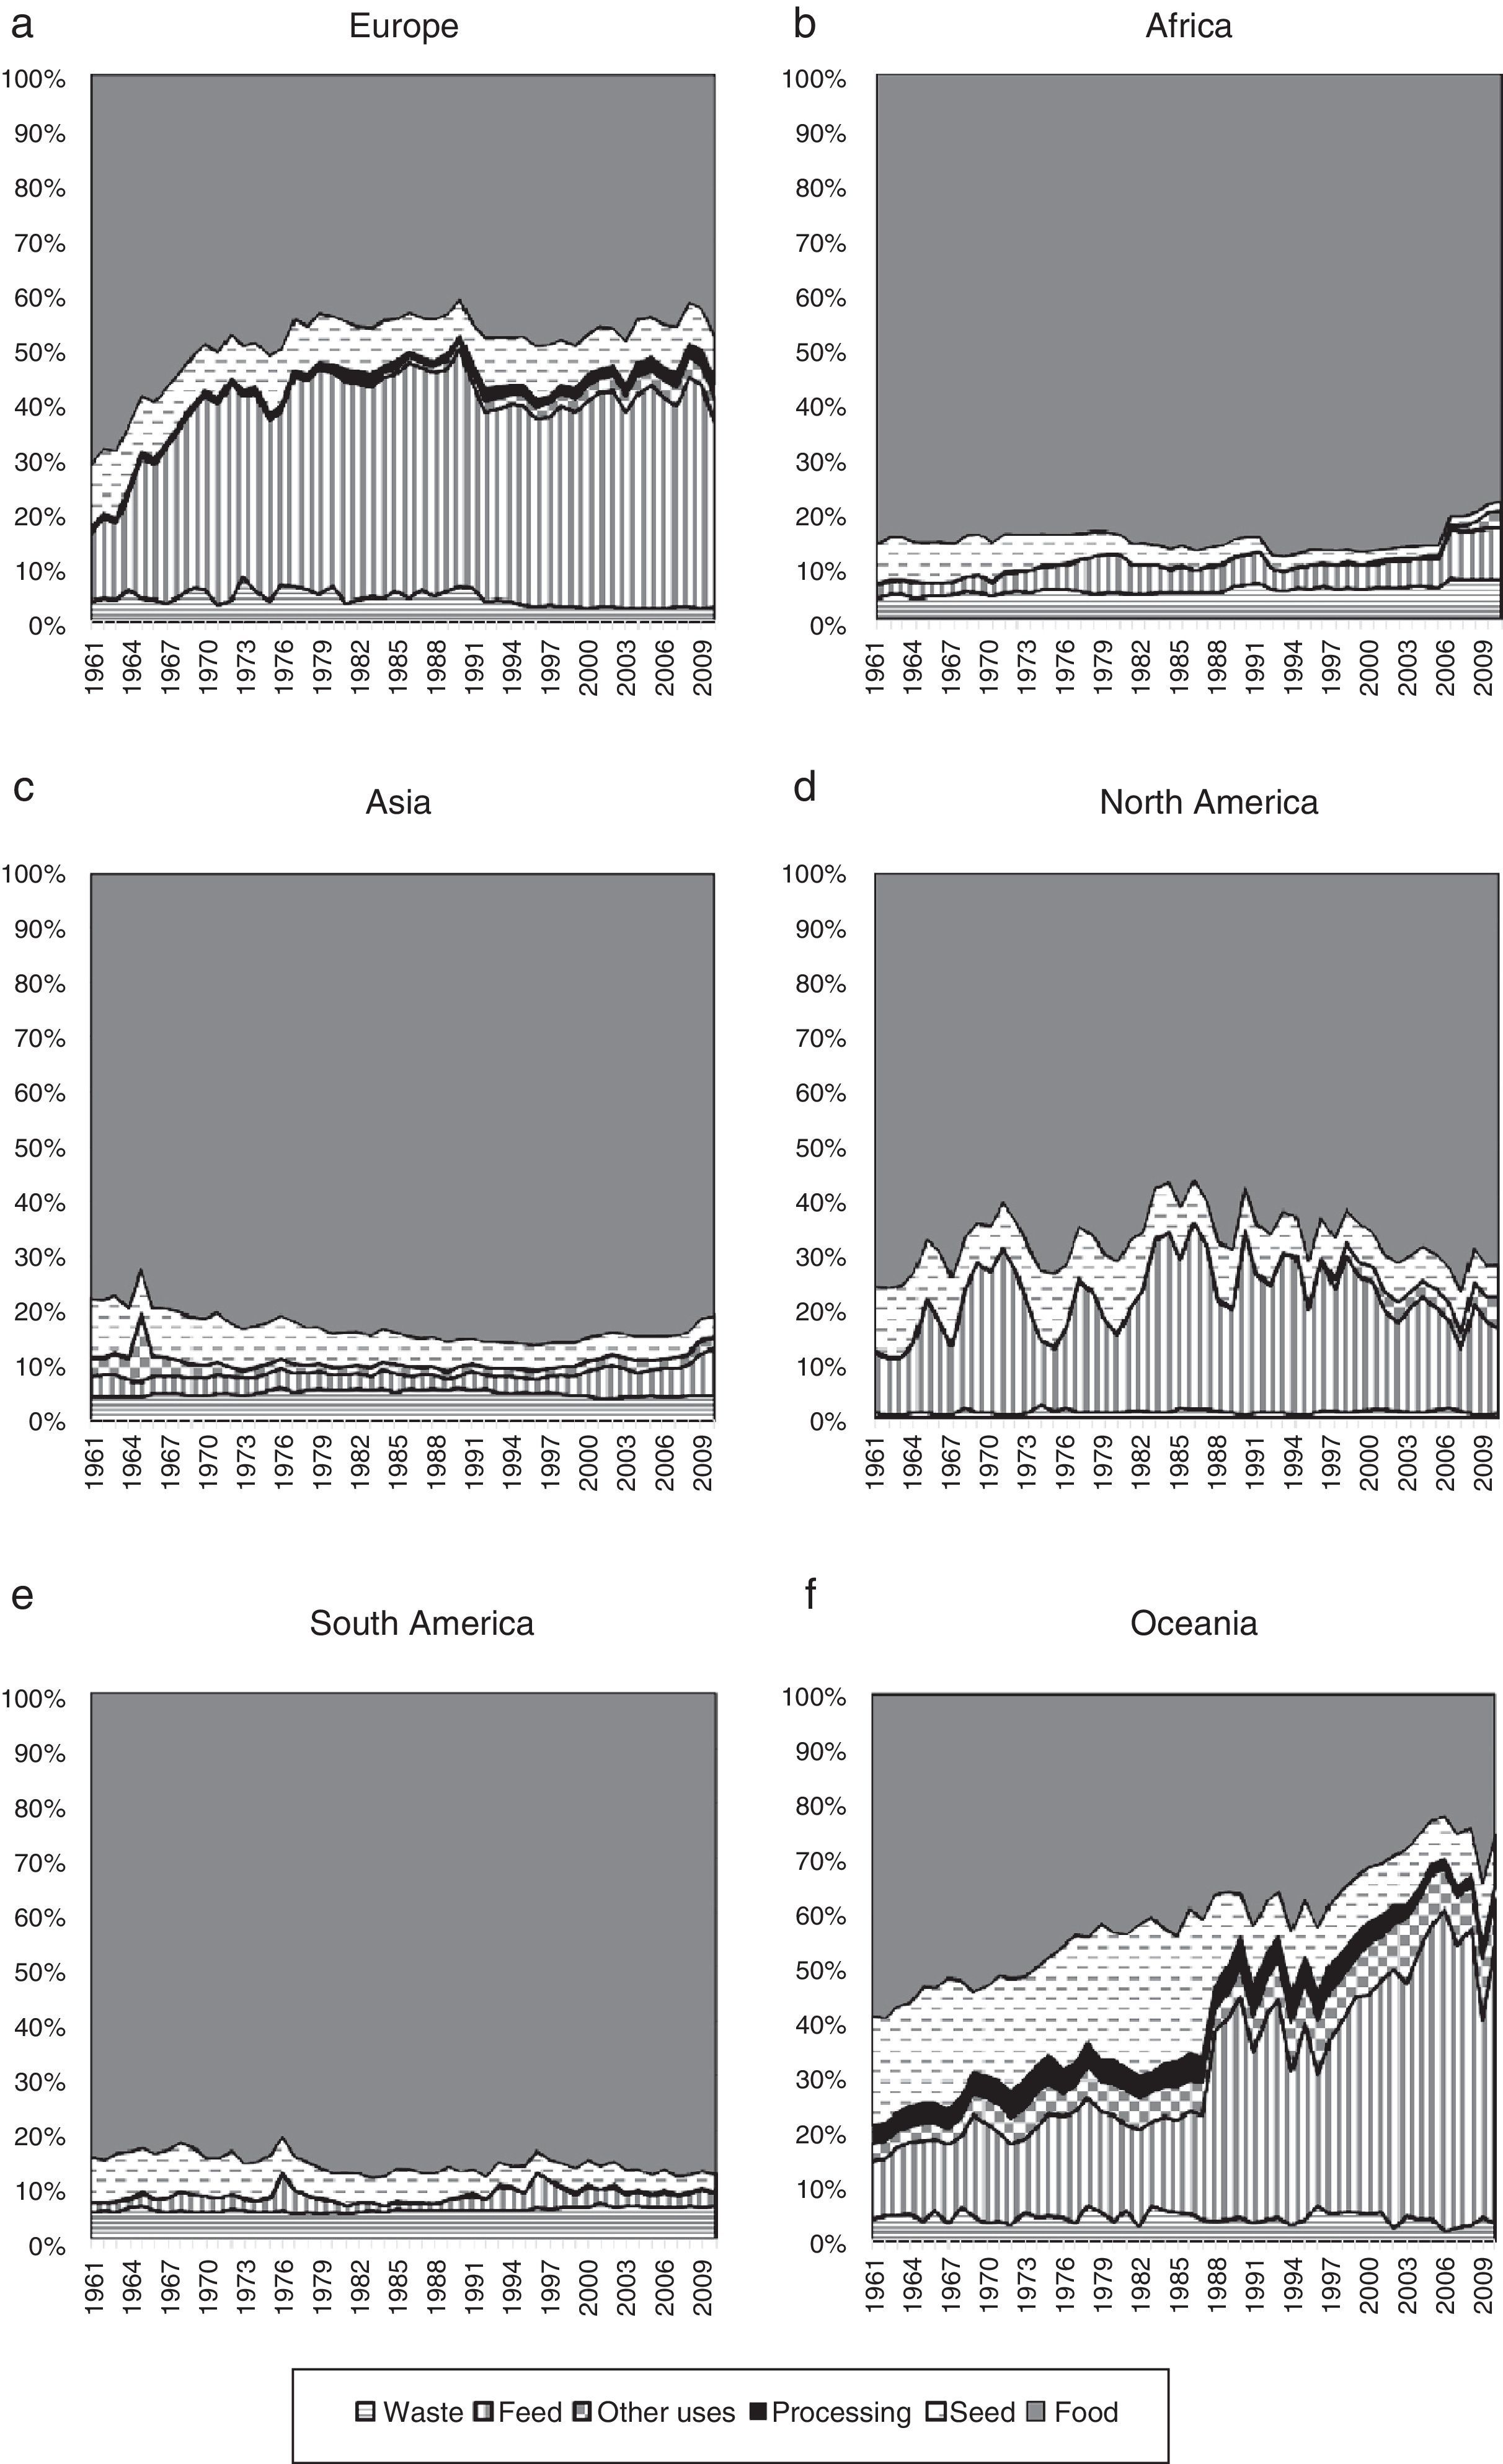
3.3The evolution of world wheat consumptionAt the beginning of the Second World War, Europe accounted for more than 50% of total world consumption and Asian citizens consumed roughly half of the remaining 50%. While North American consumption was also important in relative terms – particularly in the immediate post-war years – African demand for wheat was insignificant when compared to that of their European and North American counterparts (both in absolute and in per capita terms). The group of countries not considered by Malembaum consumed less than 10% of world wheat production. Yet this situation would change dramatically in the following 70 years. Fig. 4 illustrates the evolution of wheat consumption by continents and by Malembaum's groups of countries.11 Importantly, these are series of apparent consumption, which means – among other things – that no distinction is made between different wheat end-uses. This is why our discussion will be complemented with multiple references to Figs. 5–8 (see the appendix). Figs. 5 and 6 show the evolution of wheat end-uses – food, feed, seed, processing, waste and other uses – by continents and groups. For instance, they illustrate the changing importance of wheat used as feed and allows to see that, in certain countries, wheat fed to livestock has been particularly relevant. Since wheat is primarily utilized as food, Figs. 7 and 8 show the major trends in direct human consumption of wheat. These figures are expressed in per capita terms, and compare the evolution of wheat with that of other staples such as millet, sorghum and other cereals. Thus, they are useful to understanding major dietary changes by groups of countries.
 Total apparent wheat consumption (tons), by Malembaum's groups. (b) Apparent wheat consumption per capita (tons/population), by Malembaum's groups. (c) Wheat consumption shares (% of world consumption), by Malembaum's groups. (d) Total apparent consumption (tons), by continent. (e) Apparent wheat consumption per capita (tons/population), by continent. (f) Wheat consumption shares (% of total consumption), by continent.")
 Total apparent wheat consumption (tons), by Malembaum's groups. (b) Apparent wheat consumption per capita (tons/population), by Malembaum's groups. (c) Wheat consumption shares (% of world consumption), by Malembaum's groups. (d) Total apparent consumption (tons), by continent. (e) Apparent wheat consumption per capita (tons/population), by continent. (f) Wheat consumption shares (% of total consumption), by continent.")
 Total apparent wheat consumption (tons), by Malembaum's groups. (b) Apparent wheat consumption per capita (tons/population), by Malembaum's groups. (c) Wheat consumption shares (% of world consumption), by Malembaum's groups. (d) Total apparent consumption (tons), by continent. (e) Apparent wheat consumption per capita (tons/population), by continent. (f) Wheat consumption shares (% of total consumption), by continent.")
Wheat consumption by Malembaum's groups and by continent, 1939–2010. (a) Total apparent wheat consumption (tons), by Malembaum's groups. (b) Apparent wheat consumption per capita (tons/population), by Malembaum's groups. (c) Wheat consumption shares (% of world consumption), by Malembaum's groups. (d) Total apparent consumption (tons), by continent. (e) Apparent wheat consumption per capita (tons/population), by continent. (f) Wheat consumption shares (% of total consumption), by continent.
 Overseas Exporters, (b) European Exporters, (c) Ex European Exporters, (d) European Importers, (e) Ex European Importers, (f) China and (g) Others.")
 Europe, (b) Africa, (c) Asia, (d) North America, (e) South America and (f) Oceania.")
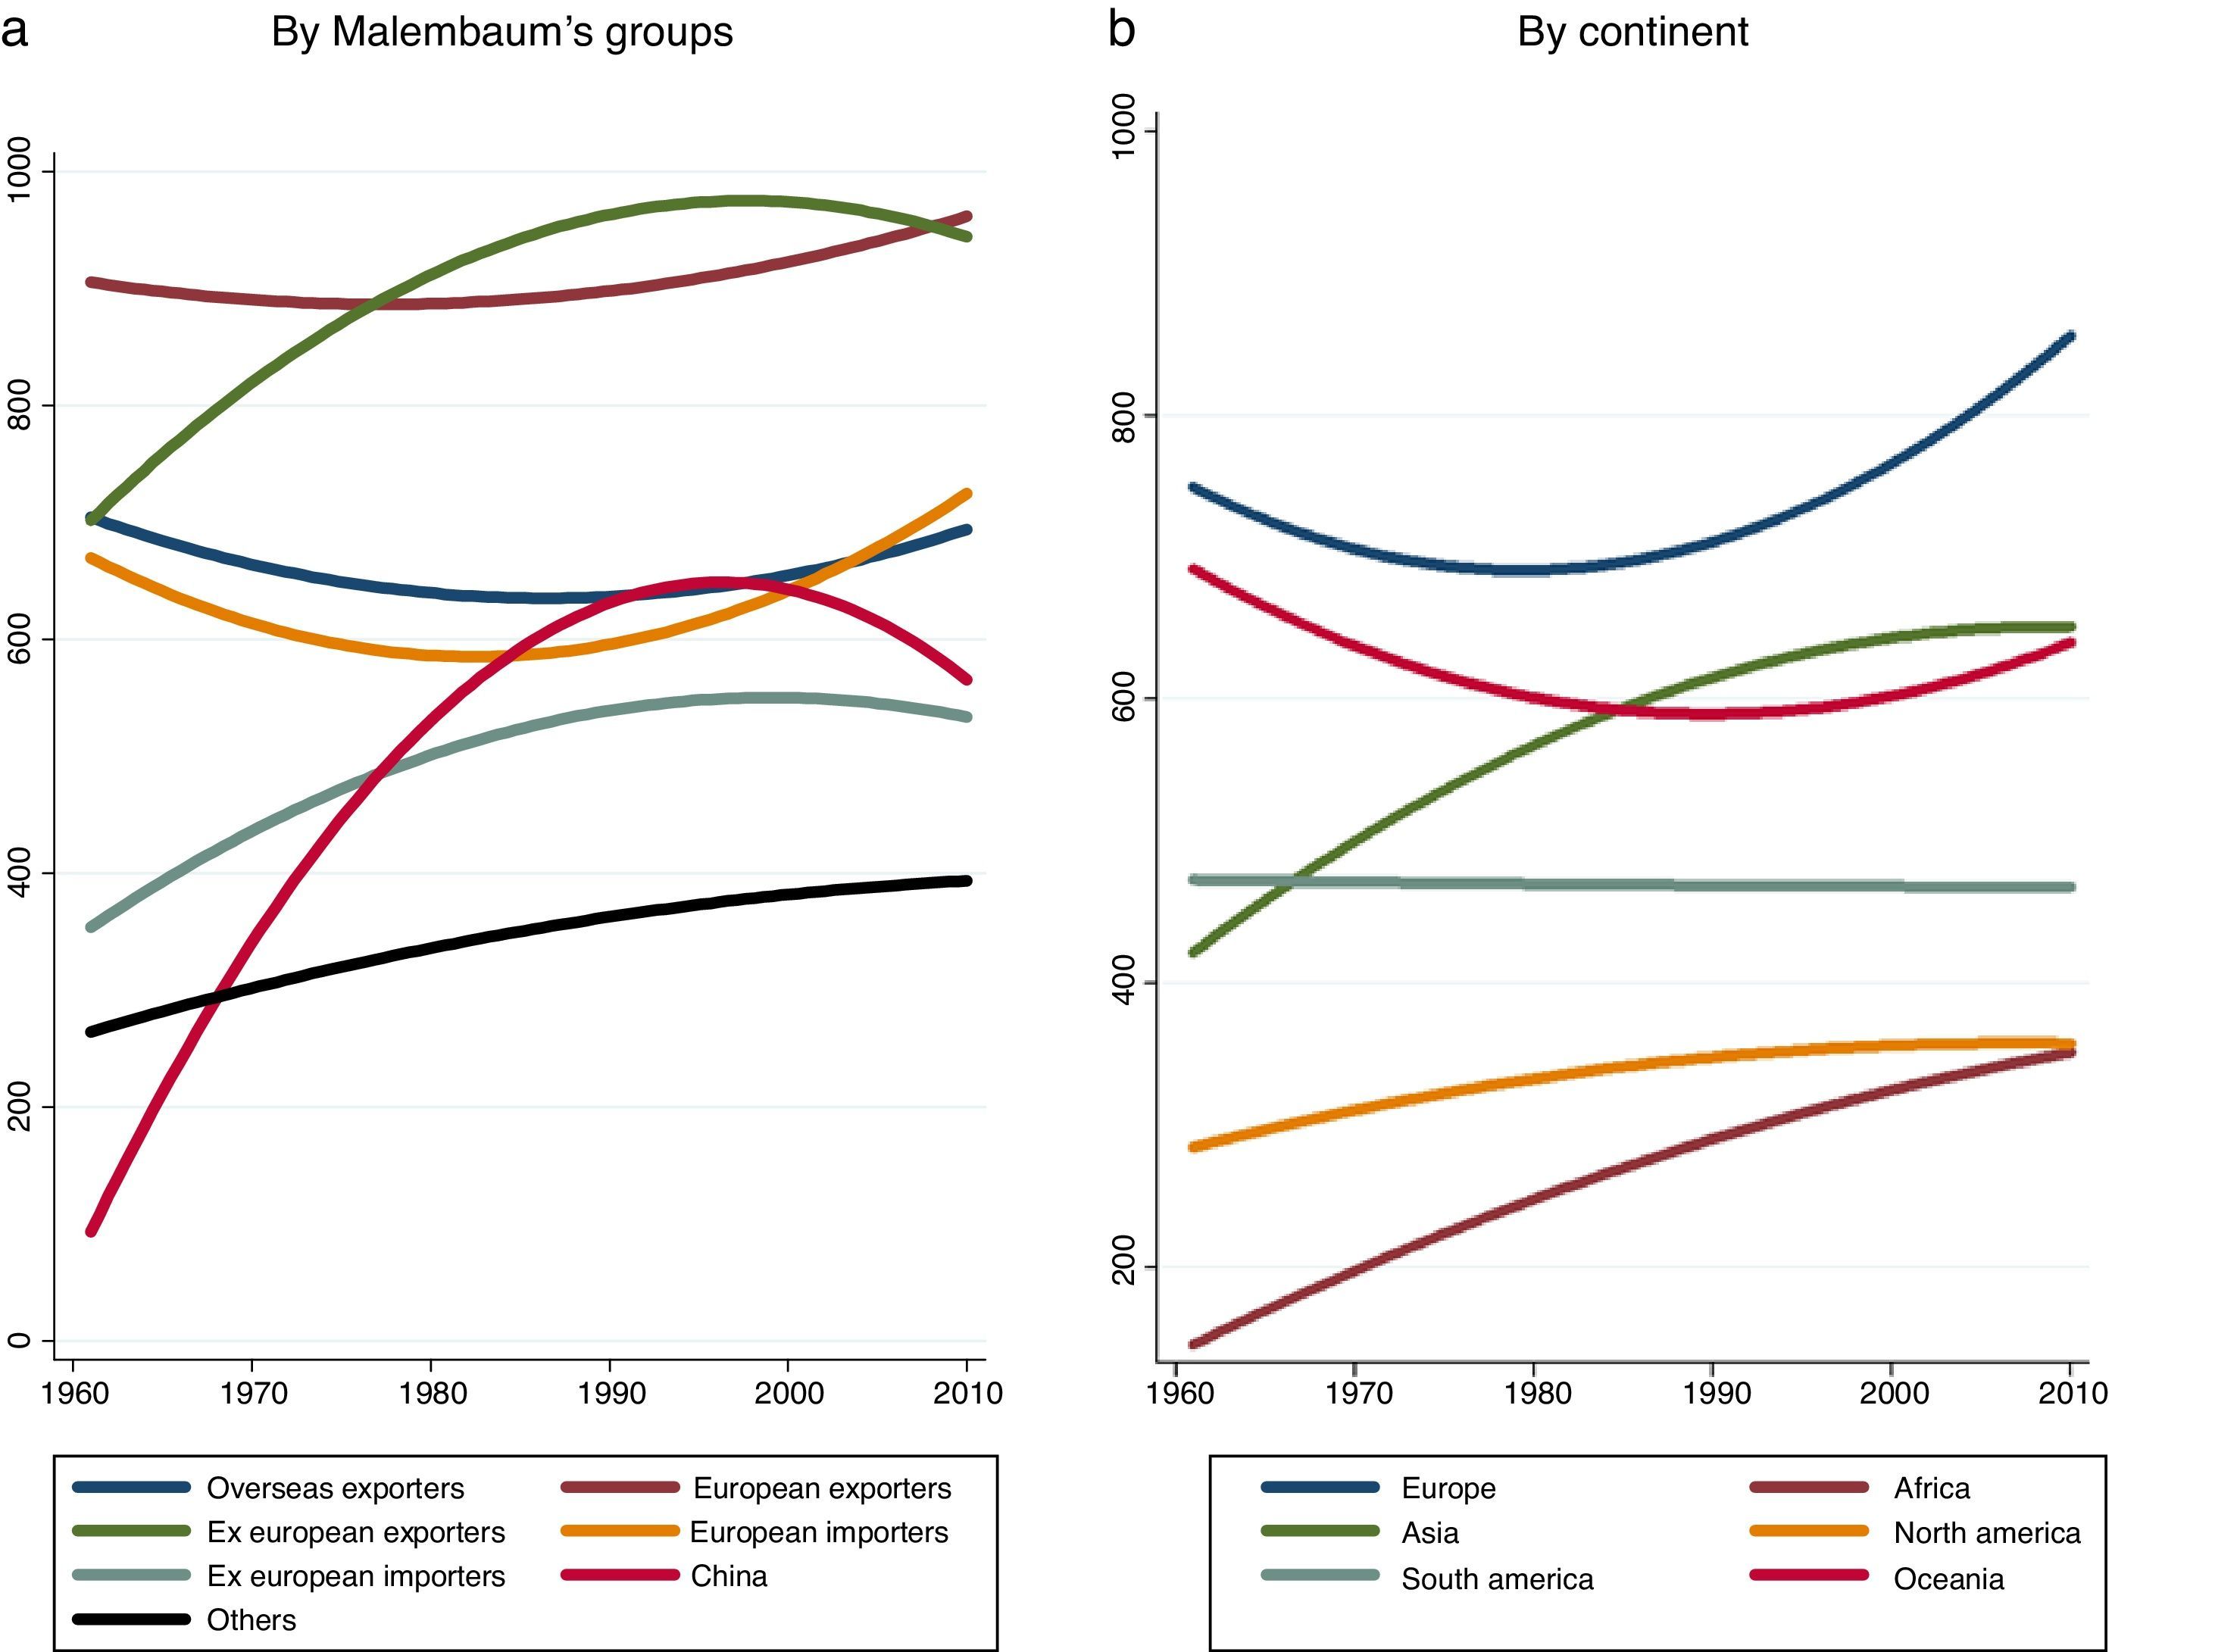
, by Malembaum's groups and by continent, 1961–2010*. (a) By Malembaum's groups; (b) by continent.")
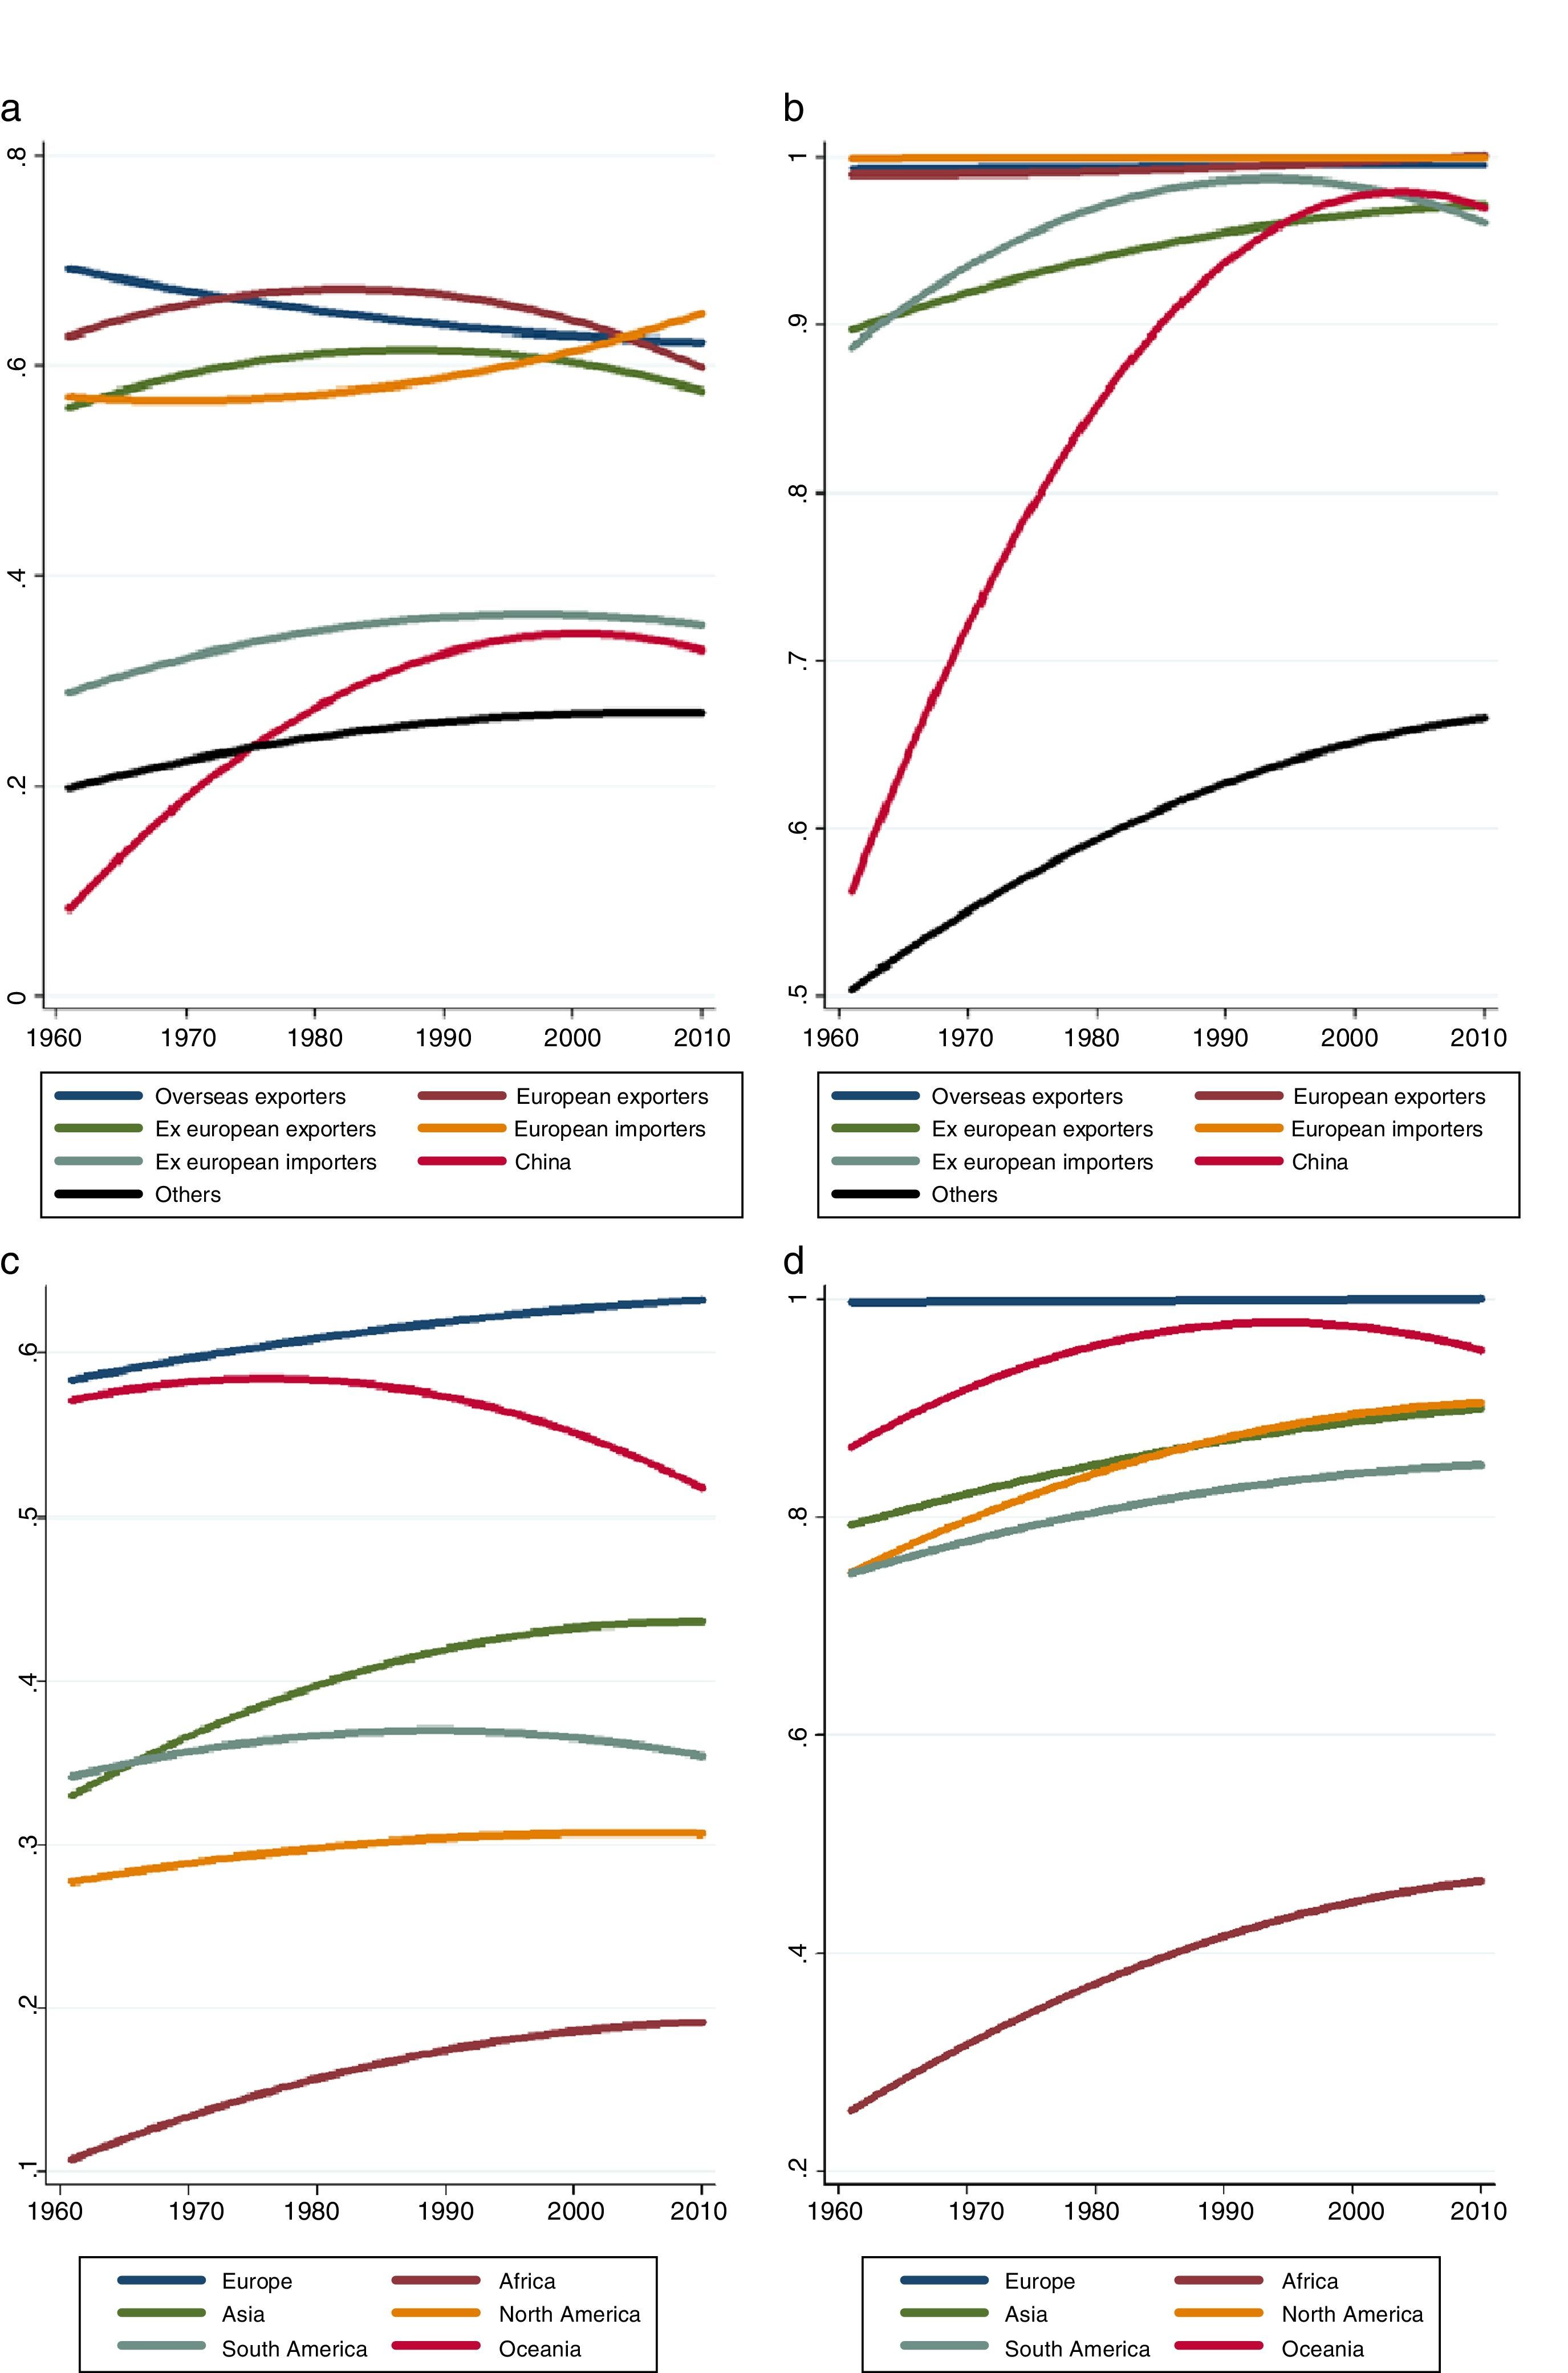
![Wheat consumption per capita in relation to consumption of other staples, by continents and Malembaum's groups, 1961–2010. (a) (Left) Wheat consumption (kcal/capita/day)/[total consumption of cereals+cassava+starchy roots+roots tuber+other roots (kcal/capita/day)]. (b) (Right) Wheat consumption (kcal/capita/day)/[total consumption of wheat+millet+sorghum+cassava (kcal/capita/day)]. (c) (Left) Wheat consumption (kcal/capita/day)/[total consumption of cereals+cassava+starchy roots+roots tuber+other roots (kcal/capita/day)]. (d) (Right) Wheat consumption (kcal/capita/day)/[total consumption of wheat+millet+sorghum+cassava (kcal/capita/day)].](https://static.elsevier.es/multimedia/16986989/0000001300000003/v5_201801151140/S1698698917300632/v5_201801151140/en/main.assets/gr8.jpeg?xkr=ue/ImdikoIMrsJoerZ+w997EogCnBdOOD93cPFbanNfwBVf13yd2AqkKyCEtBSExof4GaNcIGcnk9ckI755EMOZJMFKy2RS2qxMSfaza+D5uFxkypscb95rUwOs0vfXOHuMt94sJsJcg4niHONqt4LJYRuje7720s1gwoE8Tjt1XArYKbrYXtJT6oIZc/yHu142SooA3iMcxR2VwyoBW8425zAG7LOmot2gGq//5ptFhWJxy+JzKQyCe+Bn0UA9rLPvN96drefToLg0q8GaqkL7mMPHBYoj5Tx4P56wGuegiiegNWVFI1gUBt0zXIRRJ+vzf5HbI+FmtKFShURyWUw== "Wheat consumption per capita in relation to consumption of other staples, by continents and Malembaum's groups, 1961–2010. (a) (Left) Wheat consumption (kcal/capita/day)/[total consumption of cereals+cassava+starchy roots+roots tuber+other roots (kcal/capita/day)]. (b) (Right) Wheat consumption (kcal/capita/day)/[total consumption of wheat+millet+sorghum+cassava (kcal/capita/day)]. (c) (Left) Wheat consumption (kcal/capita/day)/[total consumption of cereals+cassava+starchy roots+roots tuber+other roots (kcal/capita/day)]. (d) (Right) Wheat consumption (kcal/capita/day)/[total consumption of wheat+millet+sorghum+cassava (kcal/capita/day)].")
Wheat consumption per capita in relation to consumption of other staples, by continents and Malembaum's groups, 1961–2010. (a) (Left) Wheat consumption (kcal/capita/day)/[total consumption of cereals+cassava+starchy roots+roots tuber+other roots (kcal/capita/day)]. (b) (Right) Wheat consumption (kcal/capita/day)/[total consumption of wheat+millet+sorghum+cassava (kcal/capita/day)]. (c) (Left) Wheat consumption (kcal/capita/day)/[total consumption of cereals+cassava+starchy roots+roots tuber+other roots (kcal/capita/day)]. (d) (Right) Wheat consumption (kcal/capita/day)/[total consumption of wheat+millet+sorghum+cassava (kcal/capita/day)].
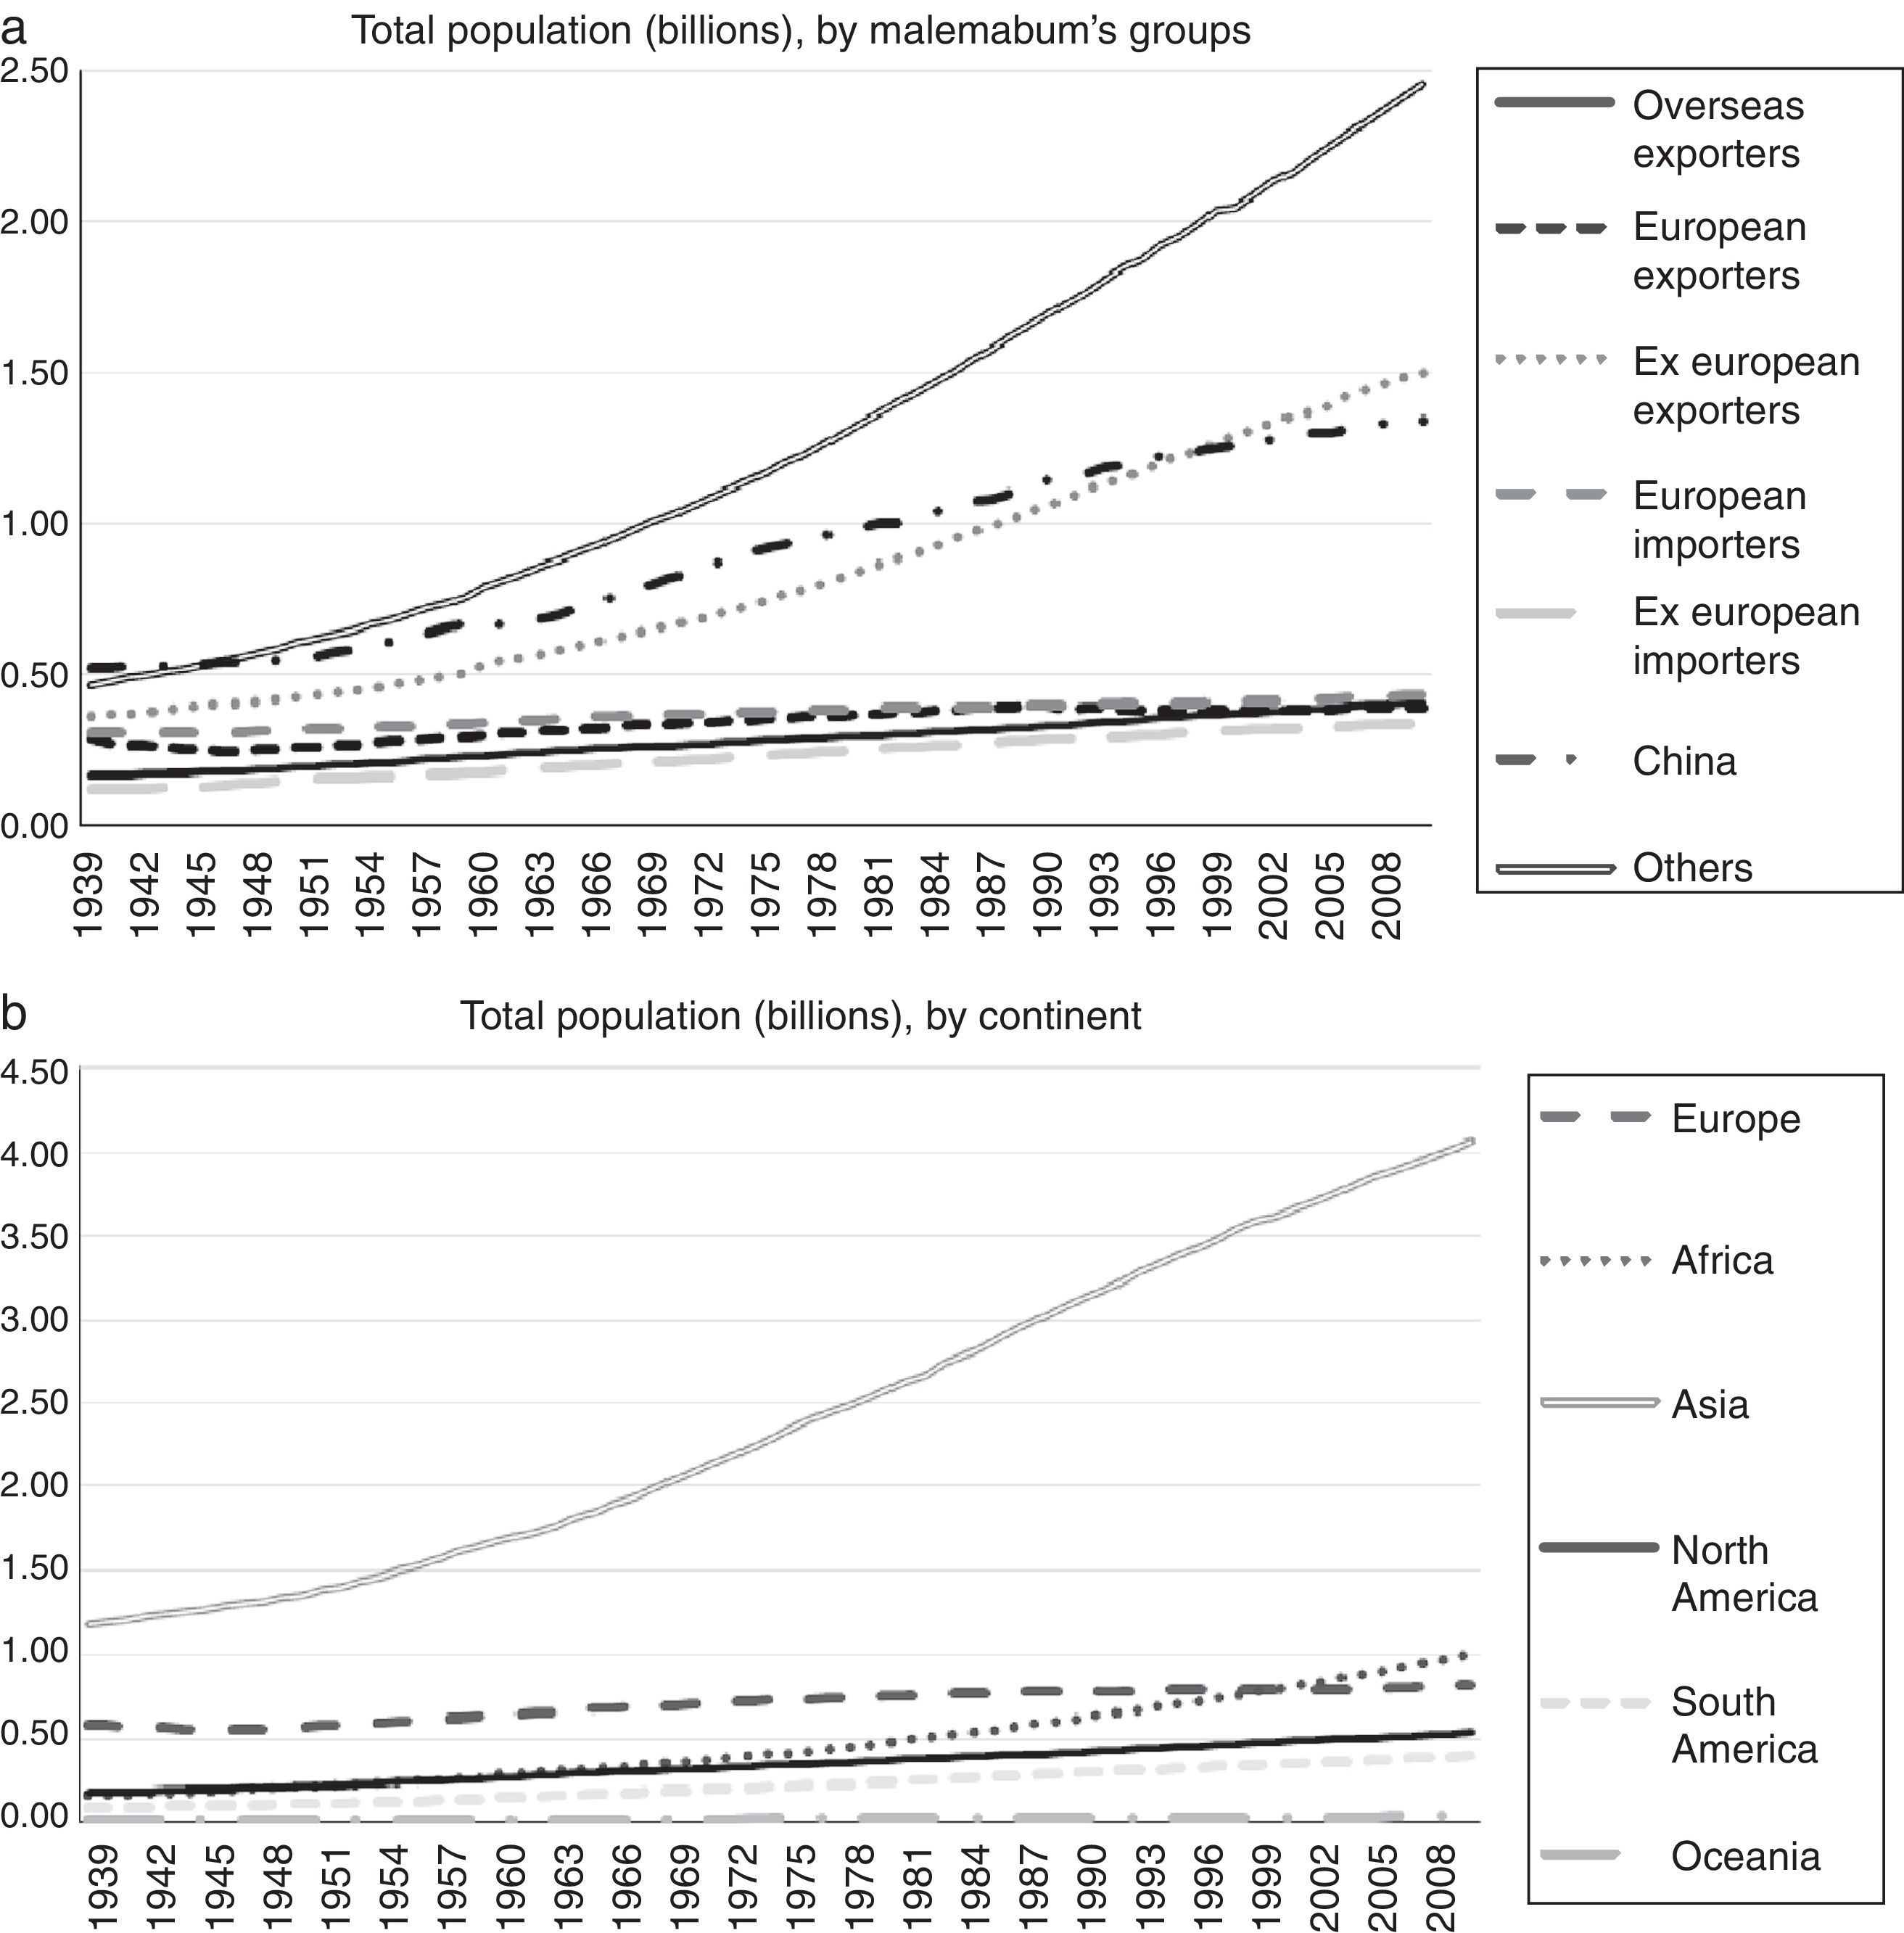
 Total population (billions), by Malemabum's groups. (b)Total population (billions), by continent.")
With regard to the evolution of wheat demand by continents and groups of countries, the most interesting facts are: (1) the growing wheat consumption in the group of ‘others’, which has much to do with (2) the spectacular growth of wheat consumption in Asia; (3) the increasing wheat demand in the group of European exporters between 1950 and 1990 and the dramatic fall in the 1990s (mostly in the countries belonging to the former USSR); (4) the growing consumption per capita in the group of European importers and (5) other facts, such as the declining per capita trend in North America between WWII and the 1970s, and the stagnation of wheat consumption per capita in South America throughout the whole period.
The (1) growth in wheat consumption experienced in the group of ‘others’ is key to understanding the new world distribution of wheat demand and the evolution of wheat trade flows over the last 70 years.12 Although there are several exceptions – most notably Turkey, Iran and Iraq – overall wheat consumption in this group of countries was virtually negligible in the 1940s. Today, these countries account for more than 20% of total world consumption. Among the many factors that explain this evolution, one is of crucial importance: population growth. Almost all countries belonging to this group are located in Africa, South/Central America, and South Asia, and most of them fall into the categories of low or lower-middle income according to the World Bank classification (World Bank, 2015). Importantly, population growth in this group of countries has been the strongest among all Malembaum's groups (even stronger than in China, India and other Ex European exporters).13 However, while it is obvious that the rising population has contributed significantly to push up demand, population growth alone cannot explain the increasing wheat consumption in these areas, nor does income growth answer. The other crucial factor is, of course, the transformation of markets and diets that occurred in these countries over the studied period. Overall, people living in these countries today consume twice as much wheat than they did in the postwar years. Average consumption per capita in the group of ‘others’ is still much lower than the world average, yet it should be noted that many of these countries began from a position close to zero consumption in the 1940s. Besides, average trends may conceal higher wheat consumption levels in certain areas – for instance, urban areas – and among specific population groups within those countries. Fig. 5 illustrates that wheat is primarily consumed as food in the group of ‘others’ (i.e., the importance of other uses such as feed to livestock is virtually negligible). This means that increased wheat consumption has displaced other staples as major sources of calories. More specifically, Fig. 8 shows that these countries have substituted wheat for local staples such as cassava, sorghum and millet at a considerable pace. Maize demand has also lost ground in favor of the consumption of wheat-based products.
Therefore, although consumption patterns are heterogeneous across and within countries belonging to this group, most of them share certain characteristics. Following Byerlee (1987) and González Esteban (2017b), domestic wheat consumption in a country is directly determined by population, consumer income, the set of relative prices of wheat and competing staples, and consumer preferences. It has already been mentioned that population growth has been remarkable in these countries. Some studies also point to rising incomes as a key driver of growing wheat consumption in developing countries (Mason et al., 2012). Yet the discussion of the main drivers of consumer preferences is inherently complex: preferences are dependent on culture, income, and relative prices, but also on policies and market promotion. With regard to international policies, a crucial feature of international wheat markets over the second half of the 20th Century has been wheat aid being shipped to developing countries (Schultz, 1960; Maxwell and Singer, 1979; Friedmann, 1992). In fact, many of the countries belonging to the group of ‘others’ have been the recipients of vast amounts of wheat aid – wheat at reduced prices – proceeding from the main exporting nations. The United States began to ship subsidized wheat to a great number of developing countries as soon as 1949 (Morgan, 1979, 116), but it was not until 1954 when P.L. 480 – commonly known as the Food for Peace Act – was approved and wheat aid was institutionalized on a global scale (Vellianitis-Fidas and Marsar Manfredi, 1977; Vengroff and Mei Tsai, 1982). Although the program was said to pursue humanitarian goals, its main motivation was indeed getting rid of the growing wheat surpluses (Eggleston, 1987; Bovard, 1998). Subsidized exports became thus the third pillar of supply-management policy in the United States, the other two pillars being price supports and production controls (Winders, 2009). Between 1956 and 1960, the United States’ help came to be more than a third of total world wheat trade (Friedmann, 1992) and when other exporting nations, such as France, began to be troubled with the problem of wheat surpluses, they set in motion similar dumping programs (Spoerer, 2010). The importance of wheat aid gradually diminished from the 1980s onwards (Mason et al., 2012), yet for many years, international wheat aid schemes distorted relative prices in recipient countries in a manner that encouraged wheat consumption. Food aid “exposed consumers to wheat and encouraged the development of a preference for wheat over locally-produced staples”, particularly in Sub-Saharan Africa (Mason et al., 2012, p. 5; Morris and Byerlee, 1993; Byerlee, 1987). Consumer preferences are commonly affected by technology, income, and lifestyles, yet sometimes they may also be induced (Harwood, 2011). Indeed, changing eating habits required market-promotion programs that were carried out by the USDA and other national and international agencies (Morgan, 1979), and usually included milling and baking assistance (Collingham, 2011). Although there is a “lack of verifiable research in the area of export development and promotion in the international wheat trade” (Lauweryssen et al., 1989, p. 13), all available studies have concluded that the returns to investment in wheat-export market development activities have been impressive (US Wheat Associates, 1986; Williams, 1985; Pointon, 1978).
Wheat aid was intended as a solution to the farm problem in industrialized countries, and that is the reason why it has been asserted that the transformation of diets in developing countries occurred “as a result of first-world agricultural policies” (Fairbairn, 2008, p. 7). However, many other factors help to explain the shift toward wheat consumption in the group of ‘others’. Malembaum noted that there has been a historical ‘preference for wheat’ and that wheat could be referred to as “the only true bread grain” on the grounds that most consumers of cereals (except rice-eaters) have preferred it and have generally been willing to pay more for it than for other breads of equal nutritive value (Malembaum, 1953, p. 67).14 The convenience and reduced preparation time associated with wheat products relative to rice and maize has also been cited as a driver of the transition toward wheat in many developing countries (Senauer et al., 1986; Byerlee, 1987; Morris and Byerlee, 1993; Kennedy and Reardon, 1994; Boughton and Reardon, 1997; Mason et al., 2012). The development process is commonly associated with a rising opportunity cost of time, so households seek ways of reducing cooking time through foods such as bread and other wheat products. Since women are generally responsible for meal preparation in most developing countries, the growing participation of women in the labor force may also have fostered the shift toward wheat products (Mason et al., 2012). In addition, bread had been the staple diet of the colonial masters in many African countries, such as Zaire and, for that reason, it has been claimed that bread consumption identified with progress and modernity for the masses in some of these countries (Morgan, 1979). Finally, it has often been pointed out that wheat consumption is systemically higher in urban than in rural areas (Delgado and Reardon, 1991; Morris and Byerlee, 1993; Pingali, 2004; Fabiosa, 2006), so rapid urbanization in the group of ‘others’ may have also encouraged demand for wheat products.
Since many of the countries belonging to the group of ‘others’ are located in South Asia, the (2) spectacular growth of wheat consumption in Asia can also be explained by most of the aforementioned reasons. To some extent, the changing demand patterns in China are illustrative of what happened in the rest of Asia. First, until very recently, almost all wheat that was consumed in China was direct human consumption: wheat began to be used for animal feeding only from the late 1990s onwards (see Fig. 5). Therefore, increased wheat utilization per capita between the 1960s and the 1990s was part of an outstandingly rapid process of dietary change. As Fig. 8 shows, the rhythm of replacement of traditional staples such as millet by wheat was certainly impressive between the 1960s and the 1990s. Wheat even gained ground in relation to the most popular Asian grain: rice. The growing wheat consumption in Asia has been driven by multiple factors, some of them being much related with income growth and the process of structural change (Fabiosa, 2012). It is important to note, however, that, demand patterns in China exhibit distinctive characteristics. First, rural households have always consumed more wheat than their counterparts in urban regions (Rozelle and Huang, 1998). In fact, China “is the only country in East and Southeast Asia that has a large wheat-consuming rural population” (Rozelle and Huang, 1998, p. 1). Thus, in contrast to other Asian or African countries, rural-urban migration's impact on total wheat consumption may have been different than in most other countries. Second, wheat consumption in China grew at historically unprecedented rates between 1970 and 1990, but then began a downward trend (see Fig. 4). This process has had much to do with income growth and increased food availability. While in the early years of the reform (1978–1984) rising incomes led to increased demand for wheat products (Rozelle and Huang, 1998), by the 1990s the attained levels of income meant that consumption of wheat would rise only marginally with further increments in income (Garnaut and Ma, 1992; Carter and Zhong, 1991). Since the 1990s, China's rural population began to substitute meat, fruit, and vegetables for wheat, in a similar process to that of other rapidly-developing countries in Asia (Carter and Zhong, 1999; Rozelle and Huang, 1998).
With regard to (3) the increasing wheat demand in the group of European exporters between 1950 and 1990 and the dramatic fall in the 1990s, special attention must be paid to wheat end-uses. Wheat used as feed has always been virtually non-existent in the group of ‘others’ and in developing countries in general (Asia, Africa and South America). However, when it comes to the European countries – and particularly to the countries belonging to the former USSR – the picture is very different. As shown in Fig. 4, wheat consumption in the USSR rose dramatically between the 1950s and the 1980s, and plummeted in the 1990s. Fig. 5 suggests that this trend had much to do with the increased utilization of wheat as feed over the Soviet period and its considerable fall during transition. In the former Soviet Union, wheat production “had been heavily subsidized to keep bread prices low and increase livestock production by providing feedstock to the then rather inefficient livestock industries” (Götz et al., 2013, p. 216). Wheat used as feed came to be more than 40% of total domestic supply when the Brezhnev government decided to further expand livestock and milk production in the 1970s. The USSR government succeeded in raising meat production between 1970 and 1990 by over 60%, at the expense of becoming a large wheat importer over that same period (Liefert and Swinnen, 2002). However, the transition from centrally-planned to market economies that began in the early 1990s reversed the expansion of the livestock sector. Integration in world markets revealed that the countries belonging to the former USSR were not cost-competitive in livestock production (Liefert and Swinnen, 2002) and the huge government support of the livestock sector was largely eliminated. Therefore, the dramatic fall in wheat consumption that occurred in the 1990s was closely linked to the expansion of meat imports (Liefert et al., 2010).
The (4) growing per-capita wheat consumption in the group of European importers, throughout the whole period, also had much to do with the changing end-uses of wheat, and with an increasing utilization of wheat as feed, in particular.15 In his seminal work of 1953, Malembaum concluded that there was little room for increased wheat consumption per capita in high-income countries, such as the European importers (Malembaum, 1953). His contention was based on the observed income-elasticity of demand: at high income levels, the elasticity of demand with respect to income is negative. However, he acknowledged that wheat utilization per capita could rise due to the shift toward meat products and the subsequent increased utilization of wheat as feed. This is exactly what happened with the European importers over the 70-year period studied. While wheat utilization per capita in 2010 was roughly 1.6 times higher than in the 1960s, wheat used as feed went from about 20% in the 1960s to almost half of total wheat utilization in the 2000s. Of course, increased utilization of wheat as feedstock was closely related to the specific protections that wheat was granted under the Common Agricultural Policy (CAP). In fact, the growing wheat consumption in the European importers contrasts with consumption trends in other high-income countries, and in particular with (5) the declining per capita trend in North America between WWII and the 1970s, and its stagnation over the following 40 years. Falling wheat consumption per capita in the United States and Canada may be described as a ‘trading-up’ consumption adjustment: income growth made household preferences for better food products more affordable and resulted in “changes in food baskets represented by a shift from the consumption of carbohydrate-rich staple grains to high-value, protein-rich meat and dairy products” (Fabiosa, 2012, p. 599).16 In addition, demand for wheat as feed was much lower than in Europe throughout the whole period. Since wheat is disadvantaged as a feed grain, its effective demand depends greatly on the relative prices of competing alternatives, such as maize and soybeans. The lower demand for wheat as feed in North America has been, therefore, strongly related to the relative abundance of corn and soybeans in the United States. On the contrary, Europe's soil and climate are unsuitable for growing soybeans (Morgan, 1979), and the relative abundance of wheat over alternative feed grains in countries such as France have pushed up demand for wheat as feed.
4ConclusionsWorld wheat consumption today is greater than ever before. In fact, the amount of wheat consumed globally today is roughly four times what it was seven decades ago. This has only been possible thanks to an outstanding growth in world wheat supply that, in turn, has been deeply related to a remarkable improvement in wheat yields worldwide. With regard to the demand side, the extraordinary increase in wheat consumption may be attributable to three general causes: (1) population growth, (2) a higher percentage of people who consume wheat-based products, and (3) growing consumption per capita. Since the evolution of both population and per capita consumption has been very different across regions over the last 70 years, not only has overall wheat consumption grown, but the sites of consumption have been transformed radically. First, (1) population growth accounts for a very significant percentage of the observed increase in world wheat consumption. Since population has grown more in Asian and African countries, these two continents account for meaningfully larger shares of total wheat consumption than they did in prewar years. Second, (2) a great number of people was exposed for the first time to wheat-based products for direct human consumption over the postwar years. Market promotion carried out by USDA officials, grain trading companies, and international agencies played an important role in the introduction of wheat to the native populations of many developing countries. Since those countries are mainly located in Asia and Africa, this is another cause of increased wheat consumption in those two continents. Finally (3), world wheat consumption per capita grew at a significant pace between the end of WWII and the 1990s, and then started a global downward trend. Of course, this is the result of very different trends of wheat consumption across regions.
One should be extremely cautious when analyzing per capita wheat consumption, because wheat may have different end-uses and demand for those uses may be driven by different forces. We have made a very clear distinction between wheat used as feed and wheat utilized for direct human consumption. This has allowed us to see that growing wheat consumption in some industrialized countries has been motivated by increased demand for wheat as feed. We know that demand and supply are connected through the price mechanism, and that demand for wheat as feed is noticeably more elastic than that of wheat for direct human consumption. Hence, wheat has been increasingly fed to livestock in advanced countries where demand for meat and dairy products has been high and wheat has been relatively abundant. This has been the case of Oceania and some traditional European Importers such as France, Germany and the United Kingdom (which, as a group, became net exporters of wheat in the 1990s). Of course, this trend was deeply related to the specific protection that wheat was granted under the CAP. Increased consumption of wheat as feed has also been motivated by supply policies in other countries, the most significant case being the USSR between 1960 and 1990.
However, wheat is much more commonly used as food than it is as feed. In fact, virtually all wheat that is consumed outside Europe, North America and Oceania is incorporated into products that are directly consumed as food. Therefore, special attention has to be paid to the evolution of human per capita wheat consumption. As Collins stated, “it is an undisputed fact that, over the long run, wheat and the wheaten loaf displaced other types of grain and grain preparations to become the standard grain and grain food in most European countries” (Collins, 1993, p. 12). The most recent data shows that the primacy of wheat was not only a European phenomenon: a dietary shift toward wheat-based products has taken place virtually everywhere (South American countries probably being the most prominent exception). However, there is not such a thing as a ‘natural’ trend toward the universalization of wheat consumption. On the contrary, the primacy of wheat has been contingent, because it has depended on numerous developments that might have not occurred. The choice to consume wheat-based products over other staples has depended mainly on the evolution of consumer income, consumer preferences, and the set of relative prices of wheat and competing staples. None of those variables may be considered as exogenous, and none of them have been immutable over time. The process of economic growth has indeed fostered the ‘convergence consumption’ pattern (i.e., wheat consumption in low and middle-income countries catches up with the consumption pattern of high income countries). As Popkin (1993) noted, there seems to be a universal ‘trading up’ consumption adjustment that has much to do with income growth. First, at relatively low but regularly improving income levels, grain consumption per head tends to rise. Then – regardless of location, consumers tend to replace carbohydrate-rich grain staples such as wheat by animal-protein rich meat, fruit and dairy products. The first stage reflects increased food availability and welfare, and it is also encouraged by the process of urbanization and the rising opportunity cost of time. This is what happened in most Asian and African countries over the studied period. The second stage occurs because income-elasticity of demand for wheat is commonly negative above certain levels of income. This process helps to explain the declining per capita trend in wheat consumption in North America after WWII and in China since the 1990s. Of course, income-elasticity of demand is not an intrinsic characteristic of any consumer good, but rather a variable affected by a great number of historical and institutional factors. Income growth, by itself, is not enough to explain the evolution of world wheat consumption. This means that other explanatory variables must be considered. Even in the richest countries, per capita wheat supply has not declined dramatically as income has grown. For instance, European consumption of wheat is now much more important in relation to that of barley, oats and rye than it was four decades ago. This may have something to do with the fact that wheat-based products have been much better integrated into the new globalized system of food processing, market and distribution (i.e. many of the food products being sold by transnational food companies, international fast-food chains such as McDonalds, and modern supermarkets with global reach such as Walmart are made from wheat). Finally, it has already been mentioned that demand for wheat-based products depends critically on consumer preferences and on the set of relative prices of wheat and competing staples. There is no doubt that both variables have been deeply influenced by the institutional framework that has regulated wheat trade since the end of WWII. In this regard, this paper has suggested that increased wheat consumption in the group of ‘others’ – mainly composed by developing countries that barely consumed wheat prior to the War – has been deeply related not only to the process of income growth but also to trade policies in the main exporting countries.
This paper is part of my forthcoming PhD thesis on the World Wheat Economy, 1939–2010. I would like to thank my supervisor Vicente Pinilla for all his kind and insightful comments. Financial support was provided by the Spanish Ministry of Science and Innovation (projects HAR2013-40760-R and HAR2016-75010-R).
Data on wheat production (tons), area harvested (hectares) and trade (tons) has been obtained from FAO (2016), FAO Production and Trade Yearbooks (1948–1961), Institut International d’Agriculture (1947) and, in some cases, Mitchell (2013). Data on population is from World Bank (2015), United Nations (2013) and Mitchell (2013).
Data on wheat consumption has been calculated as production minus net exports (apparent consumption). Wheat yields have been estimated as production/area harvested (tons/hectares). Wheat imports and exports have been constructed as wheat equivalents (wheat+wheat flour), applying the standard conversion factor of 1.39 (1ton of wheat corresponds to 0.72tons of wheat flour).
Several adjustments have been made in order to estimate longer and homogeneous series:
* In the few cases where data was not found for a given year and that year was located between two years with data, linear interpolation has been applied.
* There is a significant group of countries lying in the tropical belt between 23 degrees south latitude and 23 degrees north latitude which do not report official data on production. There are good reasons to believe that wheat production in those countries has been either not significant or inexistent over the period studied.1717 For instance, see Byerlee (1987, p. 308). The full list of countries comprises: Arab Emirates, Benin, Burkina Faso, Cambodia, Cape Verde Islands, Costa Rica, Cote d’Ivoire, Cuba, Djibouti, Dominican Republic, El Salvador, Ethiopia-Eritrea, Fiji, Gabon, Gambia, Ghana, Guinea, Guyana, Haiti, Hong Kong, Indonesia, Jamaica, Liberia, Madagascar, Malaysia-Singapore, Malta, Mauritius, Nicaragua, Panama, Papua, Philippines, Republic of Congo, Senegal, Sierra Leone, Sri Lanka, Thailand, Togo, Trinidad-Tobago, and Vietnam.
* In the cases when one country reported values for wheat trade but provided no information on trade of wheat flour, the latter has been considered as inexistent for the purpose of estimating wheat equivalents.
* Finally, in some countries data on population has been extrapolated in order to obtain population series from 1945 onwards.
Data provides information from 135 countries in Europe (26), Africa (45), Asia (35), North America (14), South America (11) and Oceania (4). A number of transformations have been made in order to obtain continuous series. The 15 countries belonging to the former USSR have been treated as if the USSR had not been dismembered. The same is true for the countries belonging to the former Yugoslavia and Czechoslovakia. Other countries have been grouped together for the purpose of the analysis: Belgium with Luxembourg, Ethiopia with Eritrea, and Malaysia with Singapore. The USSR has been considered as a European country.
| Europe | Africa | Asia | North America | South America | Oceania |
|---|---|---|---|---|---|
| Albania Austria Belgium-Luxembourg Bulgaria Cyprus Czechoslovakia Denmark Finland France Germany Greece Hungary Ireland Italy Malta Netherlands Norway Poland Portugal Romania Spain Sweden Switzerland United Kingdom USSR Yugoslavia | Algeria Angola Botswana Burkina Faso Burundi Cameroon Cape Verde Islands Chad Cote d’Ivoire Djibouti Democratic Republic of Congo Egypt Ethiopia-Eritrea Gabon Gambia Ghana Guinea Kenya Lesotho Liberia Libya Madagascar Malawi Mali Mauritania Mauritius Morocco Mozambique Namibia Niger Nigeria Republic of Congo Republic of South Africa Rwanda Senegal Sierra Leone Somalia Sudan Swaziland Tanzania Togo Tunisia Uganda Zambia Zimbabwe | Afghanistan Arab Emirates Bangladesh Benin Bhutan Cambodia China Hongkong India Indonesia Iran Iraq Israel Japan Jordan Kuwait Lebanon Malaya-Singapore Mongolia Myanmar Nepal North Korea Oman Pakistan Philippines Qatar Saudi Arabia South Korea Sri Lanka Syria Taiwan Thailand Turkey Vietnam Yemen | Canada Costa Rica Cuba Dominican Republic El Salvador Guatemala Haiti Honduras Jamaica Mexico Nicaragua Panama Trinidad Tobago United States | Argentina Bolivia Brazil Chile Colombia Ecuador Guyana Paraguay Peru Uruguay Venezuela | Australia Fiji New Zealand Papua |
FAO, 2016. FAOSTAT Statistics Database. Rome. URL: http://www.faostat.fao.org/.
FAO, 1948–61. Production Yearbook. Rome: Food and Agriculture Organization of the United Nations.
FAO, 1948–61. Trade Yearbook. Rome: Food and Agriculture Organization of the United Nations.
Institut International d’Agriculture, 1947. Annuaire Internationale de Statistique Agricole 1941–42 à 1945–46. Volume II, Commerce International. Rome: Institut International d’Agriculture.
Mitchell, B. and Palgrave MacMillan (firm), 2013. International Historical Statistics. Palgrave Macmillan. URL: http://www.palgraveconnect.com/pc/archives/ihs.html.
United Nations, 2013. World Population Prospects. United Nations, Population Division. URL: https://esa.un.org/unpd/wpp/.
World Bank, 2015. World Development Indicators. The World Bank. URL: http://data.worldbank.org/data-catalog/world-development-indicators.
For instance, gruels and porridges made from barley, oats, millet and buckwheat were staple foods up the mid-nineteenth Century throughout central and northern Europe. The lack of gluten of this kind of grains made them much better adapted for boiling than for bread-making (Collins, 1993).
This helps to explain the presence of a significant degree of intra-industrial trade in international wheat markets.
Mixed wheat consists of less than 90 percent of one class of wheat and more than 10 percent of another class of wheat. Unclassed wheat includes any varieties that cannot be classified under other criteria (Smith, 2000).
On the other hand, differences in nonintrinsic characteristics such as cleanliness and the presence of pesticide residues usually determine variations in prices among different grades of wheat within classes (Smith, 2000).
There is substitution between varieties and “blending of different varieties to produce flour with specific characteristics” (Mitchell and Mielke, 2005, p. 196).
We are aware that the interpretation of the empirical results presented in section four may be limited by this issue.
Although France used more tons of wheat for biofuel production than any other European country, its use corresponded to only 5% of total wheat consumption. The highest rate of wheat use as biofuel was in Sweden (23%). Overall, “49% of the wheat consumption in Europe was used for human/industrial purposes, 42% was used for animal feeding, 3% was used as biofuel and 6% was used as seeds and for other industrial purposes” (Canals and Amante, 2015, p. 421). For more information on the historical evolution of wheat end-use by continent and by groups of countries, see Figs. 5 and 6 (in the appendix).
According to FAO (2016), human consumption of wheat accounted for roughly 70% of total wheat utilization over the period 1960–2010. The remaining 30% consisted of non-food uses such as seed, feed, and waste.
Income and price-elasticities of wheat demand have been extensively studied throughout the 20th Century. The low income-elasticity of the majority of foodstuffs is demonstrated in Yates (1960), Yu et al. (2002) and Cranfield et al. (2003). With regard to price-elasticity, Malembaum noticed that the inelasticity of wheat demand may have been overstated, probably due to the fact that expenditures on wheat are usually maintained for a while when prices rise (Malembaum, 1953). It has also been pointed out that price-elasticity tends to be higher at lower levels of income (McMahon, 2013) and that general computations of price-elasticity usually impede seeing a more elastic demand for wheat as feed (Malembaum, 1953).
This notion has been at the core of many political and theoretical controversies throughout the 20th Century. Raúl Prebisch – an influential economist born in one of the largest wheat exporting countries, Argentina – realized that the terms of trade had only deteriorated in underdeveloped, commodity-exporting countries (Prebisch, 1952). This would become the cornerstone of Latin-American structuralism.
Wheat consumption trends by groups of countries have been plotted by constructing series of apparent consumption by country and aggregating countries into categories (i.e. continents and Malembaum's groups of countries). Apparent consumption has been constructed as wheat production plus wheat imports minus wheat exports [production+imports−exports]. This means that changes in inventories have not been taken into account for the purpose of estimating consumption. Stock variation may have been important in certain countries and for some years, but unfortunately, data on beginning and ending stocks is often unavailable and, when available, tends to be particularly vague. The ambiguity about the actual stock situation has been discussed in some recent works. For instance, Carter et al. (1999) pointed out that, while USDA's estimation of ending stocks in China in 1997 was 400 million tones (USDA, 1998), the estimation made by the FAO was only 54 million tones (FAO, 1997). Importantly, “the 350 million tons difference between these two figures exceeds FAO's estimate that total world cereal grain stocks were 280 million tons” (Carter et al., 1999, p. 78). Therefore, apparent consumption series must be regarded only as a rough long-term approximation of the actual wheat consumption values.
Overall, wheat production in those countries has not kept pace with the rapidly growing wheat consumption experienced over the last 70 years. Therefore, this group of countries has come to be deeply dependent on wheat imports. Indeed, this has been a very controversial issue, since high levels of wheat dependence may jeopardize food security, particularly when international wheat prices skyrocket (González Esteban, 2017a).
See Fig. 9.
Malembaum also noted that no such preference exists for wheat as a feed, even when it becomes available at lower prices (Malembaum, 1953, p. 68). Since wheat with high protein content is usually associated with certain digestive troubles, wheat used as feed tends to be of lower quality (lower protein content) than that used for direct human consumption (Kent and Evers, 1994).
In addition, regarding direct human consumption of wheat, European citizens have substituted wheat for traditional grains such as barley, oats and rye throughout the whole period.
Yet, it should be noted that the new consumption habits tend to be fiber-poor, are characterized by excess animal calories and fats, and have resulted in a growing obesity prevalence (Patel, 2007; Pujol and Cussó, 2014).
For instance, see Byerlee (1987, p. 308). The full list of countries comprises: Arab Emirates, Benin, Burkina Faso, Cambodia, Cape Verde Islands, Costa Rica, Cote d’Ivoire, Cuba, Djibouti, Dominican Republic, El Salvador, Ethiopia-Eritrea, Fiji, Gabon, Gambia, Ghana, Guinea, Guyana, Haiti, Hong Kong, Indonesia, Jamaica, Liberia, Madagascar, Malaysia-Singapore, Malta, Mauritius, Nicaragua, Panama, Papua, Philippines, Republic of Congo, Senegal, Sierra Leone, Sri Lanka, Thailand, Togo, Trinidad-Tobago, and Vietnam.