

Thus far, there is not one single consumption basket of Buenos Aires for the whole 19th century. The available series cover from the 18th century until 1810 and between the latter decades of the 19th century and the early 20th century. Most of the 19th century remains uncovered although research on prices of specific goods has advanced recently. In this article we construct two consumer baskets, based on primary sources from Buenos Aires archives: a Bare Bone Basket and a ‘respectable’ basket, according to Allen's denominations. Furthermore, through the calculation of the welfare ratio for those baskets, this study aims to achieve a better assessment of the urban and rural wages and real income of the population of Buenos Aires during this period.
Hasta el momento no se conocen cestas de consumo para Buenos Aires en el siglo xix. Las series disponibles cubren el siglo xviii hasta 1810, y los últimos años del xix y principios del xx, pero la mayor parte de dicho siglo sigue siendo una incógnita, aunque se cuenta con algunas investigaciones sobre precios de ciertas mercancías. En este artículo se construyen 2 cestas de consumo: una correspondiente a la subsistencia mínima de la familia de un trabajador (la llamada Bare Bone Basket) y otra «respetable», basadas en fuentes primarias de los archivos de Buenos Aires. Luego comparamos dichas cestas con los salarios de los trabajadores urbanos y rurales para acercarnos a los ingresos reales de la población de Buenos Aires durante este período, o la «razón de bienestar» (welfare ratio) de acuerdo con las propuestas de Robert Allen.
This contribution aims to construct a basket of basic consumption goods for Buenos Aires in the first half of the 19th century. Our main goal in this project is to provide historians and social scientists with a reliable tool to deflate the prices of this economy, especially the wage series we have built and analysed in previous papers. This way we will be able to assess the evolution of the local real wages during this period of economic growth and increasing integration of the region in the Atlantic economy, as well as establish comparisons with other areas of the world.
At a first stage we have tried to build a basket of basic subsistence goods using the method proposed by Allen (2001). According to this approach, the basket should include the minimum calories needed for human subsistence, and the basic proteins, along with some essential requirements for life such as basic clothes, rent, heat and light. Research should cover how these elements are acquired and their cost. The resulting basket is called Bare Bone Basket (BBB), and can be compared to the wages in order to establish the salary level required to afford the needs of a household (a couple with two children). In more recent contributions, Allen has defined the BBB as the minimal subsistence basket, and proposed a new basket, more diversified and expensive, which he called ‘respectable’ basket. This method has many problems, which we will discuss along this article, but it has a great advantage: it allows us to compare the local basket to the world chart already built following Allen's method, and establish the relative purchase capacity of local wages. Beyond the self-evident relevance of this comparison for the study of living conditions and migrations (both international and regional), Allen's proposal acknowledges the importance of assessing the salary levels as an approach for the comparative studies of the potential economic development in different countries.1
In this article we will construct an urban consumption basket based on the available data for Buenos Aires Women's Hospital. First, we will examine the sources and the contents and evolution of the Hospital expenses, in order to assess their reliability for the analysis of consumption levels in Buenos Aires. Then we will analyse in detail the food consumption in the Hospital, using annual relative prices. Later we will convert those values into quantities of foodstuff, and then we will calculate their calories, which will allow us to generate a basic basket comparable to Allen's, a common reference for the international literature. We will construct both baskets using our sources: one that we can consider a ‘respectable’ basket, including the different foodstuff bought by the Hospital, and a ‘bare bone’ basket including only the minimal subsistence level items with some of the most basic and cheapest foodstuff available in the city. Finally, we will compare our baskets values in the selected years with the various rural and urban wages in Buenos Aires, in order to know their purchasing power as an approximation to the standards of living of the local workers and a measure of comparison to the international standards.
2Sources and methodologyThe Women's Hospital was founded in the city of Buenos Aires in the decade of 1740 and it was managed by the Hermandad de la Caridad, a Catholic charity organization, until 1822, when the Buenos Aires government took over the hospital (Ruiz Moreno, 1941). Along the years, government funding fluctuated as other budget needs seemed more urgent, especially the demands of the insatiable military machine. The sources for the present study come from the records kept by the administration of the hospital during this period: expenditure budgets and accounting reports.2 This is the same type of sources used for other Latin American cases. The Hospital records informs the daily payments made by the institution on every concept, indicating date, purchased item, quantity, unit of measurement, unit price, and total amount paid in pesos corrientes (paper currency). Wage payments are registered with the corresponding period of work, while in the case of temporary services, the description of the expenditure is carefully detailed. As Table 2 shows, the services and purchases paid are multiple and varied, covering food, beverages, tools, and medicines.
In order to build the price basket, we have taken the Hospital records of expenses corresponding to three specific years: 1825, 1835, and 1849. This selection intends to cover a broad span of the first half of the century, after the so-called ‘cattle expansion’, though avoiding some special years with drastic variations in the relative prices due to armed conflicts and heavy monetary emission. Thus, 1825 was the last year before the high inflation cycle caused by the Brazilian Navy blockade; 1835 was the year when Rosas returned to the Governor's office, during a quite stable period in economic terms; and finally 1849 seems a fairly ‘regular’ year of the so-called “pax rosista”, a period of economic prosperity after the Anglo-French blockade was lifted. Our aim is to compare the evolution of the basket composition during this period of time, considering the moments in which the general economic context would affect the consumers’ choices the least. We have also taken into consideration the evolution of the prices and the purchasing power of the local consumers during the years we could consider ‘regular’, although normality could be quite frequently altered by very complex circumstances, such as long droughts or the several blockades to Buenos Aires harbour, which affected both imports and exports of the province, and so had an impact on the prices of many consumption goods. The blockades of 1826–1828 and 1838–1840 caused the fall of the export prices, as goods could not be shipped out, as well as an increase in the prices of imports that could not enter the country. Local prices were also affected by local monetary emission and devaluation.
Moreover, the three selected years have quite complete records in the available sources, stating name of the product, date of purchase, amount, price per unit, and the total paid price. With this information it is possible to generate a well-informed list of purchases for the Hospital, which is a useful resource for calculating a basket with all the necessary goods for the consumption of the Hospital patients and staff. Let us consider first the annual and monthly expenses.
For this calculation, we have available information on the wages of Government employees and rural workers from our previous studies.3 In the special case of the urban masons (a necessary reference we must consider for comparative purposes), we will use data from the Hospital records as well as from other sources, and from the cited bibliography.
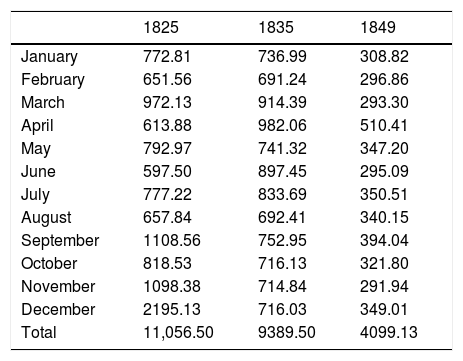
3General dataTable 1 shows the Hospital total expenses during the selected years, including the total sum paid for wages, maintenance, services, and food. When we convert the figures to pesos fuertes4 in order to avoid the effects of the devaluation of the local paper currency (peso moneda corriente), we find that the total amount decreases along the years. Actually, the Hospital expenditure budget was quite the same in 1825 and 1835, except for December 1825 when there was an unusually large purchase of wine, as we shall see. The remarkable decrease in the expenses takes place by 1849: the figure hardly exceeds 40% of the 1835 total.5
Hospital monthly expenses (in pesos fuertes).
| 1825 | 1835 | 1849 | |
|---|---|---|---|
| January | 772.81 | 736.99 | 308.82 |
| February | 651.56 | 691.24 | 296.86 |
| March | 972.13 | 914.39 | 293.30 |
| April | 613.88 | 982.06 | 510.41 |
| May | 792.97 | 741.32 | 347.20 |
| June | 597.50 | 897.45 | 295.09 |
| July | 777.22 | 833.69 | 350.51 |
| August | 657.84 | 692.41 | 340.15 |
| September | 1108.56 | 752.95 | 394.04 |
| October | 818.53 | 716.13 | 321.80 |
| November | 1098.38 | 714.84 | 291.94 |
| December | 2195.13 | 716.03 | 349.01 |
| Total | 11,056.50 | 9389.50 | 4099.13 |
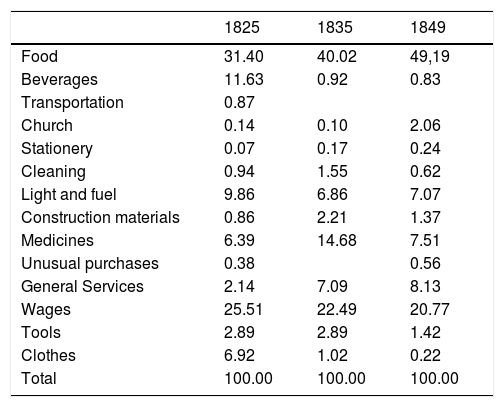
At a glance, this reduction is due to a lower activity in the Hospital, a reason we could only confirm if there were records of the number of people sustained on the supplies of the institution (patients, doctors, residents, nurses, etc.). All we have is the Hospital payroll, with the names of the staff and their wages. In 1825 there were 15 workers and the annual total of wages was $2820.88 while 10 years later, the 1835 payroll contains 37 names and a reduced total: $2111.80 (in pesos fuertes). This reduction was coherent with the general trend of the wages for Buenos Aires public servants (Gelman and Santilli, 2014b). In 1849 the number of employees had decreased to 25 people, and the wages had fallen even more: $851.20. Thus, the average annual salaries per capita in the Hospital were $188 (in 1825), $57 (in 1835), and $34 (in 1849). As we cannot assume a lower activity in the Hospital, it is evident that the income of the staff in pesos fuertes was sharply reduced. Let us see now what happened with the total expenses for each category. Table 2 shows the percentages of each item in the total expenses.
Expenses by category, %.
| 1825 | 1835 | 1849 | |
|---|---|---|---|
| Food | 31.40 | 40.02 | 49,19 |
| Beverages | 11.63 | 0.92 | 0.83 |
| Transportation | 0.87 | ||
| Church | 0.14 | 0.10 | 2.06 |
| Stationery | 0.07 | 0.17 | 0.24 |
| Cleaning | 0.94 | 1.55 | 0.62 |
| Light and fuel | 9.86 | 6.86 | 7.07 |
| Construction materials | 0.86 | 2.21 | 1.37 |
| Medicines | 6.39 | 14.68 | 7.51 |
| Unusual purchases | 0.38 | 0.56 | |
| General Services | 2.14 | 7.09 | 8.13 |
| Wages | 25.51 | 22.49 | 20.77 |
| Tools | 2.89 | 2.89 | 1.42 |
| Clothes | 6.92 | 1.02 | 0.22 |
| Total | 100.00 | 100.00 | 100.00 |
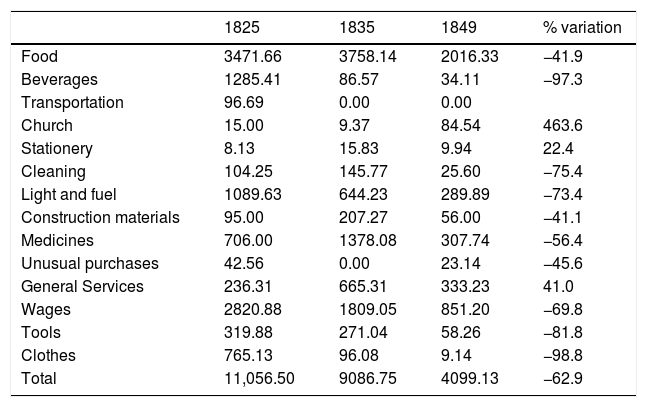
The Hospital clearly reduced its budget for certain categories along the years but the food expenditure was increased remarkably. This seems to confirm Engel's law, although contrary to its usual application, for the budget reduction let the Hospital administration concentrate the available resources on the most essential and indispensable items, especially food, instead of spending on categories which had a more elastic consumption. The abrupt drop in two categories (beverages and clothes) is also noteworthy in 1835 and 1849. An exception seems to appear in the services row, which increased its share, particularly due to the cost of clothes washing, an activity that was previously performed by the Hospital's own staff, probably. Wages were slightly reduced, while the expenditure on medicines was not affected by cuts, which seems quite sensible for a Hospital. Let us see now what happened to the absolute figures. The percentage of variation for the last column reflects the comparison between the 1825 and 1849 data (Table 3).
Expenses by category: absolute values in pesos fuertes.
| 1825 | 1835 | 1849 | % variation | |
|---|---|---|---|---|
| Food | 3471.66 | 3758.14 | 2016.33 | −41.9 |
| Beverages | 1285.41 | 86.57 | 34.11 | −97.3 |
| Transportation | 96.69 | 0.00 | 0.00 | |
| Church | 15.00 | 9.37 | 84.54 | 463.6 |
| Stationery | 8.13 | 15.83 | 9.94 | 22.4 |
| Cleaning | 104.25 | 145.77 | 25.60 | −75.4 |
| Light and fuel | 1089.63 | 644.23 | 289.89 | −73.4 |
| Construction materials | 95.00 | 207.27 | 56.00 | −41.1 |
| Medicines | 706.00 | 1378.08 | 307.74 | −56.4 |
| Unusual purchases | 42.56 | 0.00 | 23.14 | −45.6 |
| General Services | 236.31 | 665.31 | 333.23 | 41.0 |
| Wages | 2820.88 | 1809.05 | 851.20 | −69.8 |
| Tools | 319.88 | 271.04 | 58.26 | −81.8 |
| Clothes | 765.13 | 96.08 | 9.14 | −98.8 |
| Total | 11,056.50 | 9086.75 | 4099.13 | −62.9 |
Since the global reduction of the Hospital spending was 62.9%, the most affected categories were those which had fallen more than that global figure, while the categories with lesser reductions increased their share in the total budget.
It is evident that food was one of the least affected categories for the 25 years under study, despite the increase of the church and stationery expenses (still relatively insignificant).6 It is important to underline that the ‘wages’ category was one of the most affected, losing several points in relative terms. All these considerations aim to ponder the reliability of the figures we have. Following the general trend of budget reductions, the Hospital wages suffer a cut during this period. Rosas’ administration tried to reduce the budget deficit for the expenses they judged ‘superfluous’, in order to concentrate the fiscal resources in the military and police expenditures. It is well known that the public education expenses were reduced during his period, and it seems that also the health care budget suffered a cut.7
Thus the strong reduction in the Hospital expenses led to an adjustment of the purchase priorities: they concentrated the resources on those categories which evidenced a lower downward inelasticity while they reduced the more flexible expenses, such as beverages and clothes. Expenditures on food and medicines were also reduced, though at a lower rate. The combination of downward trends in both the staff number and the food and medicine expenses seems to denote lower levels of activity in the Hospital, but this can be confirmed only when we know how many patients the Hospital had.
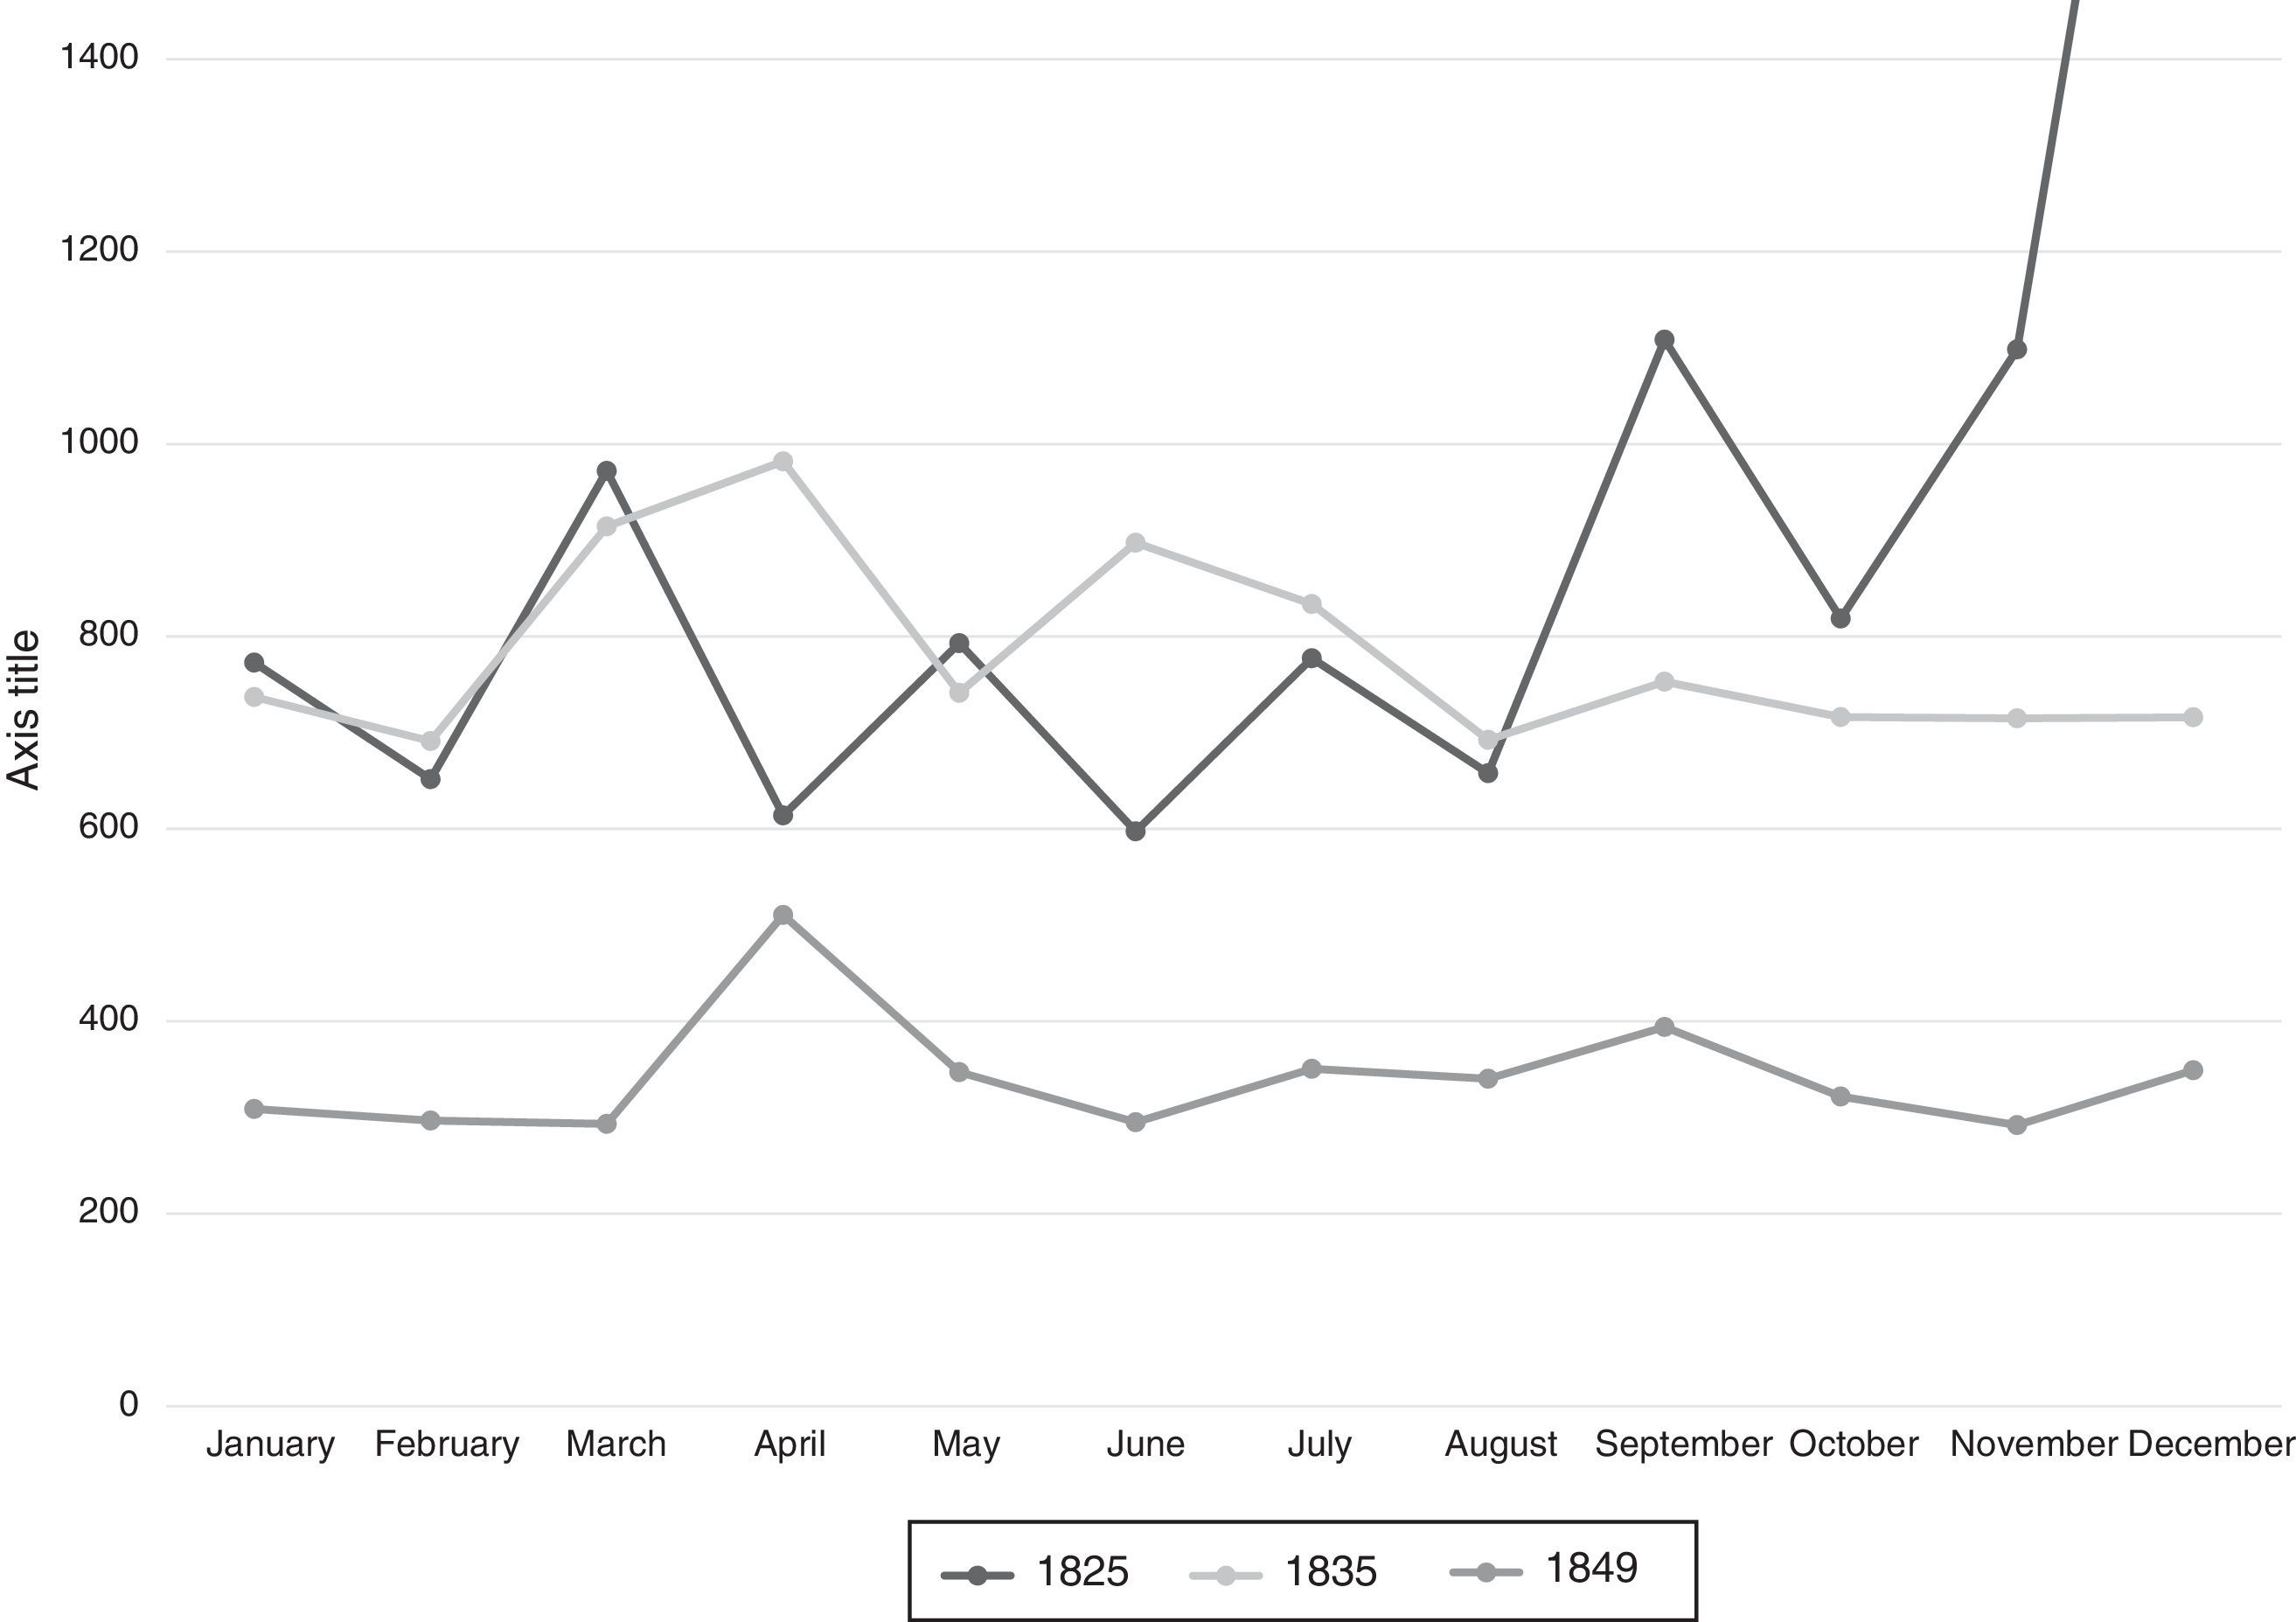
As regards to seasonality, we cannot find either a very distinct trend in the monthly expenses as Graph 1 shows.
.")
There are some pronounced oscillations in almost any month of the year, which would indicate that purchases are more conditioned by the funds available or the opportunities rather than by a seasonal demand. The peak we find in December 1825 can be explained by the already mentioned purchase of wine. We will deal with this exceptional case later, but since it was never repeated, we may assume it was a speculative purchase, either to generate a stock for future needs or to protect the Hospital resources in the prelude of the high inflation period triggered by the monetary consequences of the Brazilian blockade, when Buenos Aires paper currency was declared inconvertible.
4Towards a basic basket: calculating food values and quantitiesFor the construction of a useful consumption basket of Buenos Aires in the 19th century, we will select from the Hospital sources only the categories that are not specific (medicines or wages, for instance) and we will focus on foodstuff (by far the most important category), cleaning, light and fuel expenses. Then we will add an estimated cost of basic clothes and a minimal rent. In these cases, as we do not have reliable data, we will estimate 3m of cloth for the BBB, and 5m of cloth for the ‘respectable’ basket, plus a 5% of each total basket for rent, as it is usual in the international literature.8 The foodstuff categories include, as we will see, milk and yerba mate, but unfortunately, there is no consistent information for the alcoholic beverages categories (wine, beer, liquor), given that the 1825 wine purchase was clearly exceptional and the figures in 1835 and 1849 seem suspiciously insignificant.
In any case, a selection of inexpensive foodstuff, cleaning, and fuel will be useful to construct a basic subsistence basket of Buenos Aires, with the addition of the estimated costs of clothes and rent. The rest of the products will be included in our ‘respectable’ basket. This method was conceived to compare salary levels worldwide by calculating how many subsistence baskets can be bought by the unskilled worker's wage.
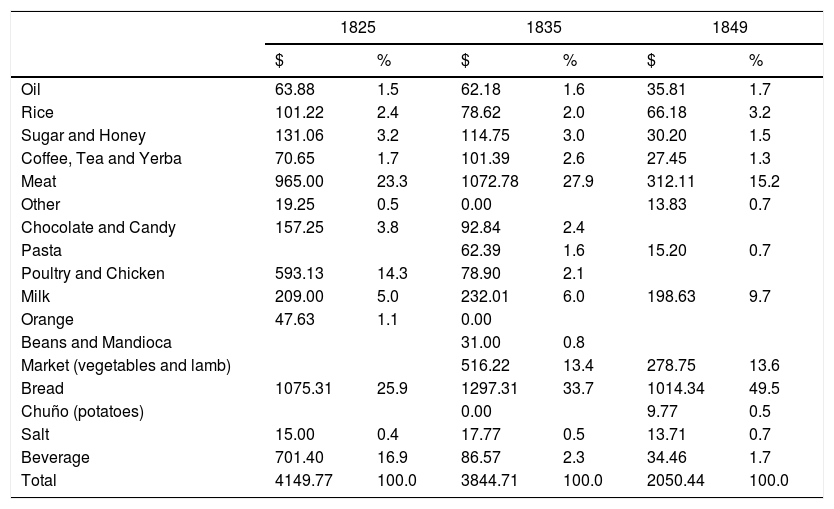
Let us see now the Hospital foodstuff expenses, by far the most important (and the least flexible) categories of the basket (Table 4).
Annual composition of the Hospital food expenditures. Selected years (in pesos fuertes).
| 1825 | 1835 | 1849 | ||||
|---|---|---|---|---|---|---|
| $ | % | $ | % | $ | % | |
| Oil | 63.88 | 1.5 | 62.18 | 1.6 | 35.81 | 1.7 |
| Rice | 101.22 | 2.4 | 78.62 | 2.0 | 66.18 | 3.2 |
| Sugar and Honey | 131.06 | 3.2 | 114.75 | 3.0 | 30.20 | 1.5 |
| Coffee, Tea and Yerba | 70.65 | 1.7 | 101.39 | 2.6 | 27.45 | 1.3 |
| Meat | 965.00 | 23.3 | 1072.78 | 27.9 | 312.11 | 15.2 |
| Other | 19.25 | 0.5 | 0.00 | 13.83 | 0.7 | |
| Chocolate and Candy | 157.25 | 3.8 | 92.84 | 2.4 | ||
| Pasta | 62.39 | 1.6 | 15.20 | 0.7 | ||
| Poultry and Chicken | 593.13 | 14.3 | 78.90 | 2.1 | ||
| Milk | 209.00 | 5.0 | 232.01 | 6.0 | 198.63 | 9.7 |
| Orange | 47.63 | 1.1 | 0.00 | |||
| Beans and Mandioca | 31.00 | 0.8 | ||||
| Market (vegetables and lamb) | 516.22 | 13.4 | 278.75 | 13.6 | ||
| Bread | 1075.31 | 25.9 | 1297.31 | 33.7 | 1014.34 | 49.5 |
| Chuño (potatoes) | 0.00 | 9.77 | 0.5 | |||
| Salt | 15.00 | 0.4 | 17.77 | 0.5 | 13.71 | 0.7 |
| Beverage | 701.40 | 16.9 | 86.57 | 2.3 | 34.46 | 1.7 |
| Total | 4149.77 | 100.0 | 3844.71 | 100.0 | 2050.44 | 100.0 |
Bread was the most important expense among the Hospital food purchases in 1825, with a large share (26%), closely followed by meat (23%). However, if we add poultry (14%), the animal produce takes the lead. Although we decided to exclude the December exceptional purchase of wine,9 it is surprising to see the large share for beverages (17%), which includes liquor, beer, and different kinds of wine. Milk represents 5% of the total, which denotes that the Hospital diet was quite varied. This is also confirmed when we look at the remaining 15% which is divided into several other categories: cooking oil, rice, salt, sugar, among others. However, the concentration of the expenditure on bread and meat is evident, while the 1825 figures for beverages cannot be found in the following years. It will take further research to know whether the share for beverages in 1825 reflected the consumption of the local population in a better way than the figures for 1835 and 1849, when this category almost disappeared from the Hospital total purchases.
In 1835 the dominance of the categories we consider essential, like bread (34%) and meat (28%), seems to increase, although the share of bread has grown even more, a variation we could explain by the fluctuations in the price of wheat during the mid-1830s (Gelman and Santilli, 2014a). Compared to the 1825 data, the consumption of poultry dropped, while a new category emerged: ‘el mercado’ (the market), which includes a variety of fruits and vegetables, as well as lamb or fish. We have added this category without a discrimination of its subcategories because they are hard to establish properly. The share of milk has increased slightly but this is due to the strong fall in another category, beverages, which is now only 2% (mostly concentrated in wine). In any case, the composition of the basket corresponds still to a quite varied and balanced diet, which even included a bit of chocolate, a quite extraordinary staple for the Rio de la Plata region.
The 1849 basket, in turn, reflects a more intense polarization compared to 1835. Bread now takes 49% of the total expenses, while meat has reduced its share to a modest 15%, which is a quite noteworthy contraction, especially when we consider that the purchase of poultry and chicken disappeared from the list. Meat seems to have been replaced somewhat by lamb, included in ‘the market’, a category that grew slightly up to 14%. Milk is a more remarkable case in 1849, reaching 10% of the expenditures. The other categories seem to have maintained their relative weight in the basket. It is evident that the growing share of bread, due to its rising price, affected all the rest proportionally.
It is worth comparing these results with Johnson's for Buenos Aires consumption during colonial times (Johnson, 2013, p. 262). According to his research, using a variety of sources, the shares of the basic expenses in Buenos Aires were: 40% wheat, 10% rice, 2.5% chickpeas, 7.5% yerba mate, 5% sugar, 2.5% beans, 5% jerky beef, 7.5% wine, 20% rent. Unfortunately, this basket does not include meat, the staple food in Buenos Aires, probably because it was abundant and inexpensive.
Some significant changes can be noticed, beyond the estimation of the housing cost (rent), but we were not able to calculate them more precisely for our case. Perhaps the most striking point of this comparison is the much lesser incidence of the meat in the purchases of the inhabitants of colonial Buenos Aires. This could indicate, at least partially, a greater relative weight of bread and wheat in the economy of colonial Buenos Aires, compared to the situation after independence, when cattle became the crucial staple for economic growth, and along with that change, meat probably gained a greater share in the local diet.10
Concomitant with this transformation, there was a rise in the price of livestock, somewhat caused by the growing gravitation of cattle ranching in Buenos Aires economy since the decade of 1810, along with the development of the salteries (saladeros). It is also relevant to keep in mind Johnson's shares of yerba mate and wine because they probably reflect the local consumption much better than our Hospital sources.
For a later period (1850–1914), Martin Cuesta has constructed a basket based on the writings of Alfredo Palacios, a prominent Argentine socialist legislator during the early decades of the 20th century. The shares of purchases in his basket are the following: wheat or bread (27%), corn (7%), meat (28%), wine (5%), sugar (3%), rent (20%), and clothes (10%) (Cuesta, 2012, p. 8). The main difference between Cuesta's basket and ours is the lower impact of wheat/bread, which might be explained by the outstanding expansion of agriculture of the late 19th century that certainly made wheat cheaper for local consumption. Like Johnson, Cuesta has included an estimated rent in the basket.
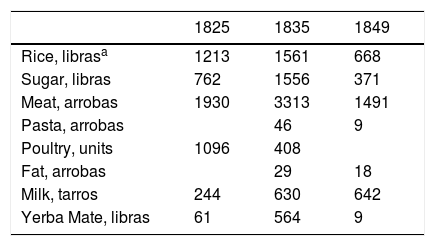
The second step in our construction of the basket is to convert the values for each category into quantities. For practical reasons, we decided to work only with the most relevant products in terms of quantity and significance for the diet. We must also restrict this operation to those products for which there is data in the sources for the three selected years. In certain cases, unfortunately, we cannot assess the quantities despite their relevance because there is no detailed quantitative information, as in ‘the market’ (fruits, vegetables, lamb, and maybe poultry as well), which represented around 13% and 14% for 1835 and 1849, respectively. Let us see the resulting table (Table 5).
Clearly, the fall we have already noticed in the values is also reflected in Table 5. The reductions were about 50% comparing the first year to the last one, although it was greater if we consider 1835 as a starting point, because that year the quantities of several products had been increased remarkably, for instance meat, sugar, or yerba mate. Considering only 1825 and 1849, it seems that meat was one of the least affected by this decrease in volume, which confirms again the low elasticity of meat consumption and its decisive relevance for the local diet of this period.
The relatively low price of this product in Buenos Aires, as we will see, explains this occurrence (Gelman and Santilli, 2014a). Poultry, as we said, could have been substituted by vegetables and other produce within ‘the market’. The purchases of yerba mate almost disappeared from the list, which is quite strange considering the relevance of this product for the local population. Milk also shows a peculiar feature in this list: contrary to the trend of other foodstuff, milk consumption seems to have increased at a level maintained even in the last year under study, when the figures for all the other products dropped.
But we have not discussed yet a category that was certainly the most important, at least in terms of value, for the Hospital budget and which had a growing relevance within it: bread. Its share in terms of value went from 26% in 1825 to 34% 10 years later, and finally reached 49% in 1849. The Hospital spent $1075 (pesos fuertes) in 1825; $1297 (pesos fuertes) in 1835; and $1014 in 1849. This can be explained mostly by the recurring fluctuations of the price of wheat, which motivated the regulations on the bread market repeatedly.11
However, we face serious challenges when trying to determine the quantity of bread the Hospital actually bought, due to the systems of record used by the Hospital administration, and the bakers’ tactics to avoid the Government control on the price of bread. The unit price seems to have remained stable in pesos (paper currency) during our period, which sounds certainly hard to believe, given the devaluation of the local paper currency and the often severe fluctuations of the wheat price. The bread price oscillated between 6 and 8 reales (paper currency). Converted to pesos fuertes, that means the price dropped from 6 reales to less than one real since 1825 until 1849. Of course, as we know, bakers cheated on the unit price, highly controlled by the authorities, by reducing the weight of each piece of bread, or using low quality flour.
Thus, according to colonial testimonies, bread was sold at 17 oz/piece, but in 1853 bakers were forced to restore the weight to 8 oz/piece instead of 6 oz as it was reported by the authorities.12 Comparing these two cases, being the nominal price similar but the kinds of bread very different, we can say that the colonial piece of bread was almost three times bigger than in 1853.
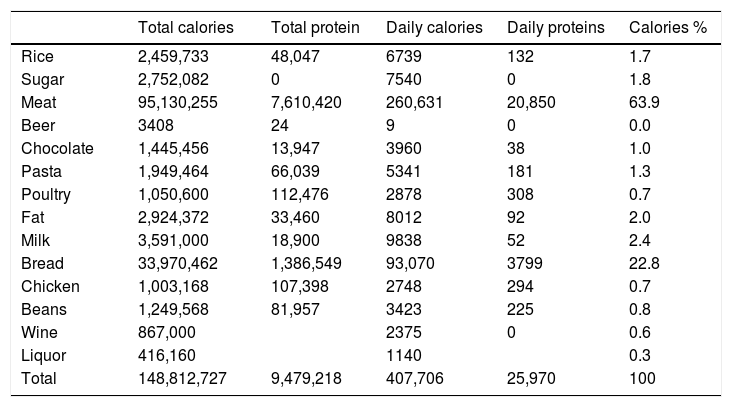
5Converting food quantities into caloriesOur third step to build the basket is to convert the main food categories of the basket into calories, in order to generate a basket with the same calories of the international baskets built by Allen et al. As we said, we would add to that basket an extra percentage as an estimated cost of cleaning, light, fuel, cloth, and rent. Let us consider, as a reference point for comparison, a basket created out of the Hospital list of expenses for 1835.13 Considering the figures, we have already seen that bread had the largest share, followed by meat and the ‘market’ (el mercado) in third place, a category that included fruits, vegetables, lamb, or fish. Since we have no quantitative detail of these ‘market’ purchases, we decided not to include this category in the calories calculation for our basket.
For the rest of the categories, we have converted their respective magnitudes of quantity from the original Spanish customary units of measurement into the International System of units: libras (pounds) and arrobas were converted into kilos, while limetas and cuarterolas were converted into litres. For bread we have taken the least favourable estimation, but the most probable, given the available information on wheat prices: 8 oz/piece at 6 or 8 reales each. Our main goal is to establish the caloric content of food so that Allen's method can be applied to our BBB (Allen, 2001). As we have already stated, the formalization of this method stems from the basic notion that a human being needs a minimum of 1941cal and 80g of protein per day to survive (Allen, 2001, p. 421). With this reference, we can calculate the composition of the basket in Buenos Aires. Using the chart of caloric contents included in Allen's work, plus other equivalences, we have converted into calories the 1835 purchase list of the Buenos Aires Women's Hospital. And the result is given in Table 6.
Calories content of the Hospital purchases (1835).
| Total calories | Total protein | Daily calories | Daily proteins | Calories % | |
|---|---|---|---|---|---|
| Rice | 2,459,733 | 48,047 | 6739 | 132 | 1.7 |
| Sugar | 2,752,082 | 0 | 7540 | 0 | 1.8 |
| Meat | 95,130,255 | 7,610,420 | 260,631 | 20,850 | 63.9 |
| Beer | 3408 | 24 | 9 | 0 | 0.0 |
| Chocolate | 1,445,456 | 13,947 | 3960 | 38 | 1.0 |
| Pasta | 1,949,464 | 66,039 | 5341 | 181 | 1.3 |
| Poultry | 1,050,600 | 112,476 | 2878 | 308 | 0.7 |
| Fat | 2,924,372 | 33,460 | 8012 | 92 | 2.0 |
| Milk | 3,591,000 | 18,900 | 9838 | 52 | 2.4 |
| Bread | 33,970,462 | 1,386,549 | 93,070 | 3799 | 22.8 |
| Chicken | 1,003,168 | 107,398 | 2748 | 294 | 0.7 |
| Beans | 1,249,568 | 81,957 | 3423 | 225 | 0.8 |
| Wine | 867,000 | 2375 | 0 | 0.6 | |
| Liquor | 416,160 | 1140 | 0.3 | ||
| Total | 148,812,727 | 9,479,218 | 407,706 | 25,970 | 100 |
We must emphasize that the indicated values are the minimum: other products consumed by the Hospital are missing in Table 6 as we cannot reconstruct the quantities purchased of them, as we have already stated. The full basket would include also fruits, eggs, vegetables, fish, and lamb. All these products were part of the diet and they can be relevant for our project. In pesos, they represented around 15% of the Hospital total food expenses. In regard to bread, we have taken the lowest value: 8 oz.
As it is evident in Table 6, the caloric contribution of meat was substantial: 63.9%. Bread came far second as the best source of calories with 22.8%. The remainders are virtually insignificant in this ranking that could be changed only if we were able to assign an accurate value to the missing categories. Probably, wine would bring down the percentage share of meat, but only moderately because a litre of wine has but a third of the calories in 1kg of meat (Allen, 2001, p. 421).
However, it is not possible to establish that equivalence now as we lack of reliable data so far, but we have used other sources of information instead, because wine – although it was not decisive for its caloric content – was a very usual beverage in Buenos Aires and it did matter in terms of cost. Relevant information can be found in the studies on wine production in the provinces of San Juan and Mendoza, the main suppliers of wine and aguardiente (liquor) for Buenos Aires. According to Samuel Amaral, in the first decade of the 19th century the province of Mendoza exported 15,000–26,000 arrobas of wine to Buenos Aires every year, and 2000 arrobas of aguardiente (1990, pp. 20–21). During the same decade, the province of San Juan sent approximately 2000–5000 arrobas of wine, although there was a peak of 10,050 arrobas; and the figures for liquor reached an average of 13,000 arrobas, with a peak of 20,000 arrobas (Amaral, 1990, pp. 11–12). Also Garavaglia and Prieto offer information on this matter: in 1789, only the province of Mendoza sent 21,332 arrobas of wine and liquor (Garavaglia and Prieto, 2007, p. 26). We can estimate then the consumption of wine and liquor in Buenos Aires, considering both the rural and urban population, before the full liberalization of the port in 1810, at 25,000 arrobas of wine and 12,000 arrobas of liquor (aguardiente). Converted to litres, at a rate of 16l for one arroba, according to Felipe Senillosa's writings (Senillosa, 1835, p. 17), the referred consumption figures are equal to 400,000l of wine and 192,000l of liquor. If we consider that the population of Buenos Aires (city and countryside) was 80,000 inhabitants approximately in those years, the average consumption would be 5l of wine and 2.4l of liquor per year.14 If 1l equals 850 calories, this estimated consumption of alcoholic beverages represented 1% of the total calories consumed. This means that the incidence of the alcoholic beverages in terms of calories was minimal.
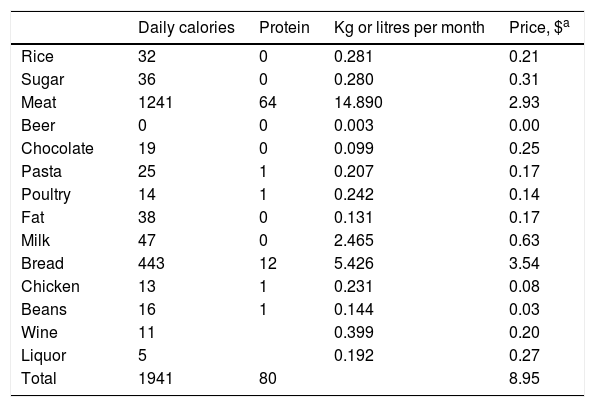
Now, with these percentages we can make an approximation to the composition of our ‘respectable’ basket for Buenos Aires in 1835, with Allen's 1941 calories as a reference (Table 7).
Respectable basket composition –Buenos Aires, 1835.
| Daily calories | Protein | Kg or litres per month | Price, $a | |
|---|---|---|---|---|
| Rice | 32 | 0 | 0.281 | 0.21 |
| Sugar | 36 | 0 | 0.280 | 0.31 |
| Meat | 1241 | 64 | 14.890 | 2.93 |
| Beer | 0 | 0 | 0.003 | 0.00 |
| Chocolate | 19 | 0 | 0.099 | 0.25 |
| Pasta | 25 | 1 | 0.207 | 0.17 |
| Poultry | 14 | 1 | 0.242 | 0.14 |
| Fat | 38 | 0 | 0.131 | 0.17 |
| Milk | 47 | 0 | 2.465 | 0.63 |
| Bread | 443 | 12 | 5.426 | 3.54 |
| Chicken | 13 | 1 | 0.231 | 0.08 |
| Beans | 16 | 1 | 0.144 | 0.03 |
| Wine | 11 | 0.399 | 0.20 | |
| Liquor | 5 | 0.192 | 0.27 | |
| Total | 1941 | 80 | 8.95 |
As we can see, when the basket calories are converted into quantities and values, bread regains the incidence it had in the Hospital total expenses. However, its contribution in terms of calories was much lower than meat, which, on the contrary, had a minor figure in terms of value but it takes the lead by far in the calories chart. The relevance of meat in the local diet is confirmed once again. For this category, the per capita consumption for the late colonial times calculated by Juan Carlos Garavaglia (1994) was 193kg, while for the decade of 1820 that figure had dropped to 158kg (1994, pp. 91–92). Our basket denotes a higher level of meat consumption: 220kg per capita. But we must remember that we decided not include other kinds of meat (lamb or pork, for instance) that would reduce that figure for bovine meat. Moreover, Garavaglia's calculation includes all inhabitants (even children), while our estimation is based on the caloric needs of an adult.
In terms of their calories contribution to the diet, the meat share was almost 64% and the bread share was 22%. But in terms of value, meat drops to 33%, while bread ends up first in the chart with 40% of the basket cost. It is easy to understand that any fluctuation in the price of bread had a tremendous incidence on the basket, and in case of a rise in the wheat price, probably leading to the substitution of bread for another product – meat, most likely.15 For this major difference between prices and calories of both staples, it is likely that the poorer sectors would also increase the purchase of meat when the bread price went up, while the better off consumers would probably buy more bread and other foodstuffs, probably more expensive and less rich in calories.
For this reason, in order to construct our BBB basket, we will take only a few products, among which meat will have a great share, as it was the most inexpensive of the highly caloric foodstuffs in Buenos Aires. This was notably the contrary to the European, Asian or other Latin American cases. On the other hand, for the ‘respectable’ basket we will take a greater variety of foodstuffs and more bread than in the BBB, keeping the share of bread we have found in the Hospital sources.
Thus, according to the proposed method, in 1835 the ‘respectable’ basket for an adult would be $8.95 monthly, considering only food. Also according to this method, the wage is supposed to sustain the household head, his wife, and two children (each child consuming half the calories of an adult), which means a total of three basic baskets for the entire household.16 Of course, these criteria can be discussed: Allen's method implies a generalization that is hard to apply to all the European societies he studies, and this is even more so for the cases in the Americas we are analysing.17
Just to mention a little ‘detail’ for the Buenos Aires case, we know that nuclear families were formed by an average of five people. However, in order to establish the comparison of our case to other societies, we will follow Allen's household composition of three adult equivalents (i.e. a man, a woman and two children). We will add to this basic basket the consumption of yerba mate, a common staple of the local diet which bears no calories contribution, though. In the case of the Hospital, this item meant an extra $0.45 to the BBB for an adult in 1835, making the final total $9.40.
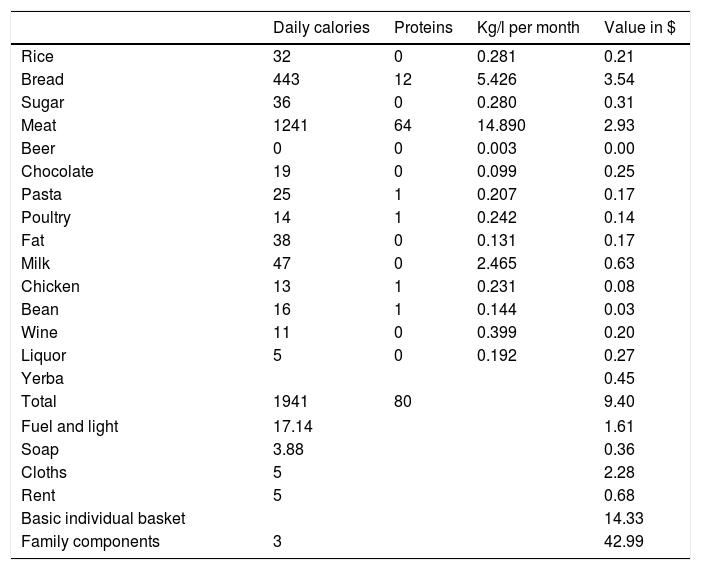
Furthermore, Allen also takes into consideration the incidence of other costs, such as cleaning, light, and fuel for heating and cooking. In our case, the Hospital expenses on this category were equal to 21%18 of the expenditure on foodstuff, according to our calculation. We have also included the presumable cloth consumption, estimated for the BBB in 3m per year of baize (bayeta), a coarse woollen fabric which was very popular in Buenos Aires for cloth-making, while we have calculated 5m of baize per year for the ‘respectable’ basket. According to our source from the Hospital, the cost of 1m of baize in 1835 was $5.46. Thus, the ‘respectable’ basket would be as follows.
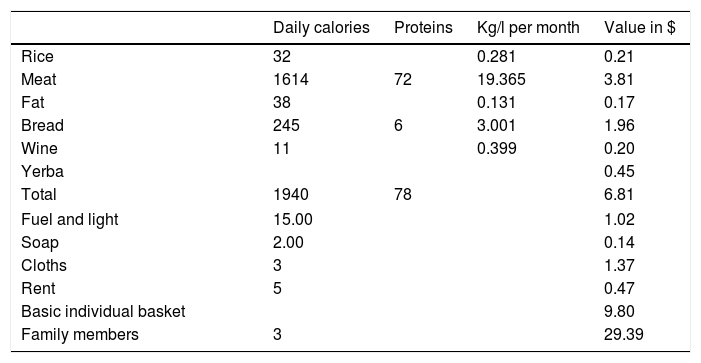
We will later discuss this ‘respectable’ basket. According to Allen's methodology (Allen, 2001; Allen et al., 2012; Challú and Gómez Galvarriato, 2015), in order to build a BBB, we should take into consideration cheaper and more basic foodstuffs than those included in Table 8, so we eliminated the products one might consider dispensable, leaving only rice, meat, fat, wine, and yerba mate. We have also reduced by half the amount of bread, due to its high relative cost in Buenos Aires.19 We have replaced all the dispensable foodstuffs with an increase in the share of meat. Moreover, we have cut the expenses on heat and light to 15%, while soap was reduced to 2%. The estimated cost of cloth was left in the minimum figure of 3m of baize per year for each member of the household, as it is usual in the literature. Table 9 shows this BBB for 1835.
Respectable basket.
| Daily calories | Proteins | Kg/l per month | Value in $ | ||
|---|---|---|---|---|---|
| Rice | 32 | 0 | 0.281 | 0.21 | |
| Bread | 443 | 12 | 5.426 | 3.54 | |
| Sugar | 36 | 0 | 0.280 | 0.31 | |
| Meat | 1241 | 64 | 14.890 | 2.93 | |
| Beer | 0 | 0 | 0.003 | 0.00 | |
| Chocolate | 19 | 0 | 0.099 | 0.25 | |
| Pasta | 25 | 1 | 0.207 | 0.17 | |
| Poultry | 14 | 1 | 0.242 | 0.14 | |
| Fat | 38 | 0 | 0.131 | 0.17 | |
| Milk | 47 | 0 | 2.465 | 0.63 | |
| Chicken | 13 | 1 | 0.231 | 0.08 | |
| Bean | 16 | 1 | 0.144 | 0.03 | |
| Wine | 11 | 0 | 0.399 | 0.20 | |
| Liquor | 5 | 0 | 0.192 | 0.27 | |
| Yerba | 0.45 | ||||
| Total | 1941 | 80 | 9.40 | ||
| Fuel and light | 17.14 | 1.61 | |||
| Soap | 3.88 | 0.36 | |||
| Cloths | 5 | 2.28 | |||
| Rent | 5 | 0.68 | |||
| Basic individual basket | 14.33 | ||||
| Family components | 3 | 42.99 | |||
Bare Bone Basket 1835 (subsistence).
| Daily calories | Proteins | Kg/l per month | Value in $ | ||
|---|---|---|---|---|---|
| Rice | 32 | 0.281 | 0.21 | ||
| Meat | 1614 | 72 | 19.365 | 3.81 | |
| Fat | 38 | 0.131 | 0.17 | ||
| Bread | 245 | 6 | 3.001 | 1.96 | |
| Wine | 11 | 0.399 | 0.20 | ||
| Yerba | 0.45 | ||||
| Total | 1940 | 78 | 6.81 | ||
| Fuel and light | 15.00 | 1.02 | |||
| Soap | 2.00 | 0.14 | |||
| Cloths | 3 | 1.37 | |||
| Rent | 5 | 0.47 | |||
| Basic individual basket | 9.80 | ||||
| Family members | 3 | 29.39 | |||
Thus, the cost of the basket is reduced by 32%, and the resulting ratio is 1.46. It must be noted that such ratio was lower than the ratios in other cases, like Mexico, where the ratio oscillated between 2 and 2.27 in 1835 (Challú and Gómez Galvarriato, 2015, p. 117). The low BBB in our case could possibly be explained by the high relative price of bread in Buenos Aires. Despite we have reduced its impact proportionally, it seems to inflate still the basic basket. The same can be said of cloth, which had relatively high prices in Buenos Aires. We could argue that in the case of low income families, these categories (bread and cloth) were probably the most likely to suffer cuts in times of necessity, due to their weight in a household budget. Meanwhile the expenditures on meat were rarely affected by budget restrictions, due to its relevance for the local diet and its inexpensive price in Buenos Aires. On the contrary, the weight of meat in the consumption of a low income family would probably increase in case of hardship.
We have also constructed a third basket, based on the consumption budget of a group of labourers from Montevideo, analysed by Moraes and Thul (2015). The composition of this budget does not differ substantially from the lists we have used in our studies, except for its caloric content, estimated in 2930 daily calories per capita. This figure is higher than Allen's ‘respectable’ calculation of 2500 calories for the English workers during the Industrial Revolution (Allen, 2009, p. 762, Table 2.1). This figure based on the source from Montevideo is even higher than the standard value for many international studies, which we used previously as a reference in our baskets. The cost of this new basket of 2930 calories, according to our prices of 1835, would be $14.01 for the individual basket and $60.56 for the family basket with all the additional costs previously considered. Thus, the relation between the BBB and this new ‘respectable’ basket would be 2.06. It is a closer estimation to the one provided by Challu and Gomez Galvarriato (2.25) or Allen for London: 2.29 (Challú and Gómez Galvarriato, 2015, pp. 95, 102; Allen et al., 2011, p. 45, Table 4). However, considering the major caloric difference between the Montevideo source and the international studies we use for comparative purposes, this last basket will not be taken into consideration for the rest of our study.
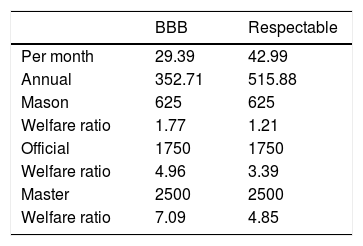
6The welfare ratio of urban Buenos AiresIn order to calculate the welfare ratio of Buenos Aires city, we have used the wages database we generated from the same sources analysed for the consumption baskets, namely the wages paid to the masons by the Hospital. According to the methodological framework (Allen, 2001), we have estimated that these masons worked for 250 days per year (Table 10).
Buenos Aires welfare ratio for a mason's annual salary (in Pesos, 1835).
| BBB | Respectable | |
|---|---|---|
| Per month | 29.39 | 42.99 |
| Annual | 352.71 | 515.88 |
| Mason | 625 | 625 |
| Welfare ratio | 1.77 | 1.21 |
| Official | 1750 | 1750 |
| Welfare ratio | 4.96 | 3.39 |
| Master | 2500 | 2500 |
| Welfare ratio | 7.09 | 4.85 |
The wage for the lowest category of masons (peón) was higher than the cost of the basic basket, by almost 75%. The difference in the WR between this category of masons and the maestros and oficiales was remarkable. And if we consider the ‘respectable’ basket, the lowest wages were 21% higher than the cost of that more varied and comfortable basket, which allowed the worker a relative margin of choice between expenditures in case of necessity – for instance, reductions in the consumption of certain expensive foodstuffs without affecting the household basic needs, in order to provide for extraordinary costs, such as health care in case of illness, or a rise of the housing cost (rent).20
Let us see a comparison between these values for 1835 and the figures for 1825 and 1849, the three years of our baskets. Unfortunately, the Hospital did not hire masons in 1825, but there is an alternative source for this year: the labourer wages compiled by Barba (1999, p. 82). According to his work, the average wage was $1.40 per day. Although this value should be verified with further research, it is similar to the wages referred by another Historian for the same period (Barba, 1967). In regards to the wages in 1849, the Hospital sources offer one only case, so we have decided to explore the Hospital records for the preceding years as well as the information on wages for other public works in 1849, taken from our previous research (2014b). Thus, according to our calculation, the average mason wage in 1849 was $12 per day. The results for the welfare ratio is shown in Table 11:
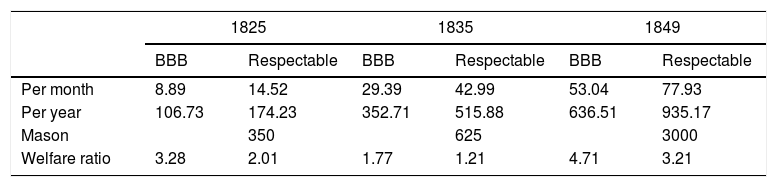
Buenos Aires welfare ratio for a mason's annual salary (in Pesos, three years).
| 1825 | 1835 | 1849 | ||||
|---|---|---|---|---|---|---|
| BBB | Respectable | BBB | Respectable | BBB | Respectable | |
| Per month | 8.89 | 14.52 | 29.39 | 42.99 | 53.04 | 77.93 |
| Per year | 106.73 | 174.23 | 352.71 | 515.88 | 636.51 | 935.17 |
| Mason | 350 | 625 | 3000 | |||
| Welfare ratio | 3.28 | 2.01 | 1.77 | 1.21 | 4.71 | 3.21 |
The ratio for 1825 was very high, in fact, as we will see later, it was among the highest welfare ratios for other cities around the world. The difference between the WR based on the BBB and the WR for the ‘respectable’ basket shows also a very high level of satisfaction of the household needs, which would have allowed a certain margin of accumulation for this type of worker. It is likely that a mason's family in Buenos Aires might be larger than the household considered by Allen, but probably the household income in our case was also higher than in Allen's, because it probably included more than one wage.
Yet, to grasp more accurately the evolution of the welfare ratio for the Buenos Aires masons, we have calculated it for 1810, based on Lyman Johnson's information about wages and prices (1990). The daily pay for an unskilled mason was 5 reales, and the annual cost of the basic basket was $209.90, so the mason's annual salary (working 250 days a year) was not enough to afford the basket: his welfare ratio was just 0.74. Hence, even if we still need more data for those early years and a complete series of prices and wages for the entire period, we could say that the standard of living of an unskilled worker improved remarkably over 40 years (1810–1849). The salary of 1810 doubled by 1825, then it dropped in 1835, though it still remained above the initial value, and then it rose again notably by 1849, when it tripled the 1810 salary. Moreover, the welfare ratio was more than six times higher. The salary had increased more than the prices, so the wages won the race against inflation this time!
7The welfare ratio of rural Buenos AiresDuring this period, farming was the most dynamic sector of the Buenos Aires economy by far. Thus, a study of the living conditions must pay attention to the rural workers. Although not all of them were salaried labourers, or depended exclusively on wages, they had a superlative relevance within the economy, due to the workforce shortage in this region and its growing demand. However, we must keep in mind that – according to many well-known sources – rural workers used to get rations of meat for their daily consumption from their employers. Also they were given some tracts of land for lodging, where they built a shack (rancho) and produced part of their food (vegetables, poultry, etc.). It is impossible to estimate exactly how these conditions could reduce the cost of their consumption basket, but we can calculate a basket without the cost of meat and housing (rent).21
Let us see the WR for that basket (Table 12).
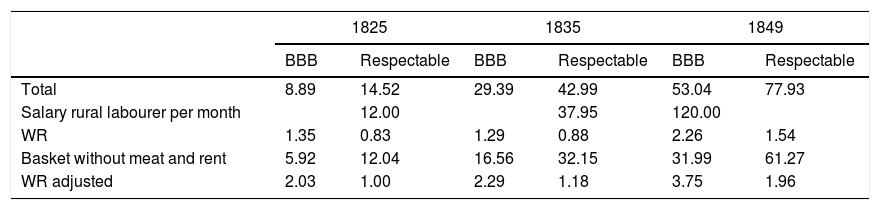
Welfare ratio for a rural labourer (in Pesos, three years).
| 1825 | 1835 | 1849 | ||||
|---|---|---|---|---|---|---|
| BBB | Respectable | BBB | Respectable | BBB | Respectable | |
| Total | 8.89 | 14.52 | 29.39 | 42.99 | 53.04 | 77.93 |
| Salary rural labourer per month | 12.00 | 37.95 | 120.00 | |||
| WR | 1.35 | 0.83 | 1.29 | 0.88 | 2.26 | 1.54 |
| Basket without meat and rent | 5.92 | 12.04 | 16.56 | 32.15 | 31.99 | 61.27 |
| WR adjusted | 2.03 | 1.00 | 2.29 | 1.18 | 3.75 | 1.96 |
As we can see, the welfare ratio for the rural salaried labourers based on their BBB is higher than the subsistence level for every year, either they get lodging and meat rations from their employers or not. Their WR is negative only when considering a full ‘respectable’ basket, that means, if they did not get meat rations or lodging in two out of the three years under study. However, even in that case, the margin of reduction of their purchasing power seems relatively minor. If we consider, instead, that they did get rations and lodging, they had a much more favourable margin, doubling the previous figure. In 1849 the wage of the rural labourer almost quadruplicated the cost of the BBB. In regards to the ‘respectable’ basket, that wage was higher than the cost of that basket for two out of the three years selected in our study, or at least paired the value for 1825.
Thus, it is easier to understand why so many people migrated from other regions of Rio de la Plata into the Buenos Aires plains to work as salaried labourers. We could add more to this picture, for as many studies on the Buenos Aires rural population have proved for this period that many of the migrants who came to the province and worked for a wage in a chacra (farm) or estancia (ranch) were single men, for whom the welfare ratio is completely different, provided that their income would not be shared with a household of four (or Allen's three adult equivalents). It has been stated that often, when a single male labourer constituted a family in Buenos Aires rural areas, he also started other economic activities on his own, which eventually meant an extra income for the family as a complement to the monetary wages perceived. Once again, the actual calculation for the welfare ratio must be very different for these workers.
Anyway, with this data in mind we can say that the income of a mason was enough to afford the BBB. In 1825 his welfare ratio was more than twice of that of the rural labourer (if we assume that rural labourers had to buy meat and pay rent). And even in 1835 when the urban WR dropped, it was still better than the WR for the rural labourer by almost 40%. The remarkable improvement of the decade of 1840 can be noticed here in the rise of the unskilled mason's wage, which reaches more than 4.5 minimum baskets, exceeding by far the figure for the rural labourer. However, if we consider that the rural labourer had access to meat rations and lodging, the incomes of both kinds of workers – rural and urban – were similar. And for 1835 the rural purchasing power was even higher than the urban. This is consistent with a labour market in which the circulation of workers between urban and rural areas was very fluid.
If we compare the urban and rural ‘respectable’ baskets, in 1825 the urban WR duplicated the rural ratio, but in 1835 they were virtually equal. Meanwhile, in 1849 the urban ratio was ahead again by more than 60%. We can conclude, then, that in spite of the importance of the rural economy for Buenos Aires prosperity, the urban salaried workers – at least the masons – were generally better off than the rural labourers. However, it is likely that rural workers had a relative advantage over the urban workers during high inflation years, thanks to the non-market access to food (i.e., meat rations and self-cultivation).
Therefore, we can affirm that workers who purchased their means of subsistence in the market achieved fairly good standards of living in Buenos Aires.
8A significant difference and a necessary discussionThese results so far diverge substantially from the conclusions presented by Leticia Arroyo Abad et al. for Buenos Aires in the late colonial period and the early years after independence. According to her research, the local welfare ratio was 9.47 since 1775 until 1820 (2011, p. 46), and 5.22 in 1830 (Arroyo Abad, 2013, p. 132). The difference between these conclusions and our results is not minor and deserves careful attention and verification.
First, we must point out that Arroyo Abad et al. constructed a basket which is different from ours. According to their calculation, wheat provided 1218 calories/day; and meat, 719 calories/day.22 That means a 63% for wheat (bread) and 37% for meat, a proportion which is the inverse to ours.
Observing the database used in their work23 we are able to compare in detail their calculations to ours. First, they have welfare ratio information for 1775–1811 and also for 1827–1860. For the earliest period, according to the database they use, the welfare ratio was 6.82, while for 1830 it was 3.44 (see the “Argentina wages” sheet). As we have already pointed out, their basket for the whole period is constructed using only meat and wheat information, to which they add an estimated cost for soap, light, and fuel (34% when prices are not indicated), a percentage that is reduced when the database includes the price of any of these products. Thus, our BBB is more comprehensive, for it takes in other foodstuffs, such as rice, oil, and wine.
But the most important difference can be noticed in the wages: our welfare ratio is constructed upon the wages for urban unskilled workers (masons) and rural labourers, while Arroyo Abad's analysis is based on other kinds of workers, as we will see.
For 1775–1809, the authors use the information on the mason's wage provided by Lyman Johnson (Johnson and Tandeter, 1990) A mason's daily pay was 8 reales in 1770, 4 reales in 1775, and 5 reales in 1808 (Johnson, 1990, pp. 137–138, Table 1). As Arroyo Abad et al. reached a figure of 204 pesos (1 peso=8 reales), we must understand that they took into account only the highest wage (8 reales/day) for the whole period. This decision is hard to understand, but it seems logical that if they take in the highest wage, they will get the highest welfare ratio…
By 1809, their figure reaches 382.80 pesos/year, which equals 15 reales/day for a year of 200 working days. This means 37.50 pesos/month, which seems an extraordinary figure if we consider that a rural labourer hardly made 10 pesos/month, and a sailor could get 13 pesos/month. According to Johnson, a mason's wage was 5 reales/day, which means about 10 pesos/month (for a year of 200 working days as calculated by Arroyo Abad et al.) or 13 pesos/month (if we consider Allen's year of 250 working days).
For the period after 1810, their reference is the wage of the doorman (portero) at the Government House, according to Barba (1999). We are not discussing here the authors’ choice on this type of wage and whether it is representative of the urban wages in Buenos Aires, but clearly it is a remarkably different value from the case of our mason, even if we consider the official's or master's wages. While our unskilled urban worker made 5 reales a day, Arroyo Abad's doorman got 33 pesos/month in 1810. In annual terms, it means 125 pesos/year for the mason and 396 pesos/year for the doorman. Let us consider the values for 1825, a more suitable year for a comparison to our work24: while a mason's daily pay was 1.40 pesos, the doorman's monthly wage was 25 pesos, which means in annual terms $280 and $300, respectively. In 1835, our base year, the mason's wage was 2.50 pesos/day, while the rural labourer's was $37.95 a month, and the doorman's was $66. In annual terms, it means $500 for the mason, $455.40 for the rural labourer, and $799.20 for the doorman, respectively.25
Hence we may conclude that beyond all the differences already stated the main disagreement is rooted in the type of wage taken into account for the welfare ratio.
The authors’ calculation for 1835, using the doorman's wage, leads to a welfare ratio of 3.16. If we use the rural labourer's wage instead, the welfare ratio is 1.29. And for the mason, the welfare ratio is 0.74, even in 1810, when the ratio was 4.4 according to the authors. If we adjust the mason's wage according to Johnson, the ratio of Abad et al. is 1.74.
Hence, the image of Buenos Aires as a “promised land” for unskilled workers seems quite inaccurate, even if, as we will see, the situation of the porteño workers was not bad at all in a comparative perspective.
9Buenos Aires wages from a comparative perspectiveLet us compare, then, our welfare ratio for urban unskilled workers (masons) to the figures provided by Allen and other researchers using the same method. Unfortunately, there are still no comparable studies for other regions of Argentina. We will present the information comparing both the WR vis a vis the BBB and the ‘respectable’ basket (Table 13).
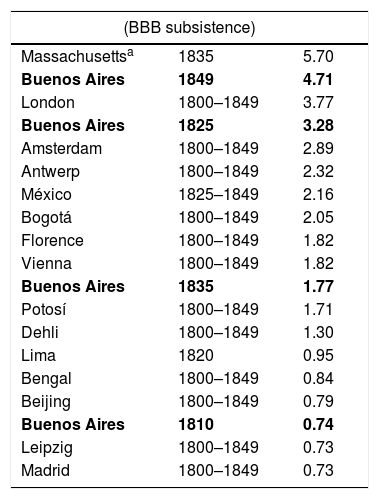
Welfare ratio in selected cities, 19th century.
| (BBB subsistence) | ||
|---|---|---|
| Massachusettsa | 1835 | 5.70 |
| Buenos Aires | 1849 | 4.71 |
| London | 1800–1849 | 3.77 |
| Buenos Aires | 1825 | 3.28 |
| Amsterdam | 1800–1849 | 2.89 |
| Antwerp | 1800–1849 | 2.32 |
| México | 1825–1849 | 2.16 |
| Bogotá | 1800–1849 | 2.05 |
| Florence | 1800–1849 | 1.82 |
| Vienna | 1800–1849 | 1.82 |
| Buenos Aires | 1835 | 1.77 |
| Potosí | 1800–1849 | 1.71 |
| Dehli | 1800–1849 | 1.30 |
| Lima | 1820 | 0.95 |
| Bengal | 1800–1849 | 0.84 |
| Beijing | 1800–1849 | 0.79 |
| Buenos Aires | 1810 | 0.74 |
| Leipzig | 1800–1849 | 0.73 |
| Madrid | 1800–1849 | 0.73 |
This value has been taken from (Allen, 2009, Fig. 2.4). We do not know the exact number of the WR, because the author only shows the graphic.
Considering our BBB figures, or what we could understand as a poverty line in contemporary terms, the only value in Buenos Aires below that minimum is that of 1810, but even in that case our calculation is very close (and sometimes slightly above) the values for other cities, such as Madrid or Leipzig. But later, during the early years of the cattle-farming boom in the decade of 1820, the WR based on the BBB indicates good standards of living in Buenos Aires, in comparison to most of the cities with available data. While the 1835 figures are virtually in the middle of the chart we have built, the other two years of reference (1825 and 1849) rank extraordinarily high within the top four. One of these values even overtakes London's ratio for the first half of the 19th century. Buenos Aires in 1849 was only below Massachusetts WR, which confirms one of the reasons for the European migration to the Americas during the 19th century: the relative high standards of living of the cities of the New World compared to Europe.
So far, according to the available information, welfare ratios higher than the Buenos Aires WR can be found only in some cities of the United States, where the labour market and the access to basic resources were probably more convenient than in Buenos Aires in that period.
As we pointed out, the cost of the BBB in Buenos Aires seems quite inflated by the prices of the little share of bread and cloth included, so that we could built a new BBB reducing even more the consumption of this categories in favour of meat, one of the cheapest foodstuffs in Buenos Aires. This new BBB would probably improve even more the local WR. Not by chance, many early 19th century witnesses emphasized these favourable standards of living in Buenos Aires, especially when comparing to England at that time (Barba, 1967).
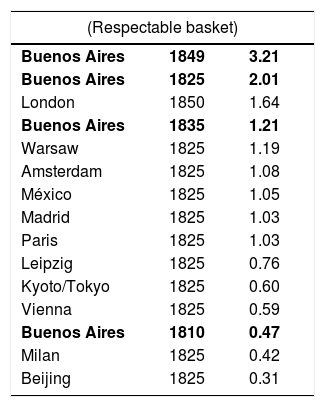
If we consider the ‘respectable’ basket for comparative purposes, the standards of living in Buenos Aires seem even better, ranking up in 1825 and 1849 with welfare ratios higher than London's and other cities with available and comparable data. This can be explained by the difference between both baskets, which in our case was smaller than in other studies. Thus, as we can see in Table 14, Buenos Aires ranked high in the chart for the three years under consideration in our analysis, and only for 1810 it was in a lower position.
Welfare ratio in selected cities, 19th century.
| (Respectable basket) | ||
|---|---|---|
| Buenos Aires | 1849 | 3.21 |
| Buenos Aires | 1825 | 2.01 |
| London | 1850 | 1.64 |
| Buenos Aires | 1835 | 1.21 |
| Warsaw | 1825 | 1.19 |
| Amsterdam | 1825 | 1.08 |
| México | 1825 | 1.05 |
| Madrid | 1825 | 1.03 |
| Paris | 1825 | 1.03 |
| Leipzig | 1825 | 0.76 |
| Kyoto/Tokyo | 1825 | 0.60 |
| Vienna | 1825 | 0.59 |
| Buenos Aires | 1810 | 0.47 |
| Milan | 1825 | 0.42 |
| Beijing | 1825 | 0.31 |
Although much more research work is still needed to cover the Buenos Aires case, and even more for other regions of Argentina, the data we have presented and discussed in this paper provide an important basis to understand many economic and social phenomena of our region in the first half of the 19th century.
10ConclusionsThroughout this study we have analysed the basic consumption standards of Buenos Aires between 1825 and 1849 and the welfare ratio as it was proposed by Robert Allen, considering the minimum basket (the BBB) and the so called ‘respectable’ basket, probably a more suitable index for urban workers (2001, 2012, 2009). This method seems adequate, as we aim to analyse the standards of living in a comparative way. According to the results, we can see that urban workers in Buenos Aires, depending basically on monetary salaries, usually had wages above the minimum level of subsistence for a household, and even in certain years their wages were much higher than the subsistence level. Comparing those levels to the available data for other cities in the world, we have found that Buenos Aires urban wages ranked among the highest, not just in terms of the satisfaction of the basic human needs, according to Allen's ‘bare bone’ basket, but also with regard to what the literature calls a ‘respectable basket’. This remarkable position of the Buenos Aires welfare ratio in the international chart may be explained because of the relative shortage of workers in the region during a period of fast economic growth, frontier expansion, and abundance of land to produce staples demanded by the Atlantic economy. Another important factor that helps us understand these values is the abundance of meat, and its consequent low prices in relative terms. Quite logically, beef was the first choice of consumption among the lower income sectors, while those with higher incomes could afford a more varied diet with fewer calories in terms of price. Thus, we can understand better the chroniclers from the late colonial times or the first half of the 19th century, who described – overreacting – the local diet in the Rio de la Plata region as based exclusively on beef, as the Spanish royal commissioner Felix de Azara wrote in the beginning of the 1800s.
Although the welfare ratio calculations for the unskilled rural labourer's wage based on Allen's method turned out to be negative for 1825, the final picture we get seems quite good for the rural workers of Buenos Aires in the period under consideration. On one hand, as we have pointed out, along with their wages, rural labourers were usually entitled to some rations of meat and some ‘vicios’ (i.e. tobacco, or yerba mate). It is also likely there was more than one income in each household, although real families must have been normally larger than Allen's model of four individuals. On the other hand, we know that in this region, especially in rural areas, it was possible to get access to tracks of land to produce foodstuff for self-consumption, and even a surplus to sell in the nearby urban market. Thus, migration to Buenos Aires was not only attracted by salary but also by this possibility of land access – under various titles – to produce for the household consumption. Some migrants were clearly attracted by salaries: most of them were single young men, as we know, so their welfare ratio does not correspond with a household of four individuals. And we are also aware that those young workers who formed a couple, and later a family, in many cases also launched some sort of independent economic activity, which improved the family income in addition to the wages that the head of the household (and eventually also an older son) would earn.
Therefore, in order to assess the standard of living in Buenos Aires, it seems not enough to construct a basket of prices, analyse the local wages, and calculate the welfare ratio. Even when the method is suitable as an indicator of the means of subsistence for the poor, we must keep in mind that one of the factors in the calculation – wage – was not the only household income, or that eventually the household could have more than one wage. These alternatives must be explored. How many individuals within the household worked at home? From what age did children start working? Moreover, how can we assess the non-monetary contributions to the household income (probably more important than monetary wages in some cases)? Or self-employment, either rural or urban… There are still many questions to answer.
Therefore, Buenos Aires urban wages as well as the complex income of rural workers, with their land access and rations, denote that the living standards for the poor were fairly good, especially in comparative terms. This explains why Buenos Aires attracted migration from inland regions during this period, as well as it began to receive immigrants from across the Atlantic, increasingly.
SourcesArchivo General de la Nación (AGN), Buenos Aires. Hospital de Mujeres. Sala III-16-9-3, Sala III-16-9-5.
We are grateful to Gerardo Sánchez, María Inés Moraes, and all the colleagues participating at sessions quoted in title note for their comments. We benefited also from the very thoughtful comments of three anonymous reviewers of IHE. We also appreciate the attentive reading of Jeffrey Williamson and his accurate observations.
Early versions of this work were discussed in the XXIV Jornadas de Historia Económica Argentina, Rosario (Argentina), October 2014, and the XVII World Economic History Congress, Kyoto (Japan), August 2015.
Jorge Gelman died on 16 December 2017. He was a great economic historian and IHE-EHR is very proud of publishing this posthumous article as a tribute.
Further discussion on the strength and validity of this method can be found in Revista de Historia Económica, vol. 33, no. 1, especially Dobado-Gonzalez (2015a), Arroyo Abad and van Zanden (2015) and Allen et al. (2015).
Source: Archivo General de la Nación (AGN) 1825 y 1835, Sala III-16-9-3, y 1849, Sala III-16-9-5. Food quantities, prices and wages have been taken from the same sources, unless otherwise stated.
The peso fuerte was the silver “piece of eight” (8 reales) from Spanish colonial times, which coexisted after independence with the peso moneda corriente or peso papel, a paper currency issued by the Buenos Aires government, which was declared non-convertible in 1825, generating violent depreciations due to massive emission during years of war and blockade.
According to Ruiz Moreno (1941, pp. 102, 134), the hospital had 70 patients in 1825, but that figure was reduced by half by 1842.
We assume that the increase of ‘church’ expenses is coherent to the ideology of Rosas’ regime, although one might also think of a stronger need to believe in miracles, given the severe cut in the Hospital budget, especially in the medicines category during the last period under consideration.
On this matter, see Halperín Donghi (2005), Newland (1992) and Garavaglia (2003).
We have some data for rent in the late colonial times by Johnson (1990). The author indicates a much higher cost for living in Buenos Aires, as much as 20% of a family budget. But he also states that workers usually shared rooms with other people or looked for houses in cheaper places outside the city (Barba, 1967). So far we consider that the 5% used by international literature may be accurate for our case.
We consider that the aforementioned purchase of 44 barrels of wine for $584 in December 1825 was speculative. Otherwise, the share of beverages would be 27% in 1825, on top of any other food category.
The abundance of cereals and specially wheat in colonial Buenos Aires was pointed out by Garavaglia (1991) and its decreasing importance after Independence has been noted by Djenderedjian (2008).
This policy and regulations, enforced by the Chief of Police and other authorities, can be found in the Registro Oficial de la Provincia de Buenos Aires since 1821 until 1855. We would like to thank Tomás Guzmán and Luis Dmitriuk for suggesting us to consult this useful source.
The colonial reference is taken from the note from Antonio Obligado to the Gobernador-Intendente, Buenos Aires, October 4, 1785 (Ravignani, 1912, p. 61). The 1835 reference has been found in a police published in El Monitor, no. 87, Buenos Aires, April 1, 1834. Another similar warning, issued by the market authorities (Inspección de Abasto), was also published in El Monitor, no. 150, Buenos Aires, June 16, 1834. We would like to thank Julio Djenderedjian and Tomás Guzmán for these informations. The 1853 reference was taken from El Progreso, July 5, 1853.
We have chosen 1835 because the records for that year provide the most complete basket in terms of amounts, prices, and variety of goods. The information for 1825 included the aforementioned purchase of wine, which makes it quite exceptional. Data for 1849 are quite reduced, due to the budget cuts, which could turn out an artificially smaller basket in relation to the actual consumption basket of Buenos Aires.
Presumably not everyone used to drink alcoholic beverages in Buenos Aires, and it is likely that the consumption of an average adult man would almost double these figures, but as we will multiply our individual basket by three in order to estimate a family basket, we will restore the full consumption of wine and liquor to this unit, even if only the man – and may be a little less the adult woman-drank.
Presumably not everyone used to drink alcoholic beverages in Buenos Aires and it is likely that the consumption of an average adult man would almost double these figures. However, we will multiply our individual basket by three in order to estimate a family basket, and later we will restore the full consumption of wine and liquor to this unit, even if these beverages were consumed only by men, or also by adult women, but probably to a lesser extent.
We have advanced this hypothesis in Gelman and Santilli (2014a).
Actually, Allen suggests an equivalent of 1.05 baskets for each adult or for two children, considering an additional 5% as household rent. For the comparative purposes of our study we will apply the same standards.
It is argueable if this applies to Eastern Europe, for instance, in the same way it applies to Western Europe. Did the families in Danzig, Cracow, or Warsaw have the same composition as the families in London, Amsterdam, or Paris? For the Latin American case, see the discussion proposed by Dobado (Dobado-Gonzalez, 2015a), and by the same author and Héctor García Montero (Dobado González, 2015b), among others. Also see Humphries (2011) and López Losa and Piquero Zarauz (2016).
This value was calculated by adding the percentages of expenditures on fuel and light (17.14%) and soap (3.88%), in relation to the total amount spent by the Hospital on foodstuff.
We consider that bread was substituted by a larger consumption of meat when the cost of wheat was high, as meat had a much lower price in Buenos Aires in relation to its caloric content (Gelman and Santilli, 2014a).
The WR for the basket based on the Montevideo source (2930 calories) was 0.86, which indicates that even with a minor reduction in its cost, the resulting standard of living was still ‘more than respectable’.
We have previously studied rural wages in Buenos Aires extensively in Gelman and Santilli (2014a,b).
For wheat or oat: 3370 calories×132kg per year. For meat: 2500 calories×105kg per year (Arroyo Abad et al., 2011, p. 45).
See the “prices-wages-argentina-bolivia” excel file at http://gpih.ucdavis.edu/Datafilelist.htm#Latam (last visit: July 2014). We thank Tomás Guzmán for this information.