

During the 1920s, the Colombian economy experienced the highest growth rate in its history. The economic reforms of 1923 (central bank, gold standard, banking legislation, fiscal reorganization), a coffee boom, and an unprecedented influx of foreign capital were the driving forces behind this success. The loans obtained by 1929 amounted to 257 million dollars. Those funds were used mainly to build much needed infrastructure, particularly railroads. In this paper, we estimate the rates of return of the investments made in Colombian railroads during the period 1924–1950. We consider that Colombia ended up paying only around 85% of the loans obtained in the 1920s, owing to the suspension of foreign debt payments; as a result, the profitability in the construction of railways was higher. The rates of return on the railroads constructed and extended in the 1920s are comparable to those obtained for European countries in the nineteenth century.
Durante los años veinte, la economía colombiana experimentó la mayor tasa de crecimiento de su historia. Las reformas económicas de 1923 (banco central, patrón oro, legislación bancaria y reorganización fiscal), el auge del café, y la afluencia sin precedentes de capital extranjero fueron las causas que impulsaron este crecimiento. Los préstamos hasta 1929 ascendieron a 257 millones de dólares y se utilizaron principalmente para la construcción de infraestructura muy necesaria, particularmente ferrocarriles. En este artículo, se calculan las tasas de retorno de la inversión realizada en los ferrocarriles colombianos durante el periodo 1924–1950. En estos cálculos, se considera que Colombia pagó el 85% de los préstamos que obtuvo en los años veinte, debido a los efectos de la Gran Depresión y a la suspensión de los pagos de la deuda externa. Como resultado, la rentabilidad de la construcción de ferrocarriles fue superior. Las tasas de retorno de los ferrocarriles construidos y ampliados en los años veinte son comparables a las obtenidas por los países europeos en el siglo XIX.
“The problem of transportation may be the most fundamental one in the economic history of the country”
The development of an efficient transportation system has always been a major challenge for Colombia. Its topography is one of the most rugged in the world, and the majority of its population lives in one of the three mountain ranges into which the Andes divide when they enter the south of the country. Gold was the main export during the colonial period and up to the mid nineteenth century, so the high costs of transportation were not a major obstacle for reaching international markets. Nevertheless, in the second half of the nineteenth century, when Colombia tried to integrate into the world economy through the exports of tropical products such as tobacco and coffee, internal freight costs became very important. Railroads were the main technological innovation of that century in land transportation. However, their construction in the territory which is now known as Colombia started very late in the century, and only a few, unconnected lines were built because the country was poor, it had weak institutions, and its mountainous topography made construction costs extremely high. It was only in the 1920s, when economic conditions changed, that it was possible to build a significant amount of railroad lines. Besides Colombia, other Latin American countries such as Argentina, invested a significant amount of resources in railroad development in the twenties. Salerno and Regalsky (2007) estimate that more than 30% of total investment in public works was allocated to railroads during this period in Argentina. According to them, the constructions undertaken in this period were finished mostly by the end of the twenties, and by 1930 the national network had grown more than 40% compared to 1920.1
The profitability of the boom in railroad construction and expansions was amply debated in the early 1930s in Colombia. The debate was highly politicized, and the consensus was that investment in railways in the 20s resulted in a waste of resources. However, very few authors actually evaluated those investments from an economic point of view and critics did not provide empirical evidence for that claim. In addition, very few studies quantified the effects of transportation infrastructure developments on the Colombian economy. The main exceptions were McGreevey (1975) and Ramírez-Giraldo (2001), who analyzed the impact of railroads on Colombian economic growth within the framework of cliometrics.
In particular, McGreevey (1975) estimated the rate of social saving for the Colombian so-called coffee railroads,2 as well as their average rate of return, in 1924 and for the average of 1936–1949. His conclusions were that coffee railroads were a good investment for Colombia, and that earlier railway investment was more profitable than the investment made in the twenties. Also, the estimated rate of social savings was comparable to the results obtained by Fogel for US railroads in the nineteenth century.
More recently, Ramírez-Giraldo (2001) studied the impact of railroads on the Colombian economy during the first half of the twentieth century. Particularly, by applying a social saving methodology, the paper compares railroads with mules and animal-drawn wagons, and examined their effects on the Colombian economy. Also, the author examined if the construction of railroads was a key determinant in boosting coffee exports, and if the decline in transportation costs due to the expansion in transportation infrastructure reduced divergence among agricultural prices across Colombian cities. The author concludes that railroads did not play an overwhelming role in the Colombia's economy during the first half of the twentieth century.3 The experiences of other Latin-American countries differ from Colombia's, where the effects of railroads on the economy were lower. For instance, regarding social savings, Ramírez-Giraldo (2001) estimate that social savings in Colombia represented between 7.9% and 3.4% of the GDP in 1927, assuming that mules and animal-drawn carts were the alternative means of transportation to trains, respectively. These estimations were much lower than those calculated for Brazil and Mexico. For Brazilian railroads, Summerhill (1995) calculated a social saving of 22% of the GDP in 1913, and for Mexican railroads Coatsworth (1981) estimated a social saving of 24% of the GDP in 1910. Additionally, Zegarra (2011) concluded that that the Peruvian population saved time traveling and transporting freight at lower costs with the construction of railroads.
Moreover, the development of railways was more beneficial to promote exports in other Latin American countries rather than in Colombia. Ramírez-Giraldo (2001) estimated that railroads did not play a significant role in the expansion of coffee exports in Colombia. Conversely, according to Coatsworth (1981), in Mexico half of the social savings originated in the export sector. Kuntz-Ficker (1999a) argued that not only railroads promoted exports in Mexico, but were also very important to integrate and expand the domestic market, which encouraged the formation of a national market.4Kuntz-Ficker (1999a) also claims that railroads encouraged production for the market, increased the level of capital formation, and raised the profitability of productive investment, which was in part re-oriented toward more dynamic sectors and regions (p. 134).5
Additionally, Summerhill (1995) stated that coffee growers in Brazil benefited largely from the reduction in transportation costs due to railroad expansion. Similarly, Zegarra (2011) found that railroads in Peru had a significant impact on the growth of copper, sugar, and cotton exports, and in Chile, Guajardo (2007) points out that railways expanded markets and trade relations, linked the country to the international economy, and integrated regional and local markets into a national structure.
The purpose of this paper is to analyze the economic results of the railroad construction effort in Colombia during the 1920s and to provide figures for the historical debate on railroad profitability. Specifically, we calculate the total annual rates of return for the period 1924–1950,6 extending the estimations for individual railroad lines and for freight and passenger transportation. This allows us to analyze the individual performances and determine if there were important differences in profitability among railroad lines. Additionally, we contribute to the literature by considering in the calculations the fact that, as a result of the Great Depression and the suspension of payments on foreign debt, Colombia ended up paying only a portion of the loans obtained in the 1920s. We use a detailed database of yearly investments, income, expenditures, number of passengers, tons of freight, and railroad tracks for fourteen Colombian railroads in the period analyzed.
Our estimations show that investments in Colombian railroads during the twenties were profitable, in contrast to the widespread belief that these resources were wasted. The rates of return of most railways were positive until 1943, when net revenues turned negative and many lines ceased to be profitable. The development of highway transportation, together with the competition that they brought to railroads, was one of the main causes for which railroads ceased to be profitable.
In the next section, we discuss the behavior of the Colombian economy during the period of 1920–1950, as well as the developments in the railroad network, emphasizing the role of investments in railroads made in the 1920s during the so called “Dance of Millions”. Section three analyzes the annual rates of return on Colombian railroads estimated for the period 1924–1950. Our conclusions are presented in the last section.
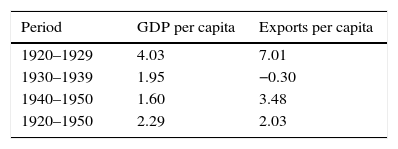
2The Colombian economy and the development of railroadsThe period from 1920 to 1950 was one of the most successful for the Colombian economy, in spite of the fact that the Great Depression was felt across the world early in 1929. Four main factors contributed to the rapid pace of economic growth during the first half of the twentieth century: export growth, foreign loans, advances in transport infrastructure, and import substitution industrialization. For the entire period, per capita exports grew at 2.03% annually and capita GDP at 2.3% (Table 1).
Growth rates of GDP and exports per capita: 1905–1950 (percentage).
| Period | GDP per capita | Exports per capita |
|---|---|---|
| 1920–1929 | 4.03 | 7.01 |
| 1930–1939 | 1.95 | −0.30 |
| 1940–1950 | 1.60 | 3.48 |
| 1920–1950 | 2.29 | 2.03 |
Even during the Great Depression, the country obtained relatively good economic results, since GDP per capita fell by only −2.8 and −3.6 in 1930 and 1931, and resumed its growth in 1932. By 1933, the country had surpassed its 1929 GDP per capita. A rapid expansion in coffee exports, helped by high prices on international markets, was the main stimulus for Colombia's high rate of economic growth during the first half of the twentieth century.
Revenues from coffee exports enabled Colombia to pay the external debt acquired in the nineteenth century. It also gave the government the possibility of accessing foreign loans for the first time since its independence. Even though the economic situation of the early 1920s generated a new optimism, private bankers in New York expressed great skepticism about the country's economic institutions when they were approached by Colombian government authorities. In 1923, Colombia invited a group of US economic experts led by Edwin W. Kemmerer to help in the modernization of its banking, monetary and fiscal institutions. A number of reforms were instituted as a result of the recommendations of the Kemmerer Mission. For example, an independent central bank was organized, the gold standard was adopted, a new banking law was passed, and a bank-supervisory agency was created, along with an entity to audit government expenditures. This institutional renovation paved the way for an influx of loans to the public and the private sectors (Meisel, 1990). In addition, the expansion of export and production capacity, especially that of the coffee sector, made the country more attractive to foreign investors (Echavarría, 1982).
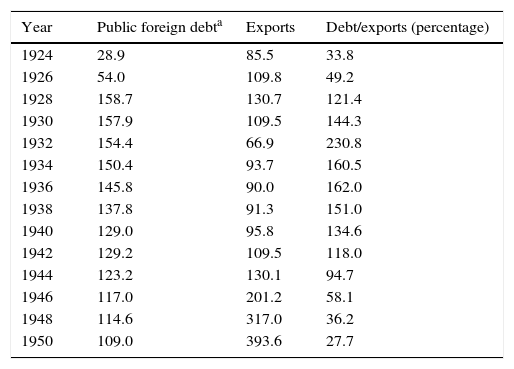
Between 1924 and 1929, an unprecedented amount of foreign capital arrived in the country, including the 25 million dollars that Colombia received in compensation for US intervention in the separation of Panama. By 1929, the level of public foreign debt had reached 162 million dollars. However, the flow of foreign loans ceased with the Great Depression and, as a result, the debt/export ratio dropped drastically (Table 2).
Foreign debt/exports: 1924–1950 (millions of US dollars).
| Year | Public foreign debta | Exports | Debt/exports (percentage) |
|---|---|---|---|
| 1924 | 28.9 | 85.5 | 33.8 |
| 1926 | 54.0 | 109.8 | 49.2 |
| 1928 | 158.7 | 130.7 | 121.4 |
| 1930 | 157.9 | 109.5 | 144.3 |
| 1932 | 154.4 | 66.9 | 230.8 |
| 1934 | 150.4 | 93.7 | 160.5 |
| 1936 | 145.8 | 90.0 | 162.0 |
| 1938 | 137.8 | 91.3 | 151.0 |
| 1940 | 129.0 | 95.8 | 134.6 |
| 1942 | 129.2 | 109.5 | 118.0 |
| 1944 | 123.2 | 130.1 | 94.7 |
| 1946 | 117.0 | 201.2 | 58.1 |
| 1948 | 114.6 | 317.0 | 36.2 |
| 1950 | 109.0 | 393.6 | 27.7 |
Note:
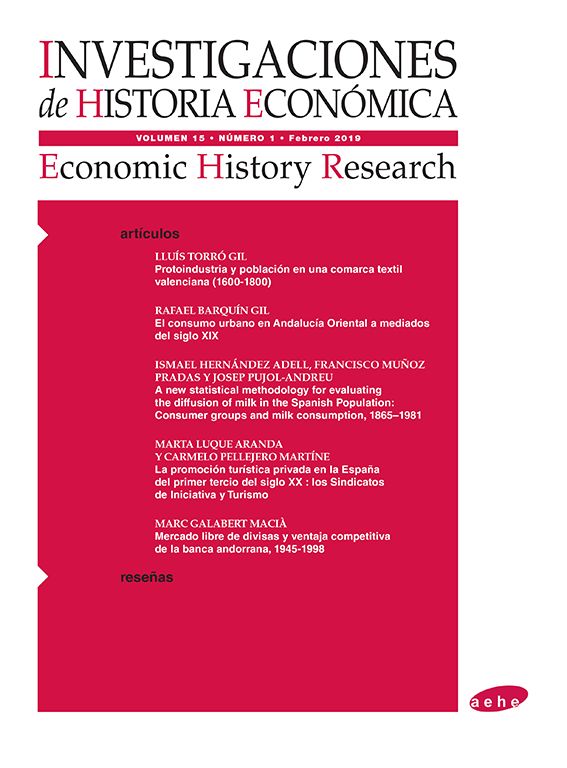
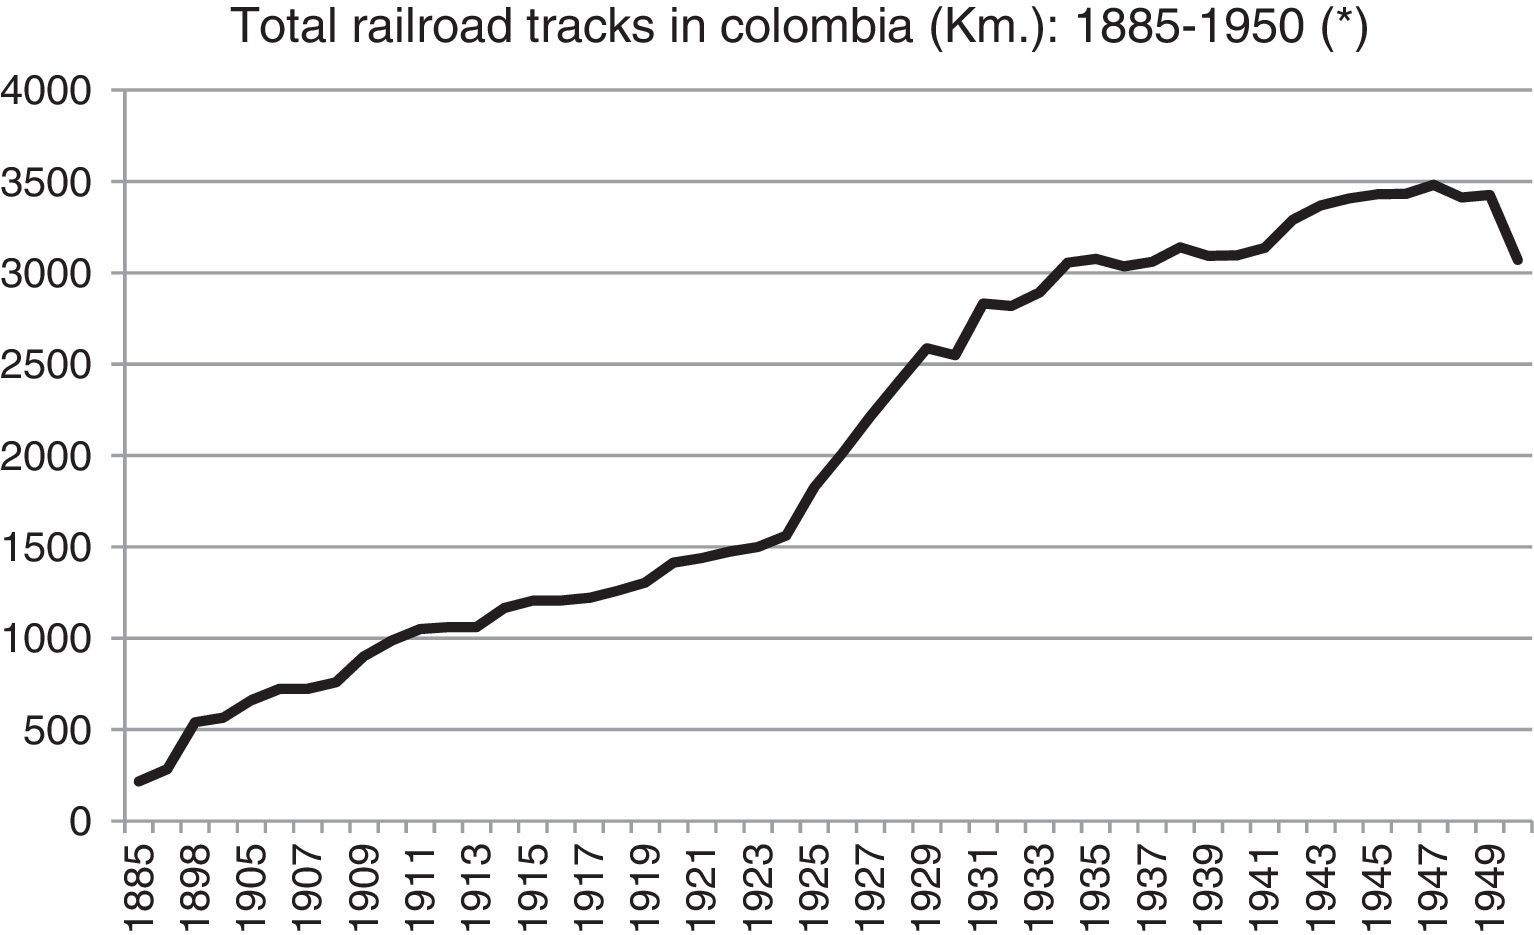
How did the country spend the 25 million dollar payment for Panama and the more than 160 million dollars borrowed by the public sector? Most of these resources were invested in public works related to transportation: canals, roads, bridges, and especially railroads. This is entirely understandable, because the country had an enormous lag in transportation infrastructure as a result of its poor export performance during the nineteenth century, its weak institutions, and it's extremely rugged topography.7 In 1920, for example, Colombia only surpassed Nicaragua and Haiti among the Latin American countries in railroad kilometers per capita (Fig. 1).8
.")
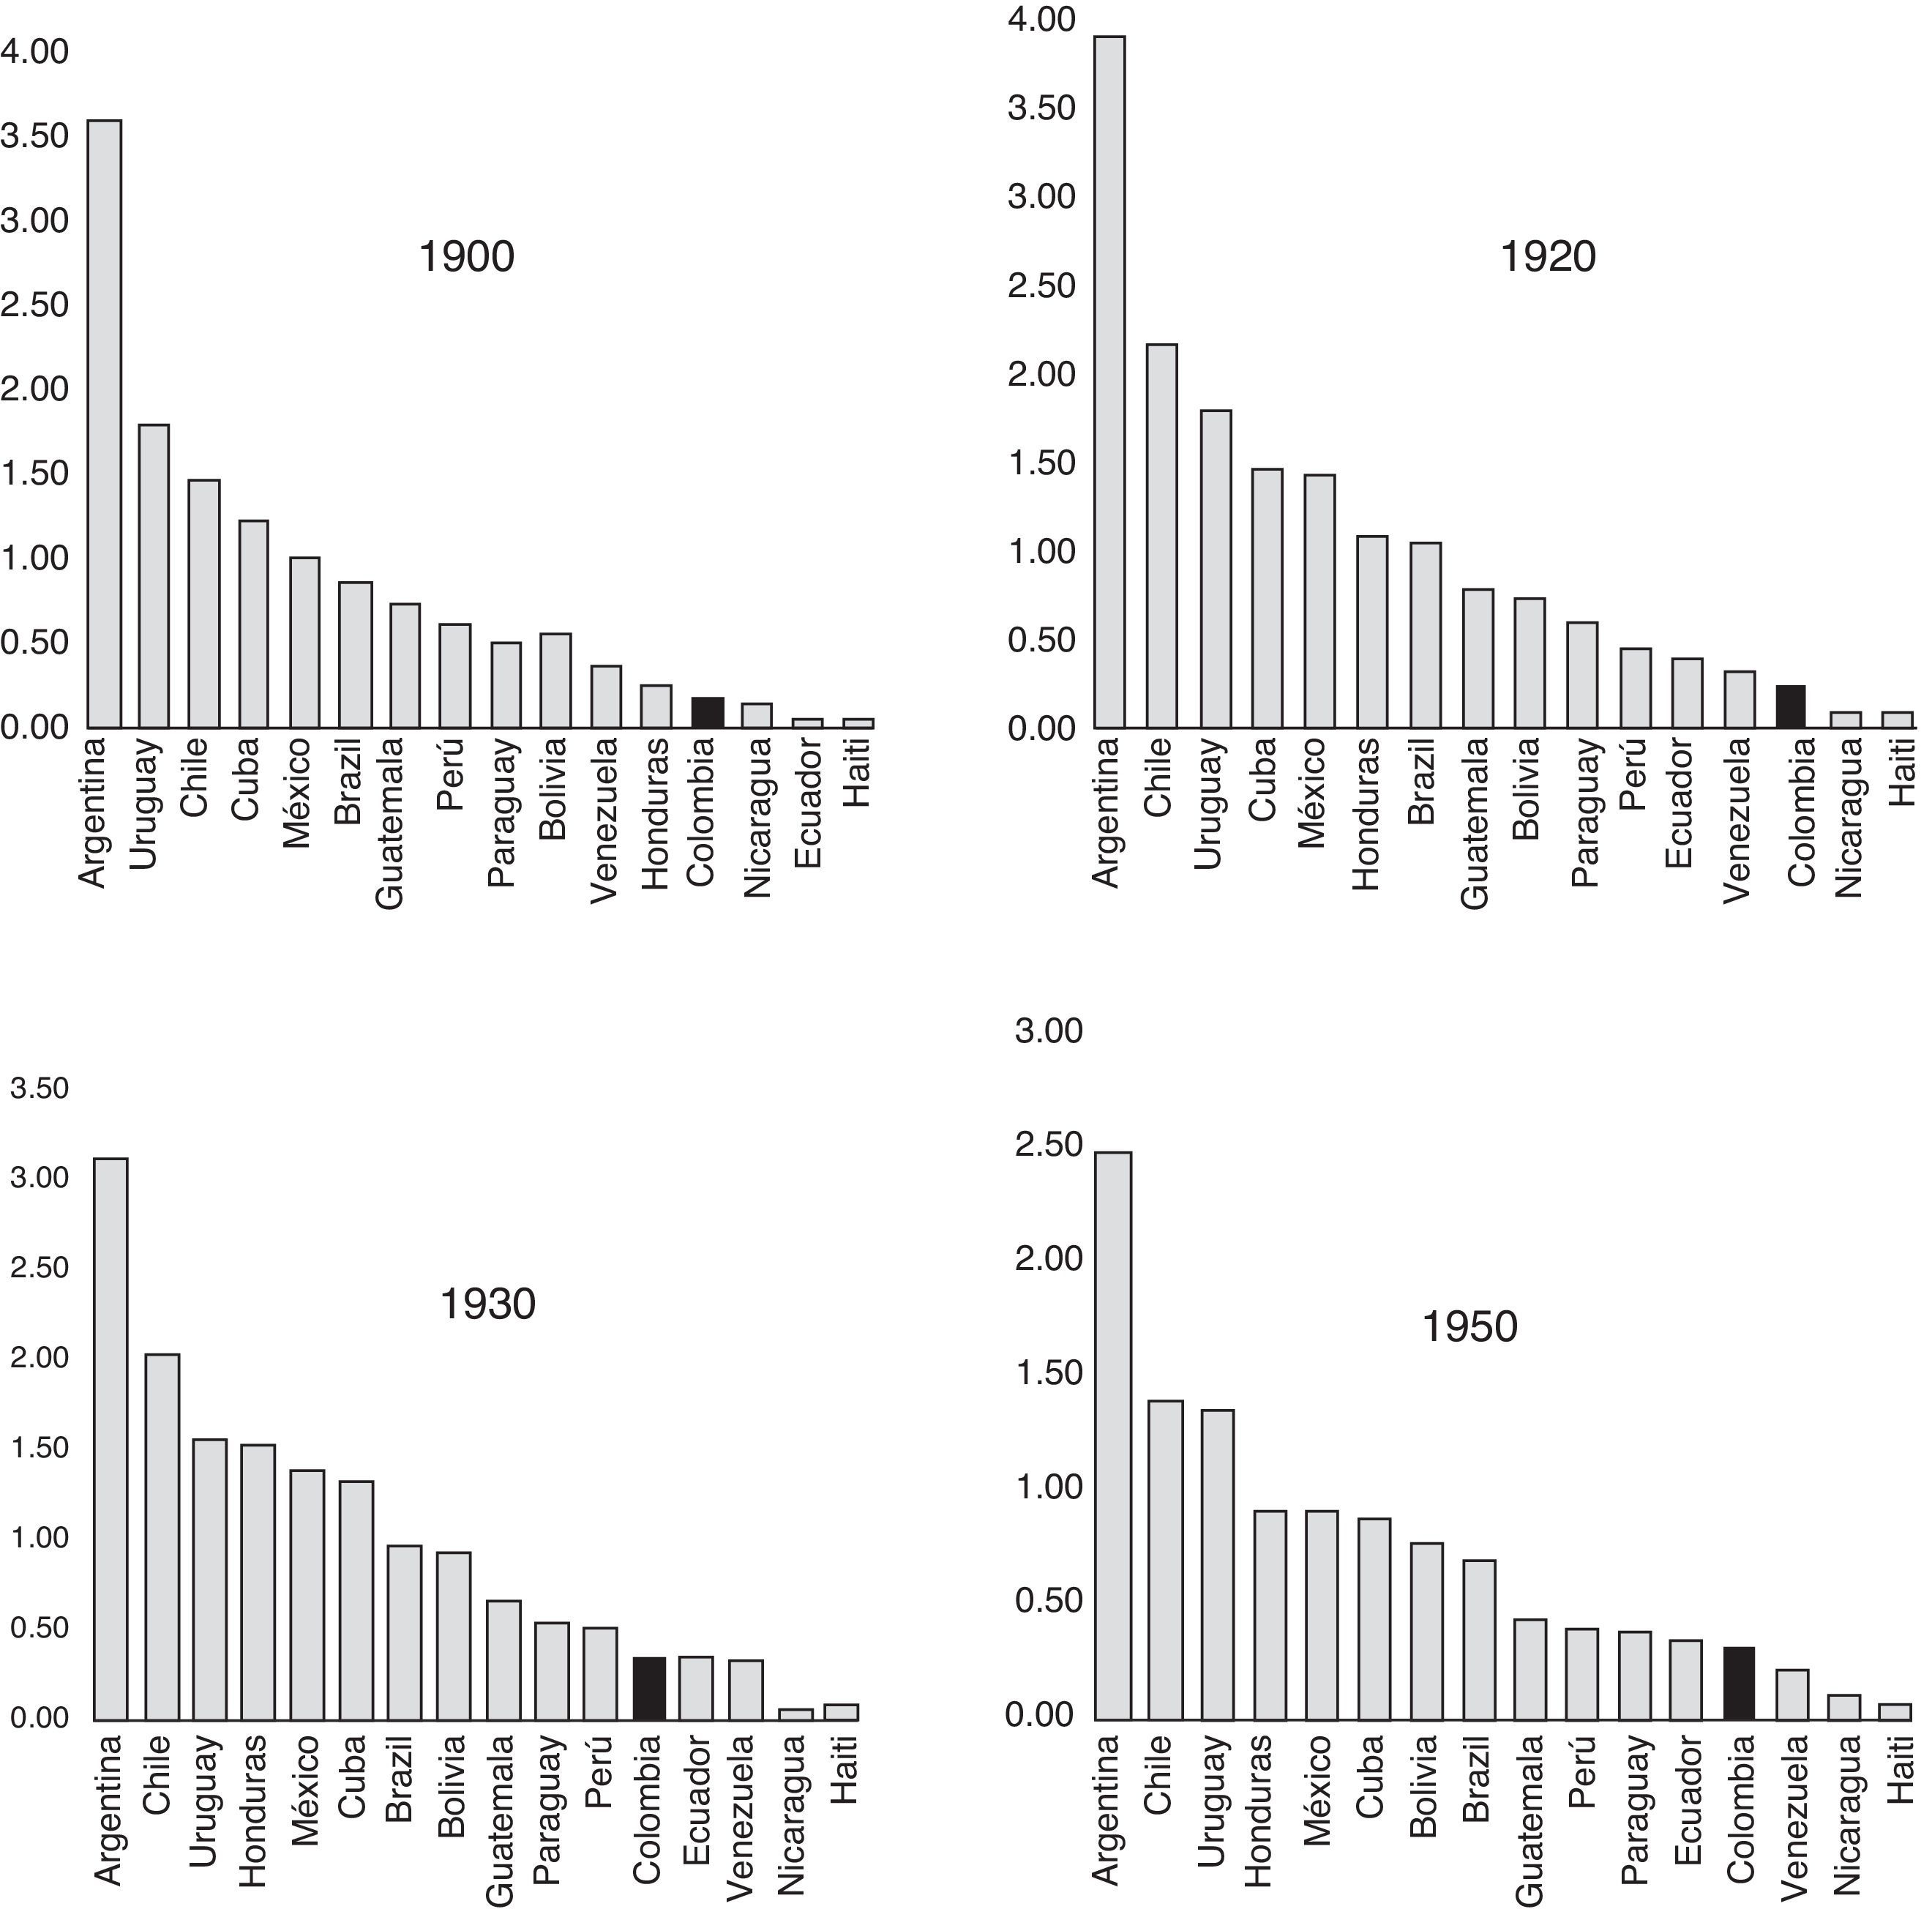
At the beginning of the 1920s, many Colombian leaders and foreign observers agreed that the country's main problem was its precarious transportation infrastructure. For example, in Edwin W. Kemmerer's view (Kemmerer, 1994), “Colombia is comparatively isolated from the rest of the world, mainly for lack of railroads. The great problem of Colombia is currently that of transportation.”9 In fact, by 1920, Colombia had only about 1300km of railroad lines, mostly concentrated in the central and northern regions of the country. The development of the railway system was very slow, and most lines were isolated from one another. They were typically short and only connected certain productive regions with the ports or the Magdalena River, but they did not link the main cities (Fig. 2).10

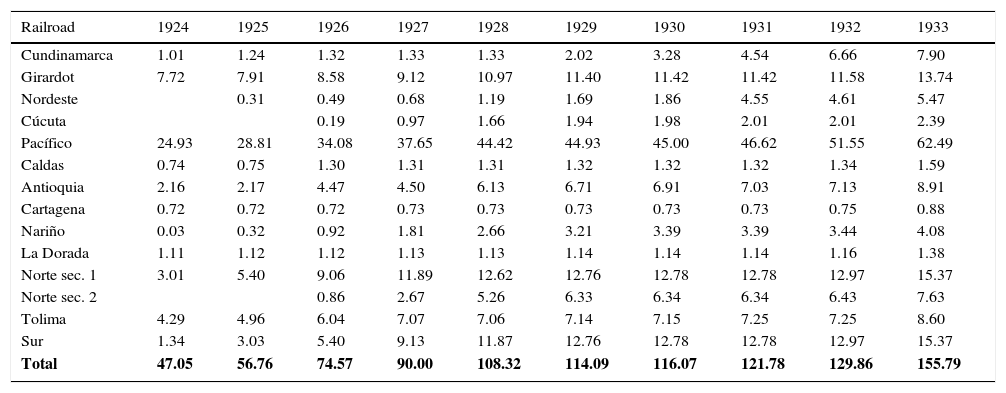
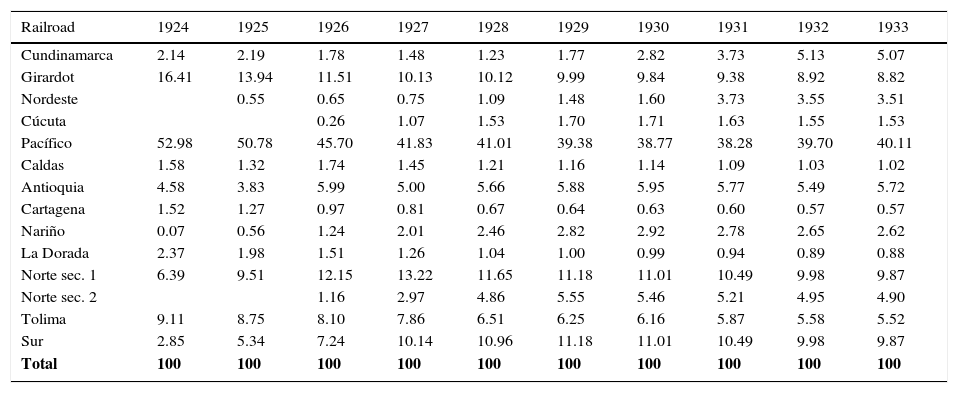
The amount invested in railroad construction up to 1929 represented 45% of foreign loans. Regarding the US compensation for Panama, about 65% was allocated to railroads.11 A large share of it was used to complete the construction of existing railroads, such as the Pacifico Line, the Norte Railway, and the Tolima Railroad, which had been started in the late nineteenth and early twentieth centuries (Table 3a).12
Investment per railroad: 1924–1933 (stock, millions of USD).
| Railroad | 1924 | 1925 | 1926 | 1927 | 1928 | 1929 | 1930 | 1931 | 1932 | 1933 |
|---|---|---|---|---|---|---|---|---|---|---|
| Cundinamarca | 1.01 | 1.24 | 1.32 | 1.33 | 1.33 | 2.02 | 3.28 | 4.54 | 6.66 | 7.90 |
| Girardot | 7.72 | 7.91 | 8.58 | 9.12 | 10.97 | 11.40 | 11.42 | 11.42 | 11.58 | 13.74 |
| Nordeste | 0.31 | 0.49 | 0.68 | 1.19 | 1.69 | 1.86 | 4.55 | 4.61 | 5.47 | |
| Cúcuta | 0.19 | 0.97 | 1.66 | 1.94 | 1.98 | 2.01 | 2.01 | 2.39 | ||
| Pacífico | 24.93 | 28.81 | 34.08 | 37.65 | 44.42 | 44.93 | 45.00 | 46.62 | 51.55 | 62.49 |
| Caldas | 0.74 | 0.75 | 1.30 | 1.31 | 1.31 | 1.32 | 1.32 | 1.32 | 1.34 | 1.59 |
| Antioquia | 2.16 | 2.17 | 4.47 | 4.50 | 6.13 | 6.71 | 6.91 | 7.03 | 7.13 | 8.91 |
| Cartagena | 0.72 | 0.72 | 0.72 | 0.73 | 0.73 | 0.73 | 0.73 | 0.73 | 0.75 | 0.88 |
| Nariño | 0.03 | 0.32 | 0.92 | 1.81 | 2.66 | 3.21 | 3.39 | 3.39 | 3.44 | 4.08 |
| La Dorada | 1.11 | 1.12 | 1.12 | 1.13 | 1.13 | 1.14 | 1.14 | 1.14 | 1.16 | 1.38 |
| Norte sec. 1 | 3.01 | 5.40 | 9.06 | 11.89 | 12.62 | 12.76 | 12.78 | 12.78 | 12.97 | 15.37 |
| Norte sec. 2 | 0.86 | 2.67 | 5.26 | 6.33 | 6.34 | 6.34 | 6.43 | 7.63 | ||
| Tolima | 4.29 | 4.96 | 6.04 | 7.07 | 7.06 | 7.14 | 7.15 | 7.25 | 7.25 | 8.60 |
| Sur | 1.34 | 3.03 | 5.40 | 9.13 | 11.87 | 12.76 | 12.78 | 12.78 | 12.97 | 15.37 |
| Total | 47.05 | 56.76 | 74.57 | 90.00 | 108.32 | 114.09 | 116.07 | 121.78 | 129.86 | 155.79 |
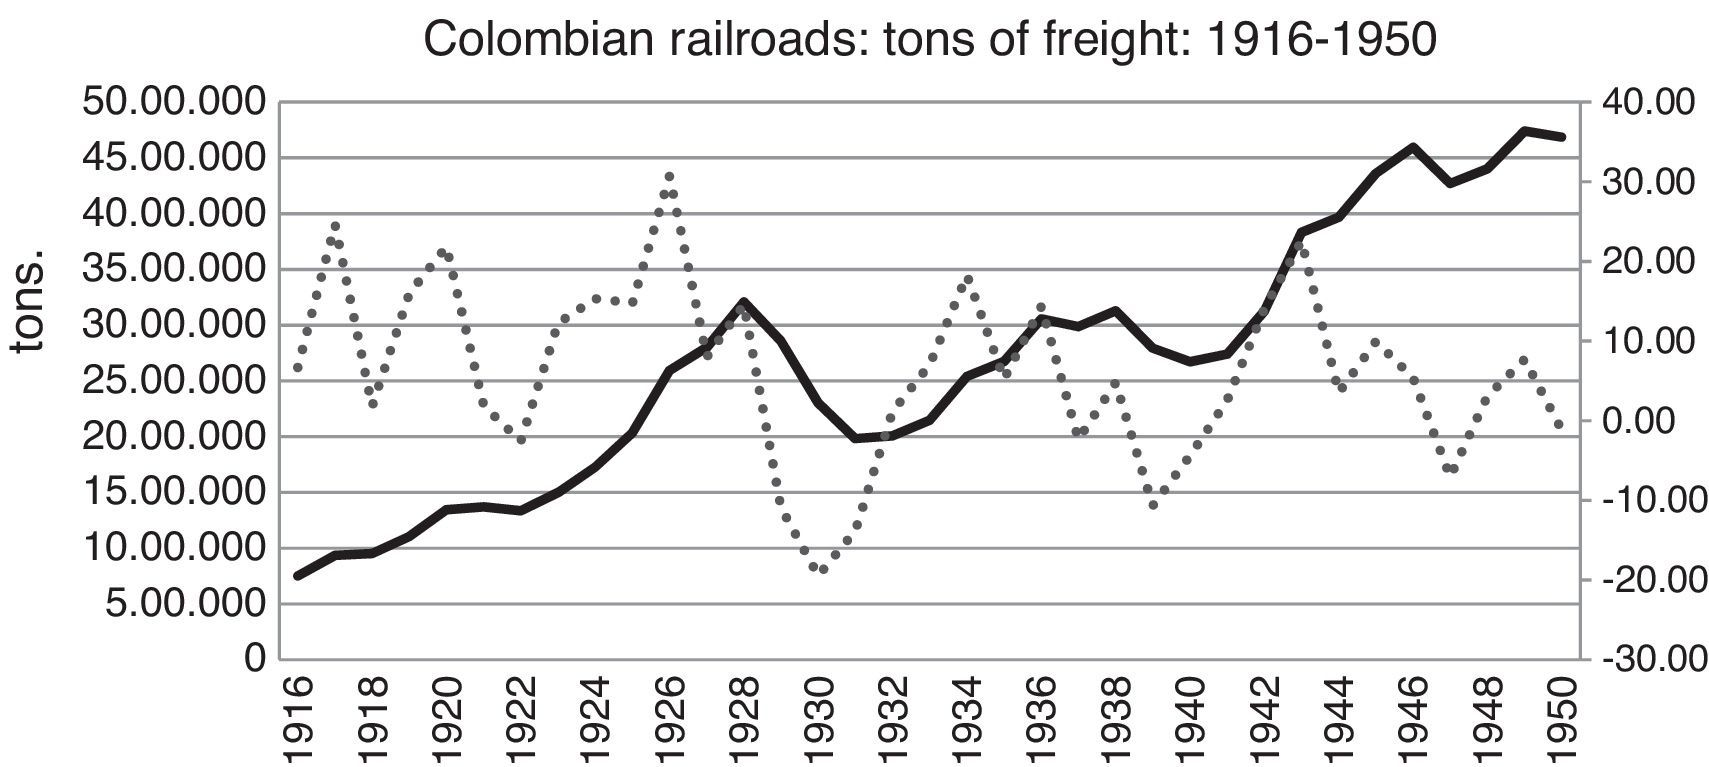
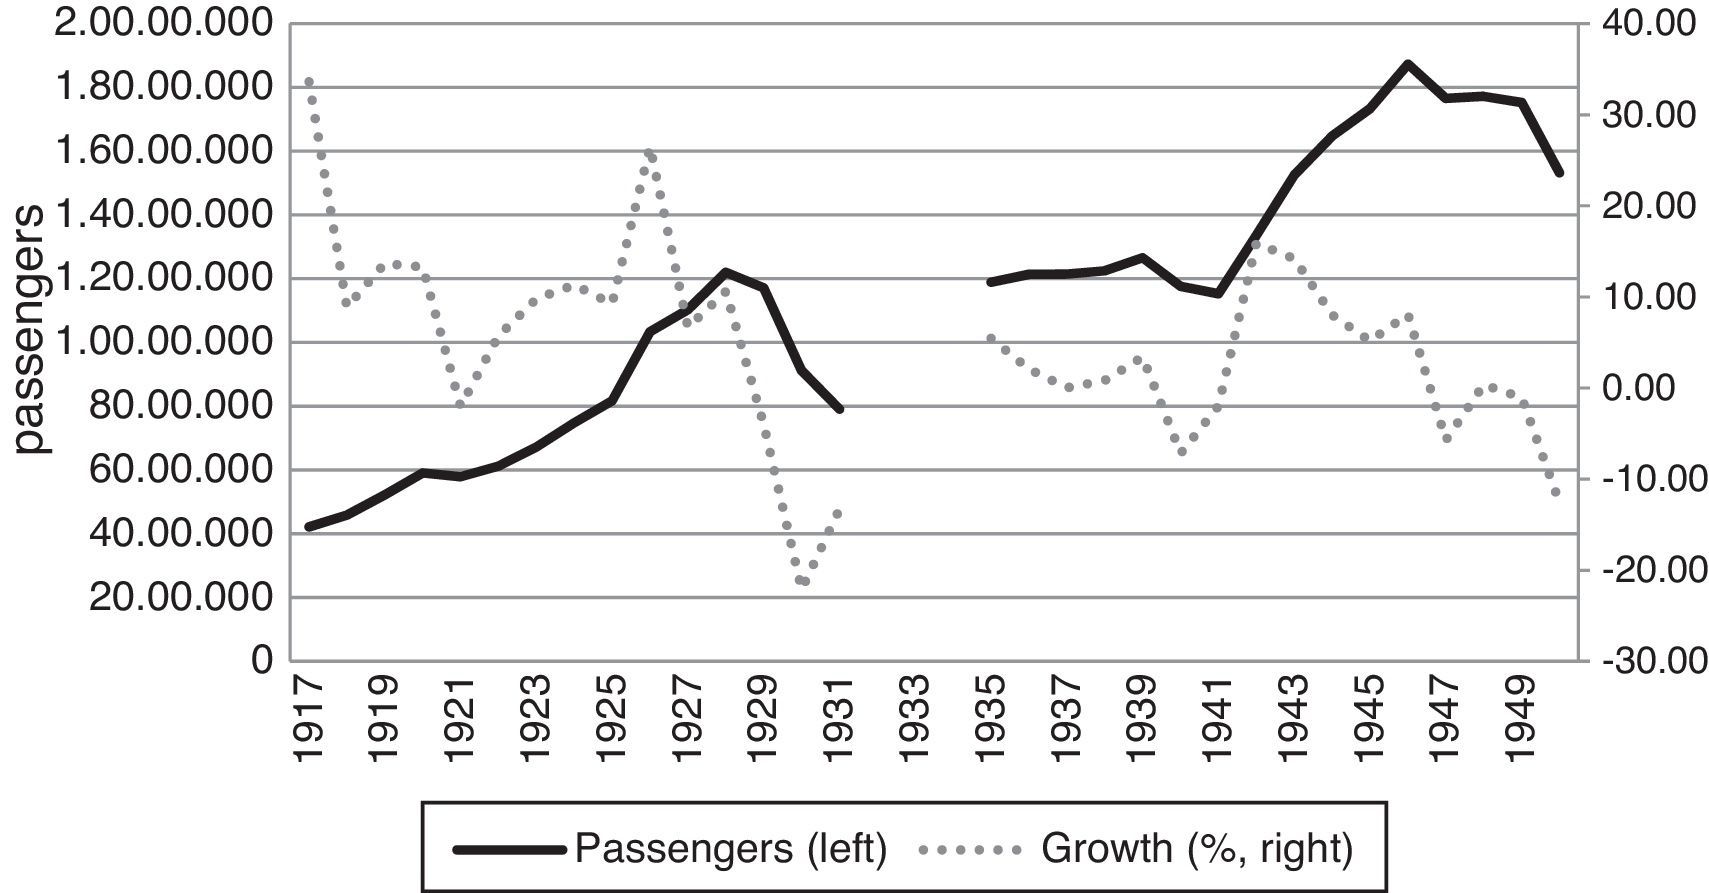
During this period, investment in railroads increased on average by 20% per year, representing about 7% of the GDP.13 The amount of railroad tracks increased from 1500km in 1923 to almost 2600 in 1929. The main increase in railway extension took place between 1925 and 1928. The Pacifico, Norte sections 1 and 2, and the Tolima railroads experienced the largest growth in kilometers and investment (Table 3b and Appendix 1). Those years also saw an expansion in freight and passengers transported by railroads, which grew at a rate close to 30% (Appendix 2). However, despite this increase in railroad extension, Colombia continued to lag by international standards. In 1930, railroad density was still very limited and the number of kilometers of railway per inhabitant remained one of the lowest in Latin America (Fig. 1).14
Investment per railroad: 1924–1933 (% of total investment).
| Railroad | 1924 | 1925 | 1926 | 1927 | 1928 | 1929 | 1930 | 1931 | 1932 | 1933 |
|---|---|---|---|---|---|---|---|---|---|---|
| Cundinamarca | 2.14 | 2.19 | 1.78 | 1.48 | 1.23 | 1.77 | 2.82 | 3.73 | 5.13 | 5.07 |
| Girardot | 16.41 | 13.94 | 11.51 | 10.13 | 10.12 | 9.99 | 9.84 | 9.38 | 8.92 | 8.82 |
| Nordeste | 0.55 | 0.65 | 0.75 | 1.09 | 1.48 | 1.60 | 3.73 | 3.55 | 3.51 | |
| Cúcuta | 0.26 | 1.07 | 1.53 | 1.70 | 1.71 | 1.63 | 1.55 | 1.53 | ||
| Pacífico | 52.98 | 50.78 | 45.70 | 41.83 | 41.01 | 39.38 | 38.77 | 38.28 | 39.70 | 40.11 |
| Caldas | 1.58 | 1.32 | 1.74 | 1.45 | 1.21 | 1.16 | 1.14 | 1.09 | 1.03 | 1.02 |
| Antioquia | 4.58 | 3.83 | 5.99 | 5.00 | 5.66 | 5.88 | 5.95 | 5.77 | 5.49 | 5.72 |
| Cartagena | 1.52 | 1.27 | 0.97 | 0.81 | 0.67 | 0.64 | 0.63 | 0.60 | 0.57 | 0.57 |
| Nariño | 0.07 | 0.56 | 1.24 | 2.01 | 2.46 | 2.82 | 2.92 | 2.78 | 2.65 | 2.62 |
| La Dorada | 2.37 | 1.98 | 1.51 | 1.26 | 1.04 | 1.00 | 0.99 | 0.94 | 0.89 | 0.88 |
| Norte sec. 1 | 6.39 | 9.51 | 12.15 | 13.22 | 11.65 | 11.18 | 11.01 | 10.49 | 9.98 | 9.87 |
| Norte sec. 2 | 1.16 | 2.97 | 4.86 | 5.55 | 5.46 | 5.21 | 4.95 | 4.90 | ||
| Tolima | 9.11 | 8.75 | 8.10 | 7.86 | 6.51 | 6.25 | 6.16 | 5.87 | 5.58 | 5.52 |
| Sur | 2.85 | 5.34 | 7.24 | 10.14 | 10.96 | 11.18 | 11.01 | 10.49 | 9.98 | 9.87 |
| Total | 100 | 100 | 100 | 100 | 100 | 100 | 100 | 100 | 100 | 100 |
With the Great Depression, foreign loans stagnated and the large inflow of capital for infrastructure ended. By 1933, most of the Latin American countries had incurred in debt moratorium. As argued by Avella (2003), the moratorium on foreign debt in Colombia was a lengthy process that lasted from 1931 to 1935. Payments of the national debt (installments and interest) were suspended in January 1935 and resumed in 1940, first under an interim agreement and later on permanently. An important benefit of the renegotiation was the reduction in the interest rate. For example, the interest rate on domestic loans in 1927 and 1928 was reduced from 6% to 3%.15
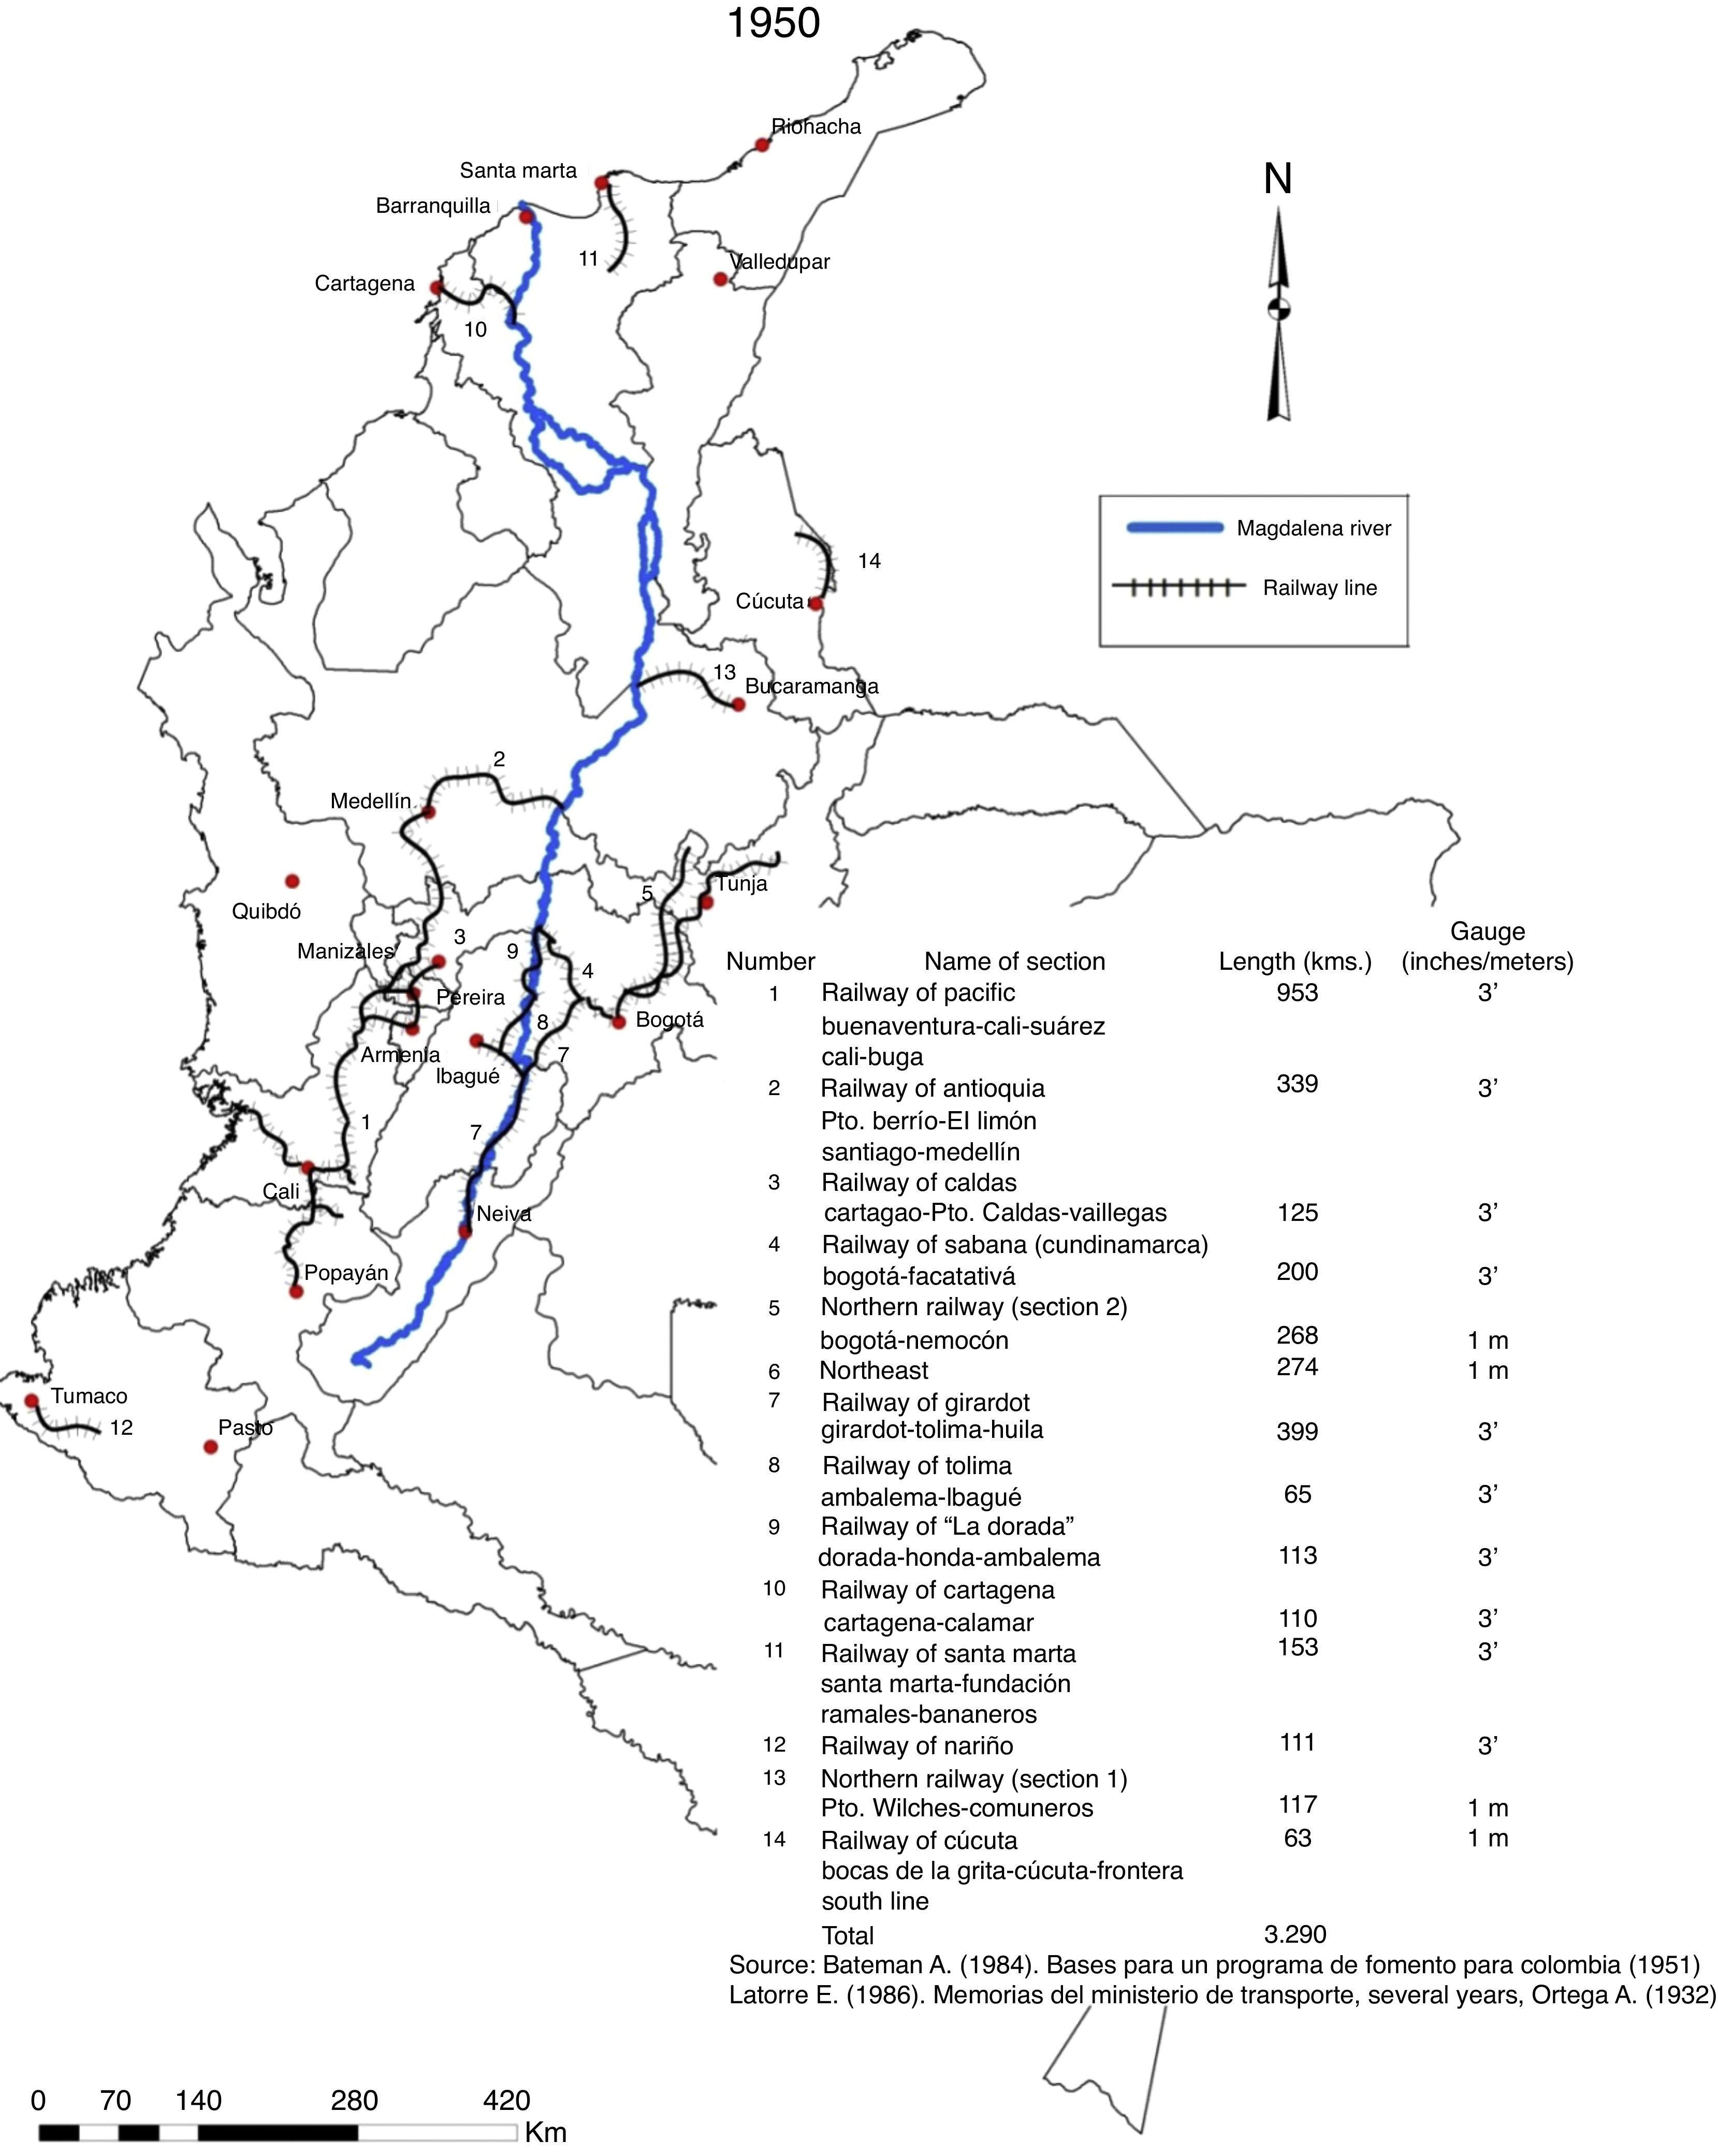
The international financial crisis not only halted foreign loans, but also the expansion of the railway system. It also had a highly negative effect on the amount of freight and passengers mobilized by the Colombian railways, which dropped by nearly 20% in 1930 (Appendix 2). In general, railway revenue began to decline in the early 1930s. The most affected were the so called coffee railroads: Antioquia, Pacifico, La Dorada, and Caldas (Fig. 3). Railroad development also was reduced considerably by the change in government policy in favor of highway developments.16 Less than 700km of railways were built between 1930 and 1950. After 1930, investments in infrastructure were allocated mostly to highway construction. In fact, public investment in highways in 1925 represented about 38% of total investment in land transportation, while in 1932 this investment represented almost 90% (Pachón-Muñoz and Ramírez-Giraldo, 2006).
.")
At the beginning of the forties, the reduction in international trade and the introduction of import restrictions caused by World War II led to fiscal constraints and low economic growth, which affected public investment in infrastructure.
Fig. 2 shows the railroad lines that had been constructed by 1950. The railroads were located in three main regions: the coffee region, the Bogota-Cundinamarca zone, and Valle del Cauca. Unlike early constructions, expansion in the twenties was intended to interconnect cities and their surrounding areas. However, by 1950, the country still lacked the transportation infrastructure required for its economic development, and the density of the railway and road network was still very low. In 1949, a World Bank Mission headed by the economist Lauchlin Currie arrived in Colombia to design a program to promote the country's development. With respect to the state of overland transportation, the Mission concluded: “…the various systems of transportation in Colombia are not currently able to meet, separately or together, in adequate conditions the growing needs of the country at a reasonable price” (BIRF, 1950, p. 119). The Mission singled out improvements in transportation infrastructure as a priority for Colombia in the immediate future.
Therefore, one of the questions that arise from this section is why after undertaking a major investment in railways, the country still had a very poor infrastructure by the end of the 1950s. One reason could be that investments in railways were unprofitable. The next section will examine this issue.
3Rates of return on Colombian railroads: 1924–1950In the 1920s and 1930s there were several influential people in Colombia who thought that a large part of the investment in railroads made in the twenties using foreign capital flows had been wasted.17 Moreover, authors such as Ortega (1932) and Barnhart (1956) argued that, after spending such large amounts of resources, the country still was isolated and disconnected. Mainly, they blamed this on lack of planning as well as inability to manage those resources, in most cases because of political pressures, but also due to a limited technical capacity to carry out the constructions.
Hartwig (1983), who claims that three-fourths of the investment in infrastructure was a total loss, offers an illustrative example.18 Based on Barnhart, Hartwig refers to a report by Vélez,19 who supposedly claimed that three-fourths of the total investment was lost. However, the Vélez report, published in the newspaper El Tiempo on August 14, 1930, makes no such assertion; it merely shows statistics on public investment in infrastructure in the 1920s. It is in an unsigned comment on the Vélez report entitled “Cómo se evaporan los millones” (“How Millions Evaporate”), published in the same newspaper the day before the report appeared, where wild estimates were made concerning the amount of resources wasted. However, the highest estimate of losses comes to 100 million pesos out of a total 213 million invested, which is 47% and not 75%, as Barnhart argues that Vélez had estimated. This sort of careless use of information has contributed in the past to the sense of failure concerning the enormous effort made in the 1920s to improve Colombia's transportation network.
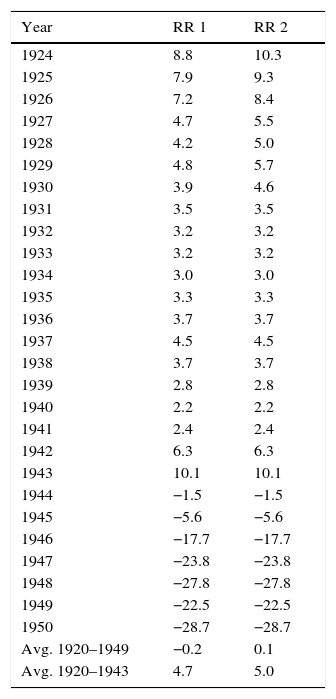
In this section, we estimate the yearly rates of return (RR) during 1924–1950 on railroads built or extended in the 1920s. The main objective is to determine if the investments in railways during the 1920s were profitable. One of the main contributions of this paper is the calculation of the annual rates of return by railroad lines, and for both freight and passenger transportation. Our calculations also consider the fact that, as a result of the Great Depression and the suspension of payments on foreign debt, Colombia ended up paying only a portion of the loans obtained in the 1920s. To make these calculations, we use a detailed data set of yearly investment, income, expenditures, number of passengers, tons of freight, and railroad tracks for fourteen Colombian railroads during the period under analysis (Appendices 1 and 3–6).
The rates of return were measured as the ratio of net earnings (income minus expenditure) to cumulative investment for every year. This measure has the advantage that it offers profit figures on an annual basis. In particular, we propose two scenarios. In the first one (RR1), we assume no major investments in railroads were made after 1933, and the investment depreciates at an annual rate of 5% after 1933. In the second scenario (RR2), since railroad investments were financed with foreign loans and because of the debt moratorium, we subtract the percentage of foreign loans that were never paid. Colombia stopped servicing its foreign debt because of several decisions made in the period from 1931 to 1935 (Avella, 2007). In the 1940s, it was renegotiated, and, as a result, the country benefited from a substantial reduction in its outstanding debt and in the rate of interest it ultimately paid when repayment was resumed. Jorgensen and Sachs (1989) estimate that, at present net values, Colombia ended up paying 15% less of the foreign debt it had acquired in the 1920s.20 For this reason, to calculate rates of return on railroad investment, we reduce the investment in railroads by 15% annually during 1924–1930, and also assume that investment depreciated at an annual rate of 5% after 1933.
Table 4 shows the rates of return during 1924–1950, as calculated for both scenarios. A comparison of the two suggests the rates of return are slightly higher when the debt moratorium is considered in the calculation. In general, railroads were clearly profitable, although with a decreasing trend, during the period of 1924–1943, with higher return rates during the twenties. In this period, the alternative modes to railroad transportation were still mules and animal-drawn carts, so railroads were a good alternative to these early and precarious modes of transportation. During the 1920s, the growth rates of freight and passenger movements by railroads were much higher than those in the thirties and subsequent years (Appendix 2).
Colombian railroads: rate of return of investment (RR)a (percentage).
| Year | RR 1 | RR 2 |
|---|---|---|
| 1924 | 8.8 | 10.3 |
| 1925 | 7.9 | 9.3 |
| 1926 | 7.2 | 8.4 |
| 1927 | 4.7 | 5.5 |
| 1928 | 4.2 | 5.0 |
| 1929 | 4.8 | 5.7 |
| 1930 | 3.9 | 4.6 |
| 1931 | 3.5 | 3.5 |
| 1932 | 3.2 | 3.2 |
| 1933 | 3.2 | 3.2 |
| 1934 | 3.0 | 3.0 |
| 1935 | 3.3 | 3.3 |
| 1936 | 3.7 | 3.7 |
| 1937 | 4.5 | 4.5 |
| 1938 | 3.7 | 3.7 |
| 1939 | 2.8 | 2.8 |
| 1940 | 2.2 | 2.2 |
| 1941 | 2.4 | 2.4 |
| 1942 | 6.3 | 6.3 |
| 1943 | 10.1 | 10.1 |
| 1944 | −1.5 | −1.5 |
| 1945 | −5.6 | −5.6 |
| 1946 | −17.7 | −17.7 |
| 1947 | −23.8 | −23.8 |
| 1948 | −27.8 | −27.8 |
| 1949 | −22.5 | −22.5 |
| 1950 | −28.7 | −28.7 |
| Avg. 1920–1949 | −0.2 | 0.1 |
| Avg. 1920–1943 | 4.7 | 5.0 |
Note: RR=(Income−Expenditure)/Cumulative Investment.
Includes the following railways: Cundinamarca, Girardot, Pacifico, Caldas, Antioquia, Nordeste, Cúcuta, Cartagena, Nariño, La Dorada, Norte sec. 1, Norte sec. 2, Sur, and Tolima. RR1: It is assumed there was no investment after 1933 and the investment depreciates at a rate of 5% annually after 1933. RR2: It is assumed the investment depreciates at a rate of 5% annually after 1933. Additionally, since railroad investment was financed with foreign loans and because of the debt moratorium in 1930, we reduce the investment in railroads by 15% for each year during 1920–1930, inasmuch as only 85% of the debt was eventually repaid.
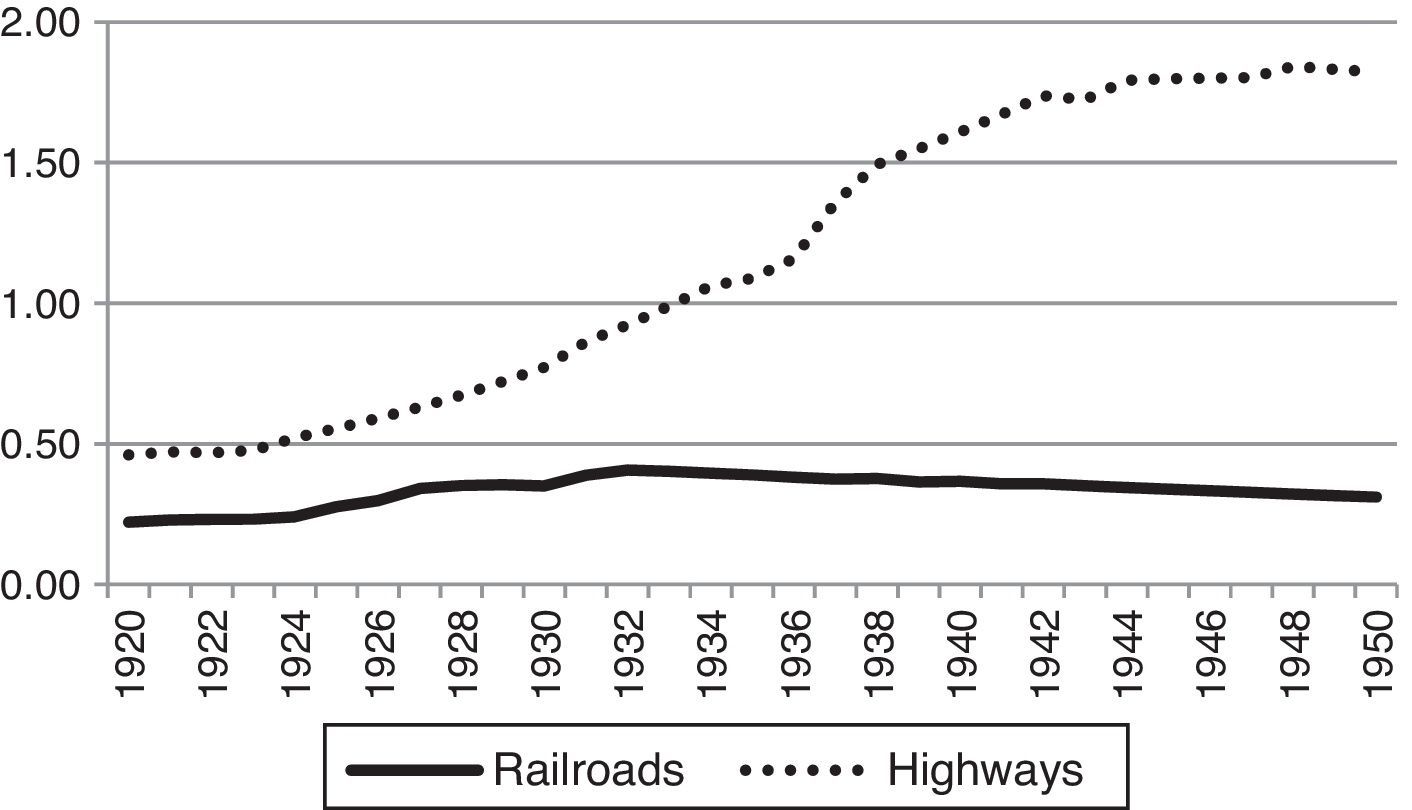
After 1943, most of the railroads presented losses. Their rates of return are consistently negative; mainly because they had to deal with competition from parallel roads and the negative effects of World War II on the Colombian economy. As mentioned, infrastructure policy shifted to a focus on highway construction as of the early 1930s; this is where the major investments were made. Many new roads were built parallel to the railways and successfully competed with them for freight and passenger traffic, since highway transportation was faster, more flexible, and more profitable, in part because they were privately operated. Fig. 4 shows the evolution in the length of highways and railways in per capita terms.
, 1920–1950.")
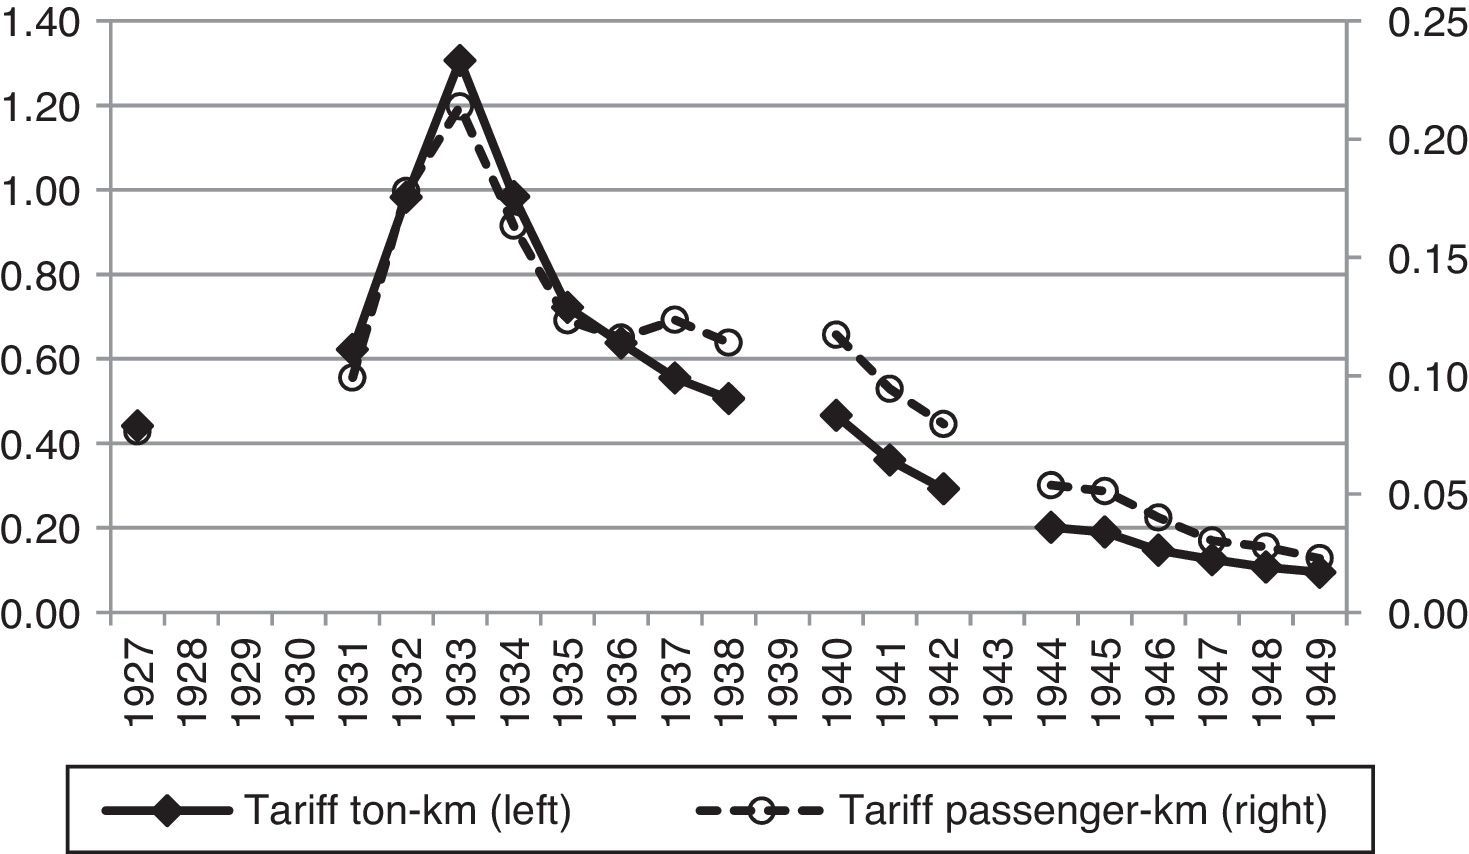
In addition, all the railroads saw their revenue drop as of the late thirties due to an important reduction in freight and passenger rates brought on by the government's regulation of railway fares (Fig. 5).21 Because revenues came mainly from freight and passenger fares, railroads net operating revenues were often insufficient to cover all expenditure. Railroad rate reductions were the primary cause for net losses of railroad revenues; consequently, many railroads went bankrupt.
.")
Average railroad freight rates and passenger fares (pesos of 1950).
As shown by Ramírez-Giraldo (2001), one of the problems was that the government's policy of reducing rates did not attract substantial increments in the volume of freight and passengers. Therefore, railroads operated in the inelastic proportion of their demand curves, since the demand for freight and passenger transportation was inelastic to changes in rates.
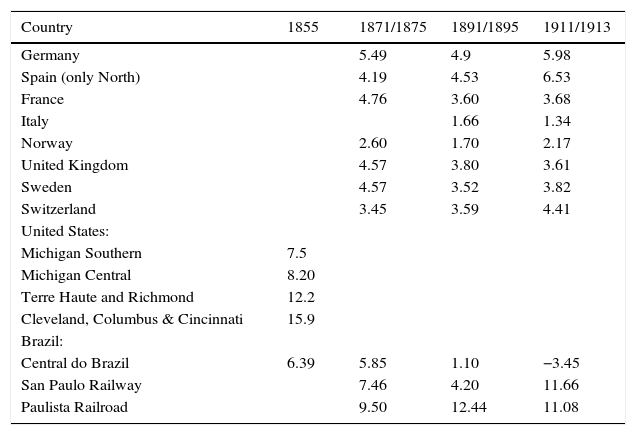
It might be interesting to compare the rates of return of Colombian railways with those of other countries. However, international comparisons may be difficult to make since the methodologies, definitions, and the years of calculations may differ from one country to another. Additionally, Colombian railways were built relatively late compared to other Latin American countries and European railways. Despite this, the data suggests that Colombian railroads in the 1920s were, in general, as profitable as most European, American, and Brazilian railroads in the nineteenth century and at the beginning of the twentieth century (Table 5).
Rate of return of selected countries and years (percentage).
| Country | 1855 | 1871/1875 | 1891/1895 | 1911/1913 |
|---|---|---|---|---|
| Germany | 5.49 | 4.9 | 5.98 | |
| Spain (only North) | 4.19 | 4.53 | 6.53 | |
| France | 4.76 | 3.60 | 3.68 | |
| Italy | 1.66 | 1.34 | ||
| Norway | 2.60 | 1.70 | 2.17 | |
| United Kingdom | 4.57 | 3.80 | 3.61 | |
| Sweden | 4.57 | 3.52 | 3.82 | |
| Switzerland | 3.45 | 3.59 | 4.41 | |
| United States: | ||||
| Michigan Southern | 7.5 | |||
| Michigan Central | 8.20 | |||
| Terre Haute and Richmond | 12.2 | |||
| Cleveland, Columbus & Cincinnati | 15.9 | |||
| Brazil: | ||||
| Central do Brazil | 6.39 | 5.85 | 1.10 | −3.45 |
| San Paulo Railway | 7.46 | 4.20 | 11.66 | |
| Paulista Railroad | 9.50 | 12.44 | 11.08 |
Additionally, in order to infer how profitable Colombian railways were, would be important to compare their rates of return with an investment alternative. Although it is hard to find an appropriate one, an alternative could be to compare the rates of return to the opportunity cost of capital. For example, by comparing the rates of return on Colombian railways to U.S. commercial paper rates in New York City, we can infer that the investments in Colombian railroads were as profitable as these commercial papers, at least up to 1940. The average rate of U.S. commercial papers in New York City was 3.2% between 1920 and 1940, and 2.5%, between 1920 and 1950.22
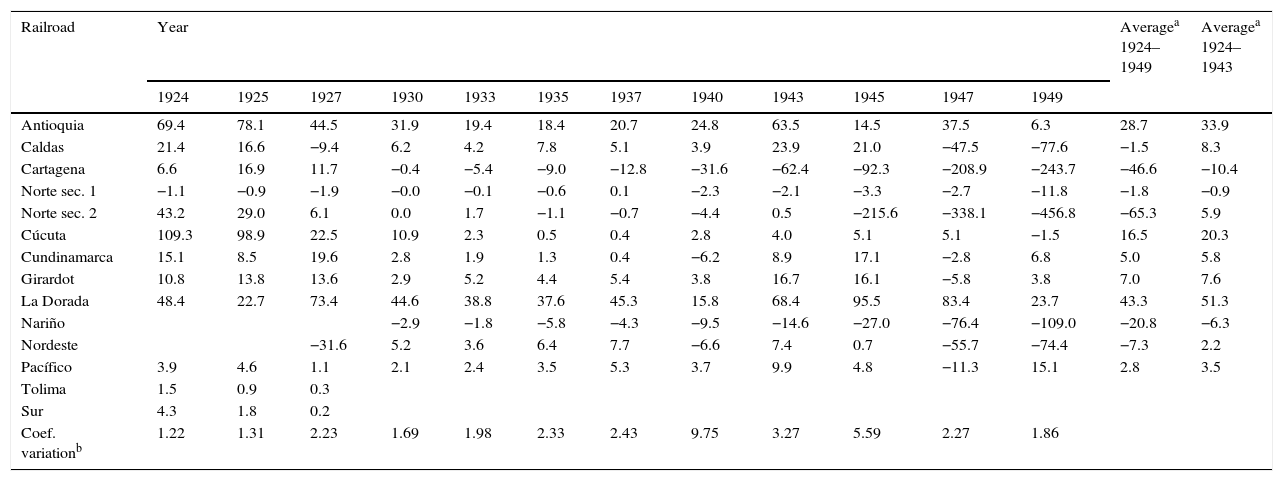
In order to analyze individual railroad performance to determine if there were important differences in profitability among railroad lines, we also estimate the rates of return for each Colombian railway for which we have complete information on output, expenditure, and investment. Railroad lines showed mixed results in terms of profitability (Table 6). Furthermore, the coefficient of variation indicates a significant dispersion of the rate of return among railroads lines which increased after 1940, when the highest dispersion was observed. That year an important reduction in freight and passengers, as well as in railroads earnings, was observed (Fig. 3 and Appendix 2). Some railroads, such as the Cartagena railway, which presented the lowest rate of return, were nationalized.
Colombian railroads: rate of return (RR), 1924–1949 (percentage).
| Railroad | Year | Averagea 1924–1949 | Averagea 1924–1943 | |||||||||||
|---|---|---|---|---|---|---|---|---|---|---|---|---|---|---|
| 1924 | 1925 | 1927 | 1930 | 1933 | 1935 | 1937 | 1940 | 1943 | 1945 | 1947 | 1949 | |||
| Antioquia | 69.4 | 78.1 | 44.5 | 31.9 | 19.4 | 18.4 | 20.7 | 24.8 | 63.5 | 14.5 | 37.5 | 6.3 | 28.7 | 33.9 |
| Caldas | 21.4 | 16.6 | −9.4 | 6.2 | 4.2 | 7.8 | 5.1 | 3.9 | 23.9 | 21.0 | −47.5 | −77.6 | −1.5 | 8.3 |
| Cartagena | 6.6 | 16.9 | 11.7 | −0.4 | −5.4 | −9.0 | −12.8 | −31.6 | −62.4 | −92.3 | −208.9 | −243.7 | −46.6 | −10.4 |
| Norte sec. 1 | −1.1 | −0.9 | −1.9 | −0.0 | −0.1 | −0.6 | 0.1 | −2.3 | −2.1 | −3.3 | −2.7 | −11.8 | −1.8 | −0.9 |
| Norte sec. 2 | 43.2 | 29.0 | 6.1 | 0.0 | 1.7 | −1.1 | −0.7 | −4.4 | 0.5 | −215.6 | −338.1 | −456.8 | −65.3 | 5.9 |
| Cúcuta | 109.3 | 98.9 | 22.5 | 10.9 | 2.3 | 0.5 | 0.4 | 2.8 | 4.0 | 5.1 | 5.1 | −1.5 | 16.5 | 20.3 |
| Cundinamarca | 15.1 | 8.5 | 19.6 | 2.8 | 1.9 | 1.3 | 0.4 | −6.2 | 8.9 | 17.1 | −2.8 | 6.8 | 5.0 | 5.8 |
| Girardot | 10.8 | 13.8 | 13.6 | 2.9 | 5.2 | 4.4 | 5.4 | 3.8 | 16.7 | 16.1 | −5.8 | 3.8 | 7.0 | 7.6 |
| La Dorada | 48.4 | 22.7 | 73.4 | 44.6 | 38.8 | 37.6 | 45.3 | 15.8 | 68.4 | 95.5 | 83.4 | 23.7 | 43.3 | 51.3 |
| Nariño | −2.9 | −1.8 | −5.8 | −4.3 | −9.5 | −14.6 | −27.0 | −76.4 | −109.0 | −20.8 | −6.3 | |||
| Nordeste | −31.6 | 5.2 | 3.6 | 6.4 | 7.7 | −6.6 | 7.4 | 0.7 | −55.7 | −74.4 | −7.3 | 2.2 | ||
| Pacífico | 3.9 | 4.6 | 1.1 | 2.1 | 2.4 | 3.5 | 5.3 | 3.7 | 9.9 | 4.8 | −11.3 | 15.1 | 2.8 | 3.5 |
| Tolima | 1.5 | 0.9 | 0.3 | |||||||||||
| Sur | 4.3 | 1.8 | 0.2 | |||||||||||
| Coef. variationb | 1.22 | 1.31 | 2.23 | 1.69 | 1.98 | 2.33 | 2.43 | 9.75 | 3.27 | 5.59 | 2.27 | 1.86 | ||
Note:
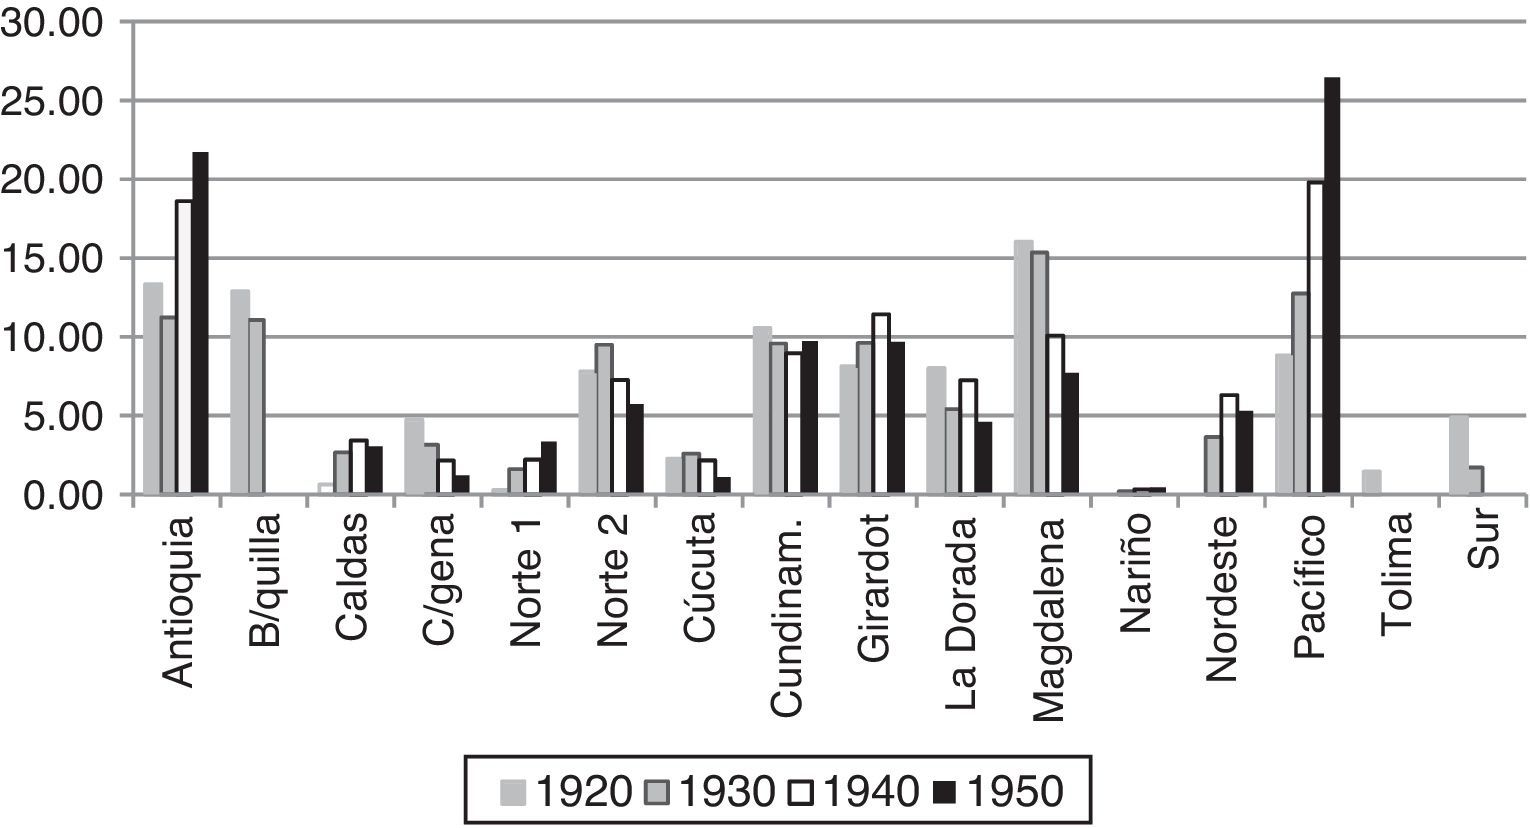
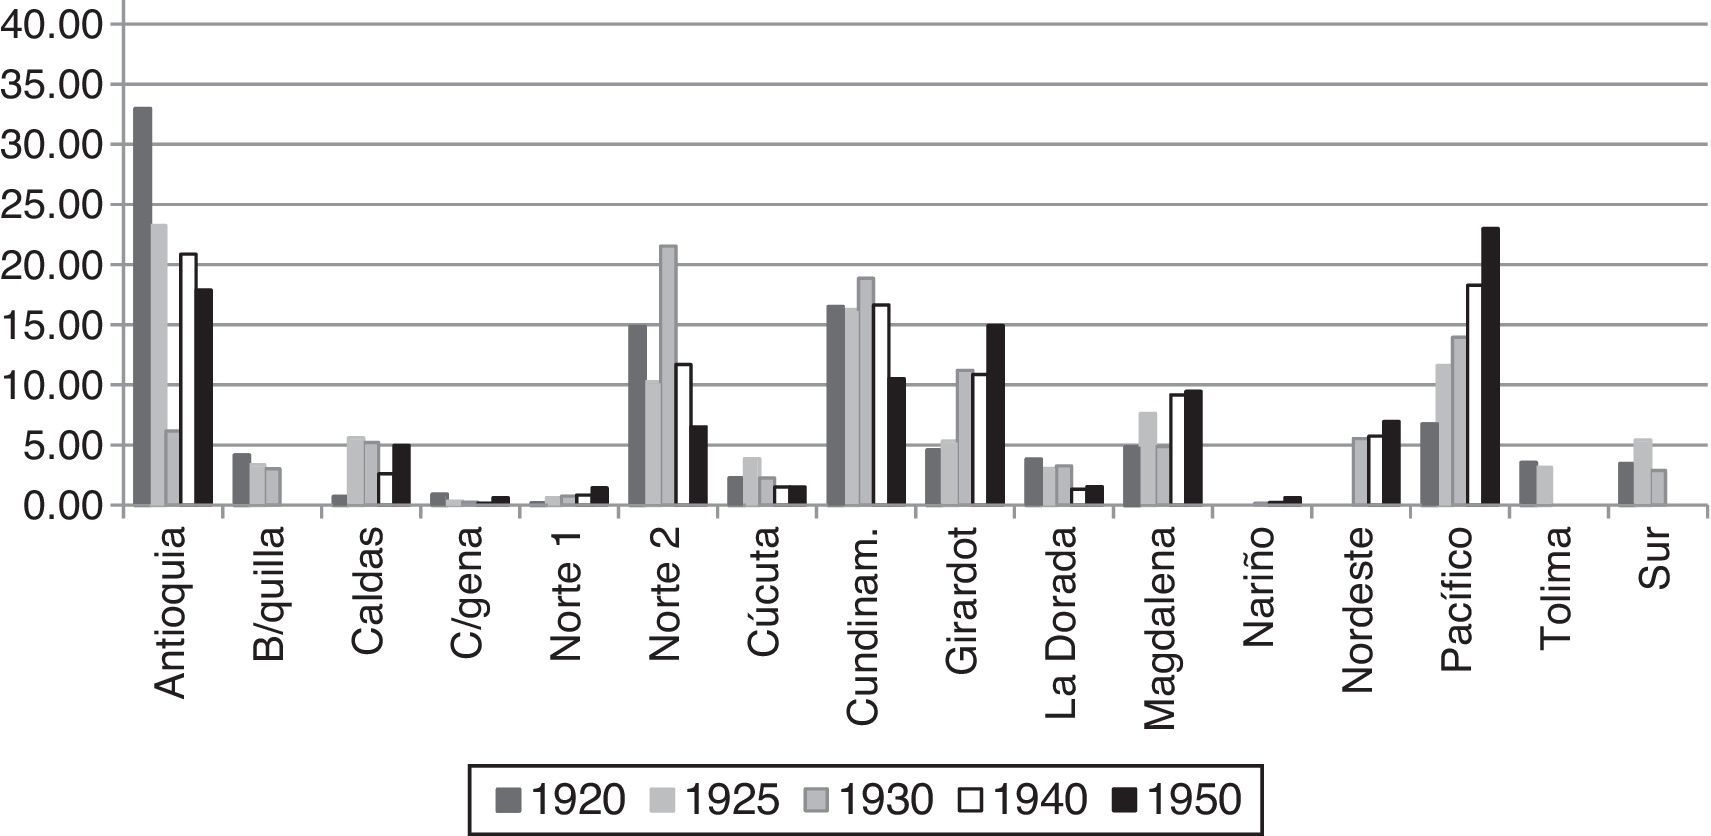
In particular, the calculations indicate that the most profitable railroads were Antioquia, Cúcuta, Cundinamarca, Girardot, La Dorada, and Pacífico; these railroads transported coffee, which was the compensated freight that guaranteed economic feasibility of these railways, at least during their first years of operation.23 Specifically, the Antioquia, Pacífico and Girardot railroads received the largest share of investment during the twenties (Tables 3a and 3b) and were the railroads which carried the highest volumes of freight and passengers (Figs. 6 and 7). Consequently, these railroads obtained the highest revenues (Fig. 3) and were the most profitable ones.
.")
Colombian railroad: freight 1920–1950 (share of each railroad in total freight, %).
.")
Colombia railroad: passengers 1920–1950 (share of each railroad line, %).
The case of the Pacifico Railroad is very interesting. Its construction was very important, as it would communicate the coffee-producing areas with the sea port of Buenaventura on the Pacific, and would therefore encourage coffee exports. However, its construction faced many problems since its inception in 1872. In fact, between 1872 and 1919, when the railroad finally came to be owned by the Nation, seven concessions participated in its construction. All of them failed because of the lack of well-defined contract terms. Consequently, its construction was virtually stagnant for about 50 years. As a result, during the twenties and early thirties, the Colombian government decided to allocate significant resources from the US compensation for Panama and other external resources to finish the construction of this railroad. Thus, it was an explicit political decision, rather than a technical one, which finally led to its conclusion.
Investment in that railroad was relatively profitable. The railroad mostly presented positive rates of return; however, these were generally lower than those of other coffee railways. This result is not surprising, given the large amount of resources invested in its construction, which lasted many years, and was not reflected in substantial increases in freight or passengers to offset those large investments. In addition, this larger investment was not reflected in significant income increases because their rates were lower than the average of the railways. Only until 1949 was the profitability of the Pacific railroad higher than that of other coffee railways, when it was able to consolidate the market for freight and passengers.
In contrast, railroads such as Nariño, Norte sec. 1 and sec. 2, and Nordeste were not profitable (Table 6). For instance, the rates of return on Norte sec. 2 and the Nordeste railroads fell dramatically, since these lines had to compete with the Carretera Central del Norte, which was completed in 1934. In addition, the share of these railroads in the movement of freight (mainly mineral products. See Appendix 6), and passengers was, in general, very low, and their revenues were among the lowest (Fig. 3). In the case of Nariño railroad, this was an isolated and remote line, which was disconnected from the transportation network, and its share in freight and passenger movements was very small.
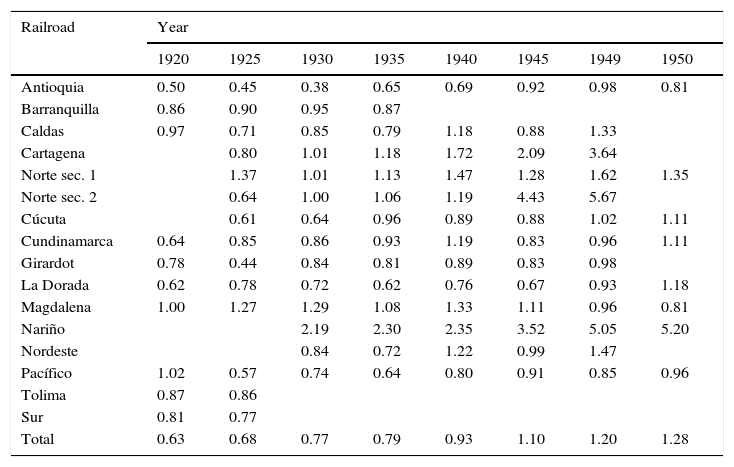
In general, the coefficient of exploitation of Colombian railroads was below one until the late thirties. However, most railroads ceased to be profitable as of the early forties, when their expenditures often exceeded their income (Table 7). As a result, most of the railways went bankrupt. Consequently, in the fifties, the central government had to intervene in the railway system, nationalizing most lines.
Colombian railroads: coefficient of exploitation, 1920–1950 (ratio between expenditure and income).
| Railroad | Year | |||||||
|---|---|---|---|---|---|---|---|---|
| 1920 | 1925 | 1930 | 1935 | 1940 | 1945 | 1949 | 1950 | |
| Antioquia | 0.50 | 0.45 | 0.38 | 0.65 | 0.69 | 0.92 | 0.98 | 0.81 |
| Barranquilla | 0.86 | 0.90 | 0.95 | 0.87 | ||||
| Caldas | 0.97 | 0.71 | 0.85 | 0.79 | 1.18 | 0.88 | 1.33 | |
| Cartagena | 0.80 | 1.01 | 1.18 | 1.72 | 2.09 | 3.64 | ||
| Norte sec. 1 | 1.37 | 1.01 | 1.13 | 1.47 | 1.28 | 1.62 | 1.35 | |
| Norte sec. 2 | 0.64 | 1.00 | 1.06 | 1.19 | 4.43 | 5.67 | ||
| Cúcuta | 0.61 | 0.64 | 0.96 | 0.89 | 0.88 | 1.02 | 1.11 | |
| Cundinamarca | 0.64 | 0.85 | 0.86 | 0.93 | 1.19 | 0.83 | 0.96 | 1.11 |
| Girardot | 0.78 | 0.44 | 0.84 | 0.81 | 0.89 | 0.83 | 0.98 | |
| La Dorada | 0.62 | 0.78 | 0.72 | 0.62 | 0.76 | 0.67 | 0.93 | 1.18 |
| Magdalena | 1.00 | 1.27 | 1.29 | 1.08 | 1.33 | 1.11 | 0.96 | 0.81 |
| Nariño | 2.19 | 2.30 | 2.35 | 3.52 | 5.05 | 5.20 | ||
| Nordeste | 0.84 | 0.72 | 1.22 | 0.99 | 1.47 | |||
| Pacífico | 1.02 | 0.57 | 0.74 | 0.64 | 0.80 | 0.91 | 0.85 | 0.96 |
| Tolima | 0.87 | 0.86 | ||||||
| Sur | 0.81 | 0.77 | ||||||
| Total | 0.63 | 0.68 | 0.77 | 0.79 | 0.93 | 1.10 | 1.20 | 1.28 |
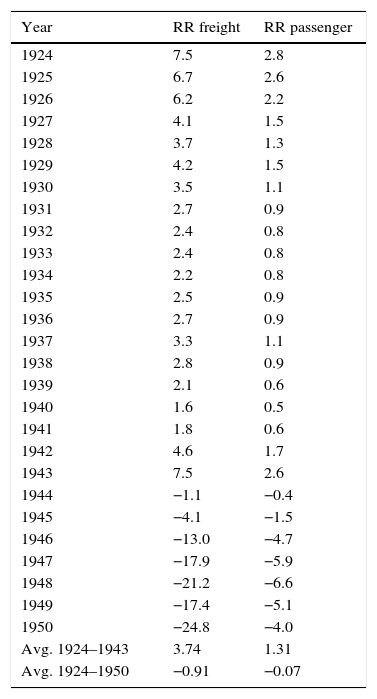
We also estimated the rates of return on both passenger and freight transportation.24 As shown in Table 8, shipping freight was far more profitable than passenger transportation until 1943 because the railroads were generally dedicated to cargo, and freight rates were considerably higher than passenger fares (Appendix 5). However, as of 1944, the magnitude of the decline in the rate of return on freight was much larger than that of the passenger rate, since the drop in freight rates was more pronounced (Fig. 5).
Rate of return (RR) on freight and passengers: Colombian railroads: 1924–1950 (percentage).
| Year | RR freight | RR passenger |
|---|---|---|
| 1924 | 7.5 | 2.8 |
| 1925 | 6.7 | 2.6 |
| 1926 | 6.2 | 2.2 |
| 1927 | 4.1 | 1.5 |
| 1928 | 3.7 | 1.3 |
| 1929 | 4.2 | 1.5 |
| 1930 | 3.5 | 1.1 |
| 1931 | 2.7 | 0.9 |
| 1932 | 2.4 | 0.8 |
| 1933 | 2.4 | 0.8 |
| 1934 | 2.2 | 0.8 |
| 1935 | 2.5 | 0.9 |
| 1936 | 2.7 | 0.9 |
| 1937 | 3.3 | 1.1 |
| 1938 | 2.8 | 0.9 |
| 1939 | 2.1 | 0.6 |
| 1940 | 1.6 | 0.5 |
| 1941 | 1.8 | 0.6 |
| 1942 | 4.6 | 1.7 |
| 1943 | 7.5 | 2.6 |
| 1944 | −1.1 | −0.4 |
| 1945 | −4.1 | −1.5 |
| 1946 | −13.0 | −4.7 |
| 1947 | −17.9 | −5.9 |
| 1948 | −21.2 | −6.6 |
| 1949 | −17.4 | −5.1 |
| 1950 | −24.8 | −4.0 |
| Avg. 1924–1943 | 3.74 | 1.31 |
| Avg. 1924–1950 | −0.91 | −0.07 |
Note: It is assumed investment depreciates at a rate of 5% annually after 1933. Additionally, since railroad investment was financed with foreign loans and because of the debt moratorium in 1930, we reduce the investment in railroads by 15%, as only 85% of the debt was repaid. The estimation includes the following railroads: Cundinamarca, Girardot, Pacifico, Caldas, Antioquia, Nordeste, Cúcuta, and Cartagena.
Finally, we calculated the internal rate of return (IRR) for the period 1914–1943 as another measure of railroad profitability. The IRR is the level of profitability for which the present value of the railroad is zero. We selected this period so as to take into account all previous investments made in certain railroads, such as the Antioquia, Cartagena, and Girardot lines. After 1943, almost all the railroads registered negative net income.
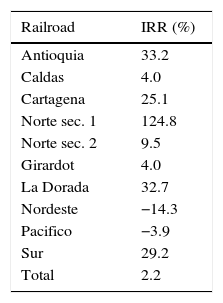
Table 9 shows the estimated internal rate of return (IRR) on the individual railways for which we have comprehensive information. In general, investments in railroads were profitable, especially for the so-called coffee railroads, where large investments had already been made before the twenties.
Internal rate of return (IRR) on selected railroads: 1914–1943 (percentage).
| Railroad | IRR (%) |
|---|---|
| Antioquia | 33.2 |
| Caldas | 4.0 |
| Cartagena | 25.1 |
| Norte sec. 1 | 124.8 |
| Norte sec. 2 | 9.5 |
| Girardot | 4.0 |
| La Dorada | 32.7 |
| Nordeste | −14.3 |
| Pacifico | −3.9 |
| Sur | 29.2 |
| Total | 2.2 |
Note: It is assumed the investment depreciates at a rate of 5% annually after 1933. Additionally, since railroad investment was financed with foreign loans and because of the debt moratorium in 1930, we reduce the investment in railroads by 15%, as only 85% of the debt was repaid.
In this paper, we show that the large investment in railroads in Colombia during the twenties was profitable. This contrasts with the many criticisms voiced in the late 1920s and early 1930s by leading Colombian politicians, journalists, and even engineers concerning the efficiency with which the resources from foreign loans and the Panama compensation were invested in transport infrastructure during the 1920s. In the case of the railroads, which accounted for 45% of those investments, the rates of return were positive until 1943. Thus, the problem was not to have built the railways, but perhaps to have kept them in operation after 1943, when many lines ceased to be profitable. These results cast a shadow of doubt on the extent of the resources that were wasted, stolen, or poorly managed during the construction of railroads in the 1920s. If some of the more exaggerated claims had been correct – for example, that only one-fourth of the resources were actually invested – then Colombian railroads in that period would have been among the most profitable in the world. Accordingly, it is clear that those claims of extremely wasteful investments are exaggerated. Despite this, the density of railroads was very low by 1950, and most of the railways went bankrupt. Railroads in Colombia did not contribute significantly to the country's economic growth. In fact, at the beginning of the fifties the country did not count with the necessary infrastructure for its economic development.
SourcesNewspapersEl Tiempo 1930. Las sumas invertidas en ferrocarriles y cables de 1923 a 1929. August 14, number 6776, pp. 8, 12.
Vélez, E., 1930. La danza de los millones in El Tiempo, August 14, number 6776, pp. 4.
DatabasesBase de Datos de Historia Económica de América Latina Montevideo-Oxford, http://moxlad.fcs.edu.uy/es/basededatos.html (accessed 20.07.13).
We are grateful for the comments and suggestions made by Haroldo Calvo, Xavier Duran, Enrique Lopez, Miguel Urrutia, the participants at the First World Business History Conference, Goethe-Universität (Frankfurt Main, March 17, 2014), and by the five anonymous reviewers. We also want to thank Lizeth Molina, Viviana Rey, and Yuri Reina for their research assistance.
: 1885–1950 (*). *Total Railroad Tracks=National plus departmental, municipal, and private railroads.")
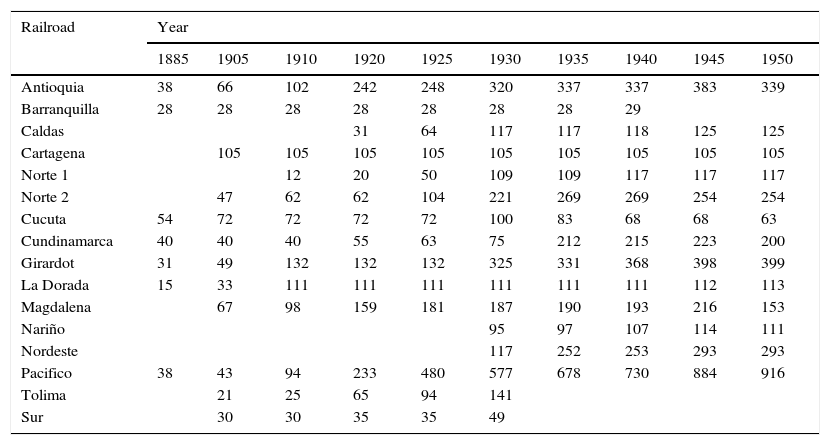
Colombian railroads: kilometers of tracks 1885–1950.
| Railroad | Year | |||||||||
|---|---|---|---|---|---|---|---|---|---|---|
| 1885 | 1905 | 1910 | 1920 | 1925 | 1930 | 1935 | 1940 | 1945 | 1950 | |
| Antioquia | 38 | 66 | 102 | 242 | 248 | 320 | 337 | 337 | 383 | 339 |
| Barranquilla | 28 | 28 | 28 | 28 | 28 | 28 | 28 | 29 | ||
| Caldas | 31 | 64 | 117 | 117 | 118 | 125 | 125 | |||
| Cartagena | 105 | 105 | 105 | 105 | 105 | 105 | 105 | 105 | 105 | |
| Norte 1 | 12 | 20 | 50 | 109 | 109 | 117 | 117 | 117 | ||
| Norte 2 | 47 | 62 | 62 | 104 | 221 | 269 | 269 | 254 | 254 | |
| Cucuta | 54 | 72 | 72 | 72 | 72 | 100 | 83 | 68 | 68 | 63 |
| Cundinamarca | 40 | 40 | 40 | 55 | 63 | 75 | 212 | 215 | 223 | 200 |
| Girardot | 31 | 49 | 132 | 132 | 132 | 325 | 331 | 368 | 398 | 399 |
| La Dorada | 15 | 33 | 111 | 111 | 111 | 111 | 111 | 111 | 112 | 113 |
| Magdalena | 67 | 98 | 159 | 181 | 187 | 190 | 193 | 216 | 153 | |
| Nariño | 95 | 97 | 107 | 114 | 111 | |||||
| Nordeste | 117 | 252 | 253 | 293 | 293 | |||||
| Pacifico | 38 | 43 | 94 | 233 | 480 | 577 | 678 | 730 | 884 | 916 |
| Tolima | 21 | 25 | 65 | 94 | 141 | |||||
| Sur | 30 | 30 | 35 | 35 | 49 | |||||

Colombian railroads: tons of freight: 1916–1950. Note: Corresponds to the sum of freight transported by the following railroads: Antioquia, Barranquilla, Caldas, Cartagena, Norte sec. 1 and sec. 2, Cucuta, Cundinamarca, Girardot, La Dorada, Magdalena, Nariño, Nordeste, Pacifico, Tolima, and Sur.

Colombian railroads: number of passengers: 1916–1950. Note: Corresponds to the sum of passengers transported by the following railroads: Antioquia, Barranquilla, Caldas, Cartagena, Norte sec. 1 and sec. 2, Cucuta, Cundinamarca, Girardot, La Dorada, Magdalena, Nariño, Nordeste, Pacifico, Tolima, and Sur.
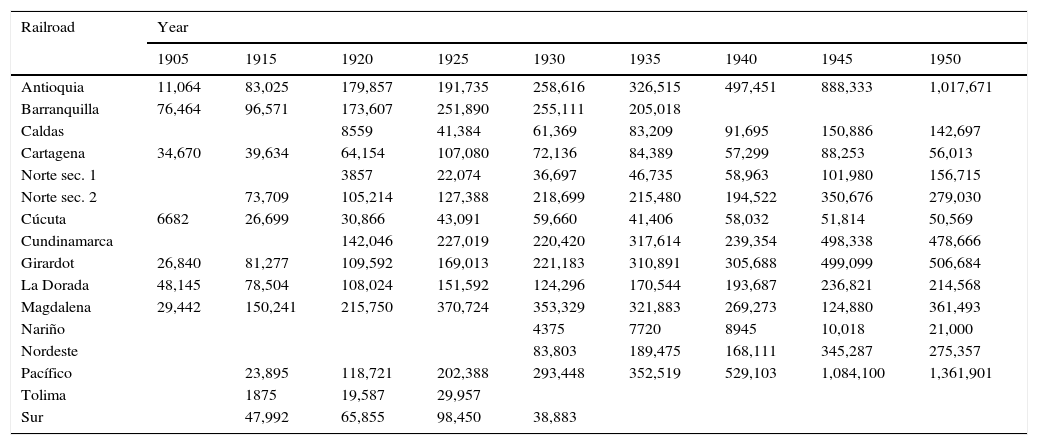
Colombian railroads: transported freight (tons), 1905–1950.
| Railroad | Year | ||||||||
|---|---|---|---|---|---|---|---|---|---|
| 1905 | 1915 | 1920 | 1925 | 1930 | 1935 | 1940 | 1945 | 1950 | |
| Antioquia | 11,064 | 83,025 | 179,857 | 191,735 | 258,616 | 326,515 | 497,451 | 888,333 | 1,017,671 |
| Barranquilla | 76,464 | 96,571 | 173,607 | 251,890 | 255,111 | 205,018 | |||
| Caldas | 8559 | 41,384 | 61,369 | 83,209 | 91,695 | 150,886 | 142,697 | ||
| Cartagena | 34,670 | 39,634 | 64,154 | 107,080 | 72,136 | 84,389 | 57,299 | 88,253 | 56,013 |
| Norte sec. 1 | 3857 | 22,074 | 36,697 | 46,735 | 58,963 | 101,980 | 156,715 | ||
| Norte sec. 2 | 73,709 | 105,214 | 127,388 | 218,699 | 215,480 | 194,522 | 350,676 | 279,030 | |
| Cúcuta | 6682 | 26,699 | 30,866 | 43,091 | 59,660 | 41,406 | 58,032 | 51,814 | 50,569 |
| Cundinamarca | 142,046 | 227,019 | 220,420 | 317,614 | 239,354 | 498,338 | 478,666 | ||
| Girardot | 26,840 | 81,277 | 109,592 | 169,013 | 221,183 | 310,891 | 305,688 | 499,099 | 506,684 |
| La Dorada | 48,145 | 78,504 | 108,024 | 151,592 | 124,296 | 170,544 | 193,687 | 236,821 | 214,568 |
| Magdalena | 29,442 | 150,241 | 215,750 | 370,724 | 353,329 | 321,883 | 269,273 | 124,880 | 361,493 |
| Nariño | 4375 | 7720 | 8945 | 10,018 | 21,000 | ||||
| Nordeste | 83,803 | 189,475 | 168,111 | 345,287 | 275,357 | ||||
| Pacífico | 23,895 | 118,721 | 202,388 | 293,448 | 352,519 | 529,103 | 1,084,100 | 1,361,901 | |
| Tolima | 1875 | 19,587 | 29,957 | ||||||
| Sur | 47,992 | 65,855 | 98,450 | 38,883 | |||||
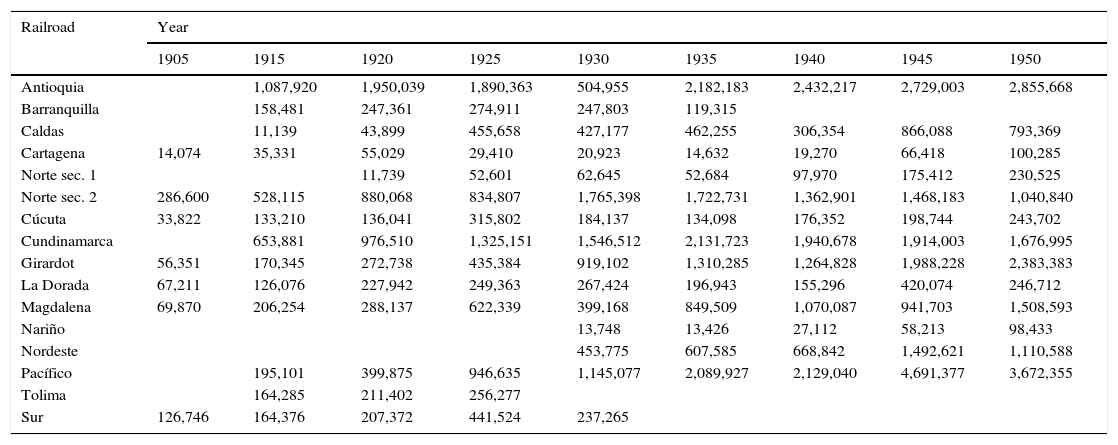
Colombian railroads: number of passengers, 1905–1950.
| Railroad | Year | ||||||||
|---|---|---|---|---|---|---|---|---|---|
| 1905 | 1915 | 1920 | 1925 | 1930 | 1935 | 1940 | 1945 | 1950 | |
| Antioquia | 1,087,920 | 1,950,039 | 1,890,363 | 504,955 | 2,182,183 | 2,432,217 | 2,729,003 | 2,855,668 | |
| Barranquilla | 158,481 | 247,361 | 274,911 | 247,803 | 119,315 | ||||
| Caldas | 11,139 | 43,899 | 455,658 | 427,177 | 462,255 | 306,354 | 866,088 | 793,369 | |
| Cartagena | 14,074 | 35,331 | 55,029 | 29,410 | 20,923 | 14,632 | 19,270 | 66,418 | 100,285 |
| Norte sec. 1 | 11,739 | 52,601 | 62,645 | 52,684 | 97,970 | 175,412 | 230,525 | ||
| Norte sec. 2 | 286,600 | 528,115 | 880,068 | 834,807 | 1,765,398 | 1,722,731 | 1,362,901 | 1,468,183 | 1,040,840 |
| Cúcuta | 33,822 | 133,210 | 136,041 | 315,802 | 184,137 | 134,098 | 176,352 | 198,744 | 243,702 |
| Cundinamarca | 653,881 | 976,510 | 1,325,151 | 1,546,512 | 2,131,723 | 1,940,678 | 1,914,003 | 1,676,995 | |
| Girardot | 56,351 | 170,345 | 272,738 | 435,384 | 919,102 | 1,310,285 | 1,264,828 | 1,988,228 | 2,383,383 |
| La Dorada | 67,211 | 126,076 | 227,942 | 249,363 | 267,424 | 196,943 | 155,296 | 420,074 | 246,712 |
| Magdalena | 69,870 | 206,254 | 288,137 | 622,339 | 399,168 | 849,509 | 1,070,087 | 941,703 | 1,508,593 |
| Nariño | 13,748 | 13,426 | 27,112 | 58,213 | 98,433 | ||||
| Nordeste | 453,775 | 607,585 | 668,842 | 1,492,621 | 1,110,588 | ||||
| Pacífico | 195,101 | 399,875 | 946,635 | 1,145,077 | 2,089,927 | 2,129,040 | 4,691,377 | 3,672,355 | |
| Tolima | 164,285 | 211,402 | 256,277 | ||||||
| Sur | 126,746 | 164,376 | 207,372 | 441,524 | 237,265 | ||||
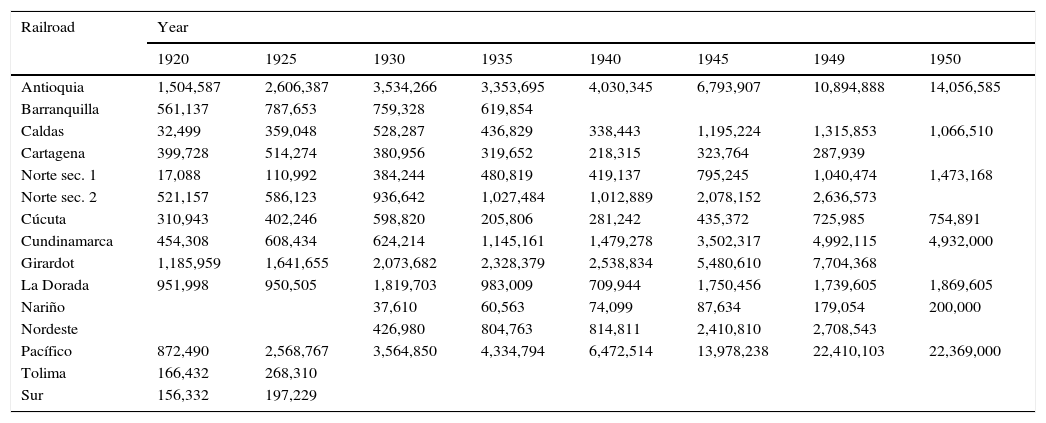
Income by railroad line (current pesos).a
| Railroad | Year | |||||||
|---|---|---|---|---|---|---|---|---|
| 1920 | 1925 | 1930 | 1935 | 1940 | 1945 | 1949 | 1950 | |
| Antioquia | 1,504,587 | 2,606,387 | 3,534,266 | 3,353,695 | 4,030,345 | 6,793,907 | 10,894,888 | 14,056,585 |
| Barranquilla | 561,137 | 787,653 | 759,328 | 619,854 | ||||
| Caldas | 32,499 | 359,048 | 528,287 | 436,829 | 338,443 | 1,195,224 | 1,315,853 | 1,066,510 |
| Cartagena | 399,728 | 514,274 | 380,956 | 319,652 | 218,315 | 323,764 | 287,939 | |
| Norte sec. 1 | 17,088 | 110,992 | 384,244 | 480,819 | 419,137 | 795,245 | 1,040,474 | 1,473,168 |
| Norte sec. 2 | 521,157 | 586,123 | 936,642 | 1,027,484 | 1,012,889 | 2,078,152 | 2,636,573 | |
| Cúcuta | 310,943 | 402,246 | 598,820 | 205,806 | 281,242 | 435,372 | 725,985 | 754,891 |
| Cundinamarca | 454,308 | 608,434 | 624,214 | 1,145,161 | 1,479,278 | 3,502,317 | 4,992,115 | 4,932,000 |
| Girardot | 1,185,959 | 1,641,655 | 2,073,682 | 2,328,379 | 2,538,834 | 5,480,610 | 7,704,368 | |
| La Dorada | 951,998 | 950,505 | 1,819,703 | 983,009 | 709,944 | 1,750,456 | 1,739,605 | 1,869,605 |
| Nariño | 37,610 | 60,563 | 74,099 | 87,634 | 179,054 | 200,000 | ||
| Nordeste | 426,980 | 804,763 | 814,811 | 2,410,810 | 2,708,543 | |||
| Pacífico | 872,490 | 2,568,767 | 3,564,850 | 4,334,794 | 6,472,514 | 13,978,238 | 22,410,103 | 22,369,000 |
| Tolima | 166,432 | 268,310 | ||||||
| Sur | 156,332 | 197,229 | ||||||
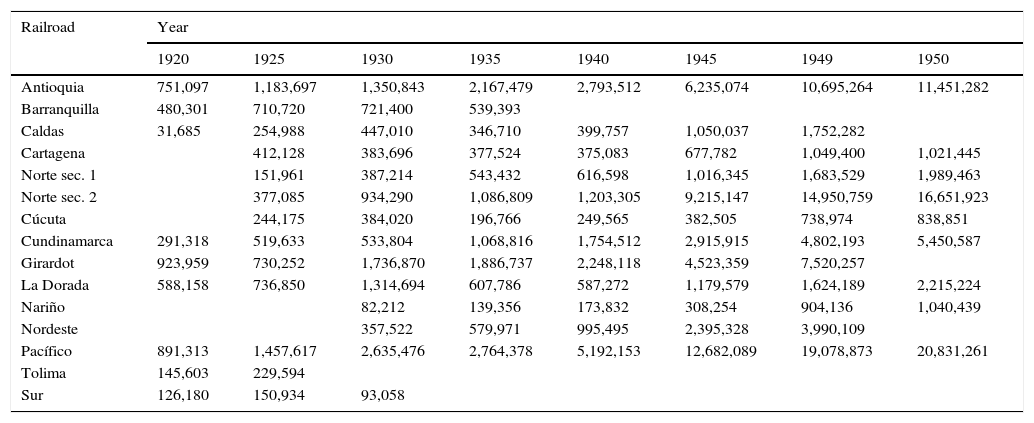
Expenditures by railroad line (current pesos).
| Railroad | Year | |||||||
|---|---|---|---|---|---|---|---|---|
| 1920 | 1925 | 1930 | 1935 | 1940 | 1945 | 1949 | 1950 | |
| Antioquia | 751,097 | 1,183,697 | 1,350,843 | 2,167,479 | 2,793,512 | 6,235,074 | 10,695,264 | 11,451,282 |
| Barranquilla | 480,301 | 710,720 | 721,400 | 539,393 | ||||
| Caldas | 31,685 | 254,988 | 447,010 | 346,710 | 399,757 | 1,050,037 | 1,752,282 | |
| Cartagena | 412,128 | 383,696 | 377,524 | 375,083 | 677,782 | 1,049,400 | 1,021,445 | |
| Norte sec. 1 | 151,961 | 387,214 | 543,432 | 616,598 | 1,016,345 | 1,683,529 | 1,989,463 | |
| Norte sec. 2 | 377,085 | 934,290 | 1,086,809 | 1,203,305 | 9,215,147 | 14,950,759 | 16,651,923 | |
| Cúcuta | 244,175 | 384,020 | 196,766 | 249,565 | 382,505 | 738,974 | 838,851 | |
| Cundinamarca | 291,318 | 519,633 | 533,804 | 1,068,816 | 1,754,512 | 2,915,915 | 4,802,193 | 5,450,587 |
| Girardot | 923,959 | 730,252 | 1,736,870 | 1,886,737 | 2,248,118 | 4,523,359 | 7,520,257 | |
| La Dorada | 588,158 | 736,850 | 1,314,694 | 607,786 | 587,272 | 1,179,579 | 1,624,189 | 2,215,224 |
| Nariño | 82,212 | 139,356 | 173,832 | 308,254 | 904,136 | 1,040,439 | ||
| Nordeste | 357,522 | 579,971 | 995,495 | 2,395,328 | 3,990,109 | |||
| Pacífico | 891,313 | 1,457,617 | 2,635,476 | 2,764,378 | 5,192,153 | 12,682,089 | 19,078,873 | 20,831,261 |
| Tolima | 145,603 | 229,594 | ||||||
| Sur | 126,180 | 150,934 | 93,058 | |||||
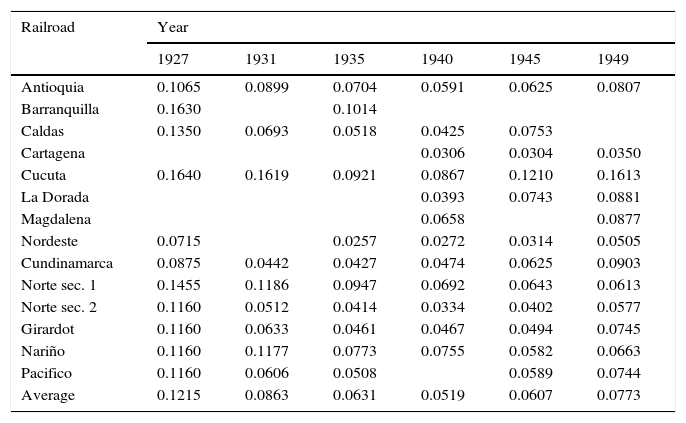
Average freight rates by railroad line: tons per km (current pesos).
| Railroad | Year | |||||
|---|---|---|---|---|---|---|
| 1927 | 1931 | 1935 | 1940 | 1945 | 1949 | |
| Antioquia | 0.1065 | 0.0899 | 0.0704 | 0.0591 | 0.0625 | 0.0807 |
| Barranquilla | 0.1630 | 0.1014 | ||||
| Caldas | 0.1350 | 0.0693 | 0.0518 | 0.0425 | 0.0753 | |
| Cartagena | 0.0306 | 0.0304 | 0.0350 | |||
| Cucuta | 0.1640 | 0.1619 | 0.0921 | 0.0867 | 0.1210 | 0.1613 |
| La Dorada | 0.0393 | 0.0743 | 0.0881 | |||
| Magdalena | 0.0658 | 0.0877 | ||||
| Nordeste | 0.0715 | 0.0257 | 0.0272 | 0.0314 | 0.0505 | |
| Cundinamarca | 0.0875 | 0.0442 | 0.0427 | 0.0474 | 0.0625 | 0.0903 |
| Norte sec. 1 | 0.1455 | 0.1186 | 0.0947 | 0.0692 | 0.0643 | 0.0613 |
| Norte sec. 2 | 0.1160 | 0.0512 | 0.0414 | 0.0334 | 0.0402 | 0.0577 |
| Girardot | 0.1160 | 0.0633 | 0.0461 | 0.0467 | 0.0494 | 0.0745 |
| Nariño | 0.1160 | 0.1177 | 0.0773 | 0.0755 | 0.0582 | 0.0663 |
| Pacifico | 0.1160 | 0.0606 | 0.0508 | 0.0589 | 0.0744 | |
| Average | 0.1215 | 0.0863 | 0.0631 | 0.0519 | 0.0607 | 0.0773 |
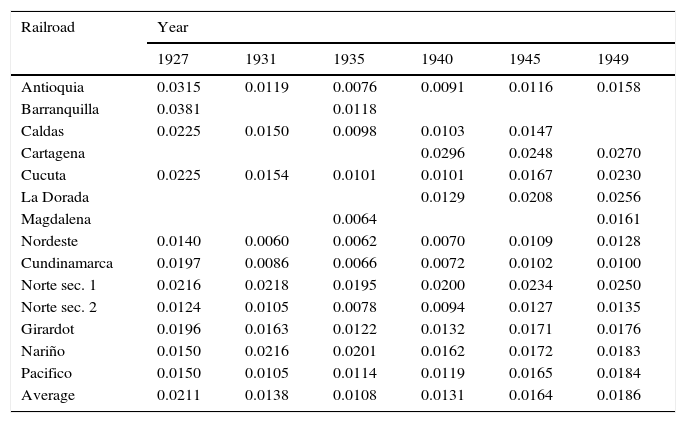
Average passenger fare by railroad line: passenger per km (current pesos).
| Railroad | Year | |||||
|---|---|---|---|---|---|---|
| 1927 | 1931 | 1935 | 1940 | 1945 | 1949 | |
| Antioquia | 0.0315 | 0.0119 | 0.0076 | 0.0091 | 0.0116 | 0.0158 |
| Barranquilla | 0.0381 | 0.0118 | ||||
| Caldas | 0.0225 | 0.0150 | 0.0098 | 0.0103 | 0.0147 | |
| Cartagena | 0.0296 | 0.0248 | 0.0270 | |||
| Cucuta | 0.0225 | 0.0154 | 0.0101 | 0.0101 | 0.0167 | 0.0230 |
| La Dorada | 0.0129 | 0.0208 | 0.0256 | |||
| Magdalena | 0.0064 | 0.0161 | ||||
| Nordeste | 0.0140 | 0.0060 | 0.0062 | 0.0070 | 0.0109 | 0.0128 |
| Cundinamarca | 0.0197 | 0.0086 | 0.0066 | 0.0072 | 0.0102 | 0.0100 |
| Norte sec. 1 | 0.0216 | 0.0218 | 0.0195 | 0.0200 | 0.0234 | 0.0250 |
| Norte sec. 2 | 0.0124 | 0.0105 | 0.0078 | 0.0094 | 0.0127 | 0.0135 |
| Girardot | 0.0196 | 0.0163 | 0.0122 | 0.0132 | 0.0171 | 0.0176 |
| Nariño | 0.0150 | 0.0216 | 0.0201 | 0.0162 | 0.0172 | 0.0183 |
| Pacifico | 0.0150 | 0.0105 | 0.0114 | 0.0119 | 0.0165 | 0.0184 |
| Average | 0.0211 | 0.0138 | 0.0108 | 0.0131 | 0.0164 | 0.0186 |
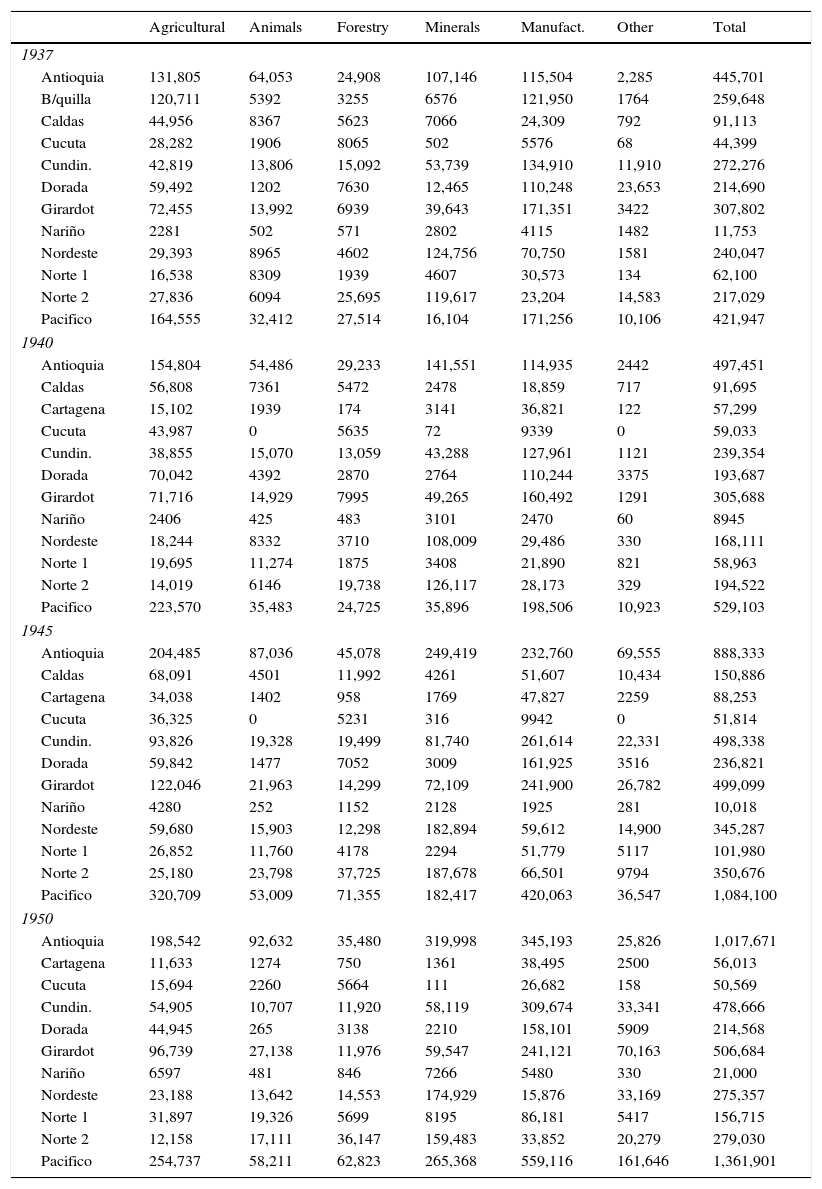
Transported freight by group of products: selected railroads, 1937–1950 (tons).
| Agricultural | Animals | Forestry | Minerals | Manufact. | Other | Total | |
|---|---|---|---|---|---|---|---|
| 1937 | |||||||
| Antioquia | 131,805 | 64,053 | 24,908 | 107,146 | 115,504 | 2,285 | 445,701 |
| B/quilla | 120,711 | 5392 | 3255 | 6576 | 121,950 | 1764 | 259,648 |
| Caldas | 44,956 | 8367 | 5623 | 7066 | 24,309 | 792 | 91,113 |
| Cucuta | 28,282 | 1906 | 8065 | 502 | 5576 | 68 | 44,399 |
| Cundin. | 42,819 | 13,806 | 15,092 | 53,739 | 134,910 | 11,910 | 272,276 |
| Dorada | 59,492 | 1202 | 7630 | 12,465 | 110,248 | 23,653 | 214,690 |
| Girardot | 72,455 | 13,992 | 6939 | 39,643 | 171,351 | 3422 | 307,802 |
| Nariño | 2281 | 502 | 571 | 2802 | 4115 | 1482 | 11,753 |
| Nordeste | 29,393 | 8965 | 4602 | 124,756 | 70,750 | 1581 | 240,047 |
| Norte 1 | 16,538 | 8309 | 1939 | 4607 | 30,573 | 134 | 62,100 |
| Norte 2 | 27,836 | 6094 | 25,695 | 119,617 | 23,204 | 14,583 | 217,029 |
| Pacifico | 164,555 | 32,412 | 27,514 | 16,104 | 171,256 | 10,106 | 421,947 |
| 1940 | |||||||
| Antioquia | 154,804 | 54,486 | 29,233 | 141,551 | 114,935 | 2442 | 497,451 |
| Caldas | 56,808 | 7361 | 5472 | 2478 | 18,859 | 717 | 91,695 |
| Cartagena | 15,102 | 1939 | 174 | 3141 | 36,821 | 122 | 57,299 |
| Cucuta | 43,987 | 0 | 5635 | 72 | 9339 | 0 | 59,033 |
| Cundin. | 38,855 | 15,070 | 13,059 | 43,288 | 127,961 | 1121 | 239,354 |
| Dorada | 70,042 | 4392 | 2870 | 2764 | 110,244 | 3375 | 193,687 |
| Girardot | 71,716 | 14,929 | 7995 | 49,265 | 160,492 | 1291 | 305,688 |
| Nariño | 2406 | 425 | 483 | 3101 | 2470 | 60 | 8945 |
| Nordeste | 18,244 | 8332 | 3710 | 108,009 | 29,486 | 330 | 168,111 |
| Norte 1 | 19,695 | 11,274 | 1875 | 3408 | 21,890 | 821 | 58,963 |
| Norte 2 | 14,019 | 6146 | 19,738 | 126,117 | 28,173 | 329 | 194,522 |
| Pacifico | 223,570 | 35,483 | 24,725 | 35,896 | 198,506 | 10,923 | 529,103 |
| 1945 | |||||||
| Antioquia | 204,485 | 87,036 | 45,078 | 249,419 | 232,760 | 69,555 | 888,333 |
| Caldas | 68,091 | 4501 | 11,992 | 4261 | 51,607 | 10,434 | 150,886 |
| Cartagena | 34,038 | 1402 | 958 | 1769 | 47,827 | 2259 | 88,253 |
| Cucuta | 36,325 | 0 | 5231 | 316 | 9942 | 0 | 51,814 |
| Cundin. | 93,826 | 19,328 | 19,499 | 81,740 | 261,614 | 22,331 | 498,338 |
| Dorada | 59,842 | 1477 | 7052 | 3009 | 161,925 | 3516 | 236,821 |
| Girardot | 122,046 | 21,963 | 14,299 | 72,109 | 241,900 | 26,782 | 499,099 |
| Nariño | 4280 | 252 | 1152 | 2128 | 1925 | 281 | 10,018 |
| Nordeste | 59,680 | 15,903 | 12,298 | 182,894 | 59,612 | 14,900 | 345,287 |
| Norte 1 | 26,852 | 11,760 | 4178 | 2294 | 51,779 | 5117 | 101,980 |
| Norte 2 | 25,180 | 23,798 | 37,725 | 187,678 | 66,501 | 9794 | 350,676 |
| Pacifico | 320,709 | 53,009 | 71,355 | 182,417 | 420,063 | 36,547 | 1,084,100 |
| 1950 | |||||||
| Antioquia | 198,542 | 92,632 | 35,480 | 319,998 | 345,193 | 25,826 | 1,017,671 |
| Cartagena | 11,633 | 1274 | 750 | 1361 | 38,495 | 2500 | 56,013 |
| Cucuta | 15,694 | 2260 | 5664 | 111 | 26,682 | 158 | 50,569 |
| Cundin. | 54,905 | 10,707 | 11,920 | 58,119 | 309,674 | 33,341 | 478,666 |
| Dorada | 44,945 | 265 | 3138 | 2210 | 158,101 | 5909 | 214,568 |
| Girardot | 96,739 | 27,138 | 11,976 | 59,547 | 241,121 | 70,163 | 506,684 |
| Nariño | 6597 | 481 | 846 | 7266 | 5480 | 330 | 21,000 |
| Nordeste | 23,188 | 13,642 | 14,553 | 174,929 | 15,876 | 33,169 | 275,357 |
| Norte 1 | 31,897 | 19,326 | 5699 | 8195 | 86,181 | 5417 | 156,715 |
| Norte 2 | 12,158 | 17,111 | 36,147 | 159,483 | 33,852 | 20,279 | 279,030 |
| Pacifico | 254,737 | 58,211 | 62,823 | 265,368 | 559,116 | 161,646 | 1,361,901 |
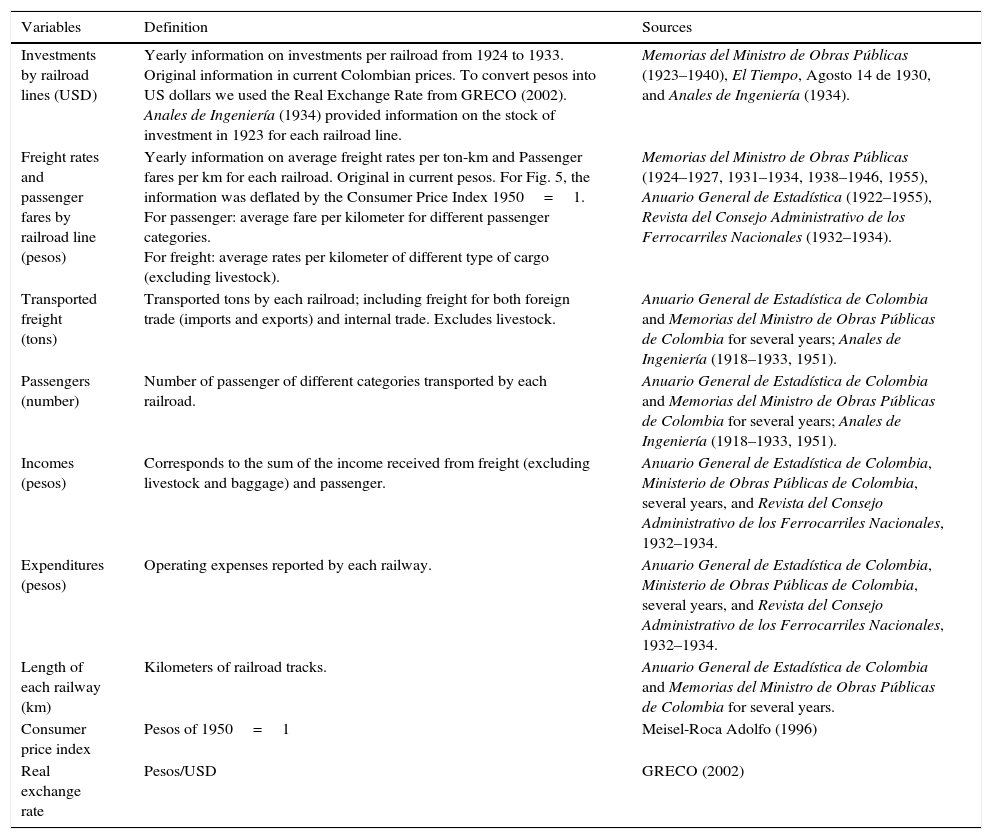
Definitions and sources of variables.
| Variables | Definition | Sources |
|---|---|---|
| Investments by railroad lines (USD) | Yearly information on investments per railroad from 1924 to 1933. Original information in current Colombian prices. To convert pesos into US dollars we used the Real Exchange Rate from GRECO (2002). Anales de Ingeniería (1934) provided information on the stock of investment in 1923 for each railroad line. | Memorias del Ministro de Obras Públicas (1923–1940), El Tiempo, Agosto 14 de 1930, and Anales de Ingeniería (1934). |
| Freight rates and passenger fares by railroad line (pesos) | Yearly information on average freight rates per ton-km and Passenger fares per km for each railroad. Original in current pesos. For Fig. 5, the information was deflated by the Consumer Price Index 1950=1. For passenger: average fare per kilometer for different passenger categories. For freight: average rates per kilometer of different type of cargo (excluding livestock). | Memorias del Ministro de Obras Públicas (1924–1927, 1931–1934, 1938–1946, 1955), Anuario General de Estadística (1922–1955), Revista del Consejo Administrativo de los Ferrocarriles Nacionales (1932–1934). |
| Transported freight (tons) | Transported tons by each railroad; including freight for both foreign trade (imports and exports) and internal trade. Excludes livestock. | Anuario General de Estadística de Colombia and Memorias del Ministro de Obras Públicas de Colombia for several years; Anales de Ingeniería (1918–1933, 1951). |
| Passengers (number) | Number of passenger of different categories transported by each railroad. | Anuario General de Estadística de Colombia and Memorias del Ministro de Obras Públicas de Colombia for several years; Anales de Ingeniería (1918–1933, 1951). |
| Incomes (pesos) | Corresponds to the sum of the income received from freight (excluding livestock and baggage) and passenger. | Anuario General de Estadística de Colombia, Ministerio de Obras Públicas de Colombia, several years, and Revista del Consejo Administrativo de los Ferrocarriles Nacionales, 1932–1934. |
| Expenditures (pesos) | Operating expenses reported by each railway. | Anuario General de Estadística de Colombia, Ministerio de Obras Públicas de Colombia, several years, and Revista del Consejo Administrativo de los Ferrocarriles Nacionales, 1932–1934. |
| Length of each railway (km) | Kilometers of railroad tracks. | Anuario General de Estadística de Colombia and Memorias del Ministro de Obras Públicas de Colombia for several years. |
| Consumer price index | Pesos of 1950=1 | Meisel-Roca Adolfo (1996) |
| Real exchange rate | Pesos/USD | GRECO (2002) |
Regalsky and Salerno (2008) indicate that the bulk of railway construction was undertaken earlier, and stopped by 1914. In the early twenties, the largest investment went to the continuation and completion of the work suspended in 1914. However, the mediocre financial results of exploitation of the railways resulted in permanent operating deficits that interfered with the continuity of investment programs (p. 128).
The authors are a member of the Board of Directors; a senior researcher; and an economist at Banco de la República, respectively. The opinions expressed herein are those of the authors and do not necessarily reflect the views of Banco de la República or its Board of Directors.
Coffee railroads were the group of railways that cross the coffee producing region of the country; this group included the railway of: Antioquia, Cucuta, Girardot, Tolima, Pacifico, and Dorada.
For a complete analysis of the forward effects of Colombian railroads, see Ramírez-Giraldo (2001). For a study of backward effects of railroad developments, see Ramírez-Giraldo (2007), who found that these effects on the Colombian economy were very low. These results are similar to those found for other Latin-American countries. For instance, see Coatsworth (1979), Guajardo-Soto (1998) and Kuntz-Ficker (1999b).
For Kuntz-Ficker (1999b), the effects of railroads on the internal market would have been much greater than the link with their external sector.
For a complete discussion of the role of railroads in the Mexican economy, see Kuntz-Ficker (1999b).
This period was chosen because in the 20s there was an investment boom in railroad construction with external resources. On the other hand, most of the railroads went bankrupt and had to suspend operations after 1950, and highways rapidly replaced railroad transportation.
See Safford (2010) for a study of the evolution of infrastructure development in Colombia during the nineteenth century, and Pachón-Muñoz, A. and Ramírez-Giraldo, M.T. for the twentieth century (2006).
See http://moxlad.fcs.edu.uy/en/databaseaccess.html for complete data.
For details see Kemmerer (1923, p. 12).
Before the existence of railroads, mules were the main means of transportation, and the infrastructure consisted of rudimentary roads and a few navigable rivers. The Magdalena River was the main channel for water transportation. Railways were built to connect production areas to the Magdalena River, and particularly to transport coffee from the production centers to the river ports. Therefore, railroads were built to complement river navigation, not to substitute it. For details on infrastructure developments in Colombia, see Pachón-Muñoz and Ramírez-Giraldo (2006), and for an analysis of steam river navigation, see Poveda-Ramos (1998).
Railways received the resources from external borrowing in the form of direct investment, since most of them were owned by the Nation. Unconditional grants were also used for the railways that were owned by the departments. For instance, 15% of the resources invested in railroads were unconditional grants allocated to railroads owned by the departments from the US compensation for Panama, and the remainder were directly invested in railroads owned by the Nation.
During the period 1920–1950, most railways were owned by the Nation or by departments. By the end of the period, very few railways were privately owned. In particular, the Norte, Girardot, Nariño, and Pacific railways were owned by the Nation; the railway in Antioquia was owned by the department of Antioquia; the railway in Caldas the department of Caldas; the Tolima railway was owned by the department of Tolima; the Barranquilla railway was privately owned until 1933; the Cartagena railway was privately owned until 1940, when it was nationalized; the department of Cundinamarca owned its railway, which was later nationalized; the Dorada railway was privately owned until 1946, when it was nationalized; Nordeste was owned by the department of Cundinamarca until 1938, when it was nationalized; the Cucuta railway was privately owned.
In addition, according to Tafunell (2009), during 1920–1930, the amounts invested on transportation equipment in Colombia increased considerably. In fact, in 1910–1919, this investment only represented 1.2% of total investment in Latin-America, but in 1920–1930 it represented more than 5% (p. 50).
In 1930, the ratio kilometers of railways per 1000km2 of surface was 2.29 in Colombia, while in Argentina the ratio was 13.66; in Chile, 11.82; in Brazil, 3.81; in Ecuador, 2.35, and in Peru 2.24 (calculation based on http://moxlad.fcs.edu.uy/en/databaseaccess.html).
See Avella Gómez (2003) for a complete analysis on the process of moratorium on the Colombian external debt between 1931 and 1935.
In 1930, an important political change took place in Colombia. After a long period of conservative governments, the liberal party won the elections. The new government considered that previous infrastructure policies had not brought the progress that the country needed. Therefore, they decided to revise and eliminate all previous laws, and promulgate new laws on transport infrastructure. In 1931, the Congress issued Law 29 for railroads and Law 88 for highways, which modified almost all the previous laws issued on this matter before 1930. These laws favored investment in roads versus investment in railways, also arguing that highways had the advantage over railroads because they could cross the high mountains of the country at a lower cost, and would integrate the markets. Also, the new government followed a policy of reducing rates that later led to the bankruptcy of the railways (Pachón-Muñoz and Ramírez-Giraldo, 2006, pp. 48–50).
See, for instance, Annals of Engineering (1929, 1934) from the Colombian Society of Engineering and Memorias del Ministro de Obras Públicas (1929, 1930, 1931).
For details see Hartwig (1983, pp. 98–99).
Enrique Vélez was a Colombian public works fiscal inspector.
For more information see Jorgensen and Sachs (1989, Ch. 3).
See Pachón-Muñoz and Ramírez-Giraldo (2006) for more details on highways and the railroad tariff policy.
Information taken from: http://www.nber.org/databases/macrohistory/contents/chapter13.html.
For instance, between 1925 and 1940, more than 30% of the total freight carried by the Pacific Railway was coffee. This figure was almost 20% for the Antioquia railroad. In 1935, coffee represented 32% and 21% of the total freight of the railways in Cucuta and La Dorada, respectively (estimation based on the information from Anuario General de Estadistica, several years).
On average, agricultural products and manufactured goods were the main products transported by railroads. In fact, in 1937 the composition of freight was: manufactured goods 36%, agricultural products 30%, mineral products 18%, animals 6%, forestry 6%, and other products 3%. In 1950, this composition changed as follows: manufactured goods 44%, minerals 22%, agricultural products 19%, minerals 5%, forestry 5%, and other goods 6% (Appendix 6).