

This paper aims to examine the relationships between different types of cultures and effectiveness in Total Quality Management (TQM) implementation. Using Cameron's framework, we have tested the connection between a quality culture taxonomy and TQM programme performance using data from a survey carried out with 113 Spanish companies that have implemented TQM systems. A structural equation modelling is proposed to assess the links between both types of constructs using the Partial Least Squares (PLS) technique. The most substantial results confirm, in the sample analysed, the relationship between quality culture types and the TQM programme performance, and there being different influence levels of the quality cultures.
Este artículo examina las relaciones entre los diferentes tipos de cultura y la efectividad en la implantación de la Gestión de la Calidad Total (GCT). Utilizando el modelo de Cameron, hemos testado la relación entre una taxonomía de culturas de calidad y el rendimiento de un programa de GCT en una muestra de 113 empresas españolas que tienen implantados sistemas GCT. Se propone un modelo de ecuaciones estructurales para evaluar las relaciones entre ambos tipos de constructos utilizando para ello la técnica Partial Least Squares (PLS). Los resultados en la muestra utilizada confirman las relaciones entre los tipos de culturas de calidad y el rendimiento de los programas GCT, así como la existencia de diferentes niveles de influencia de estas culturas de calidad.
Although TQM has received much interest in the management literature, there is a lack of agreement and clarity about its concept, definitions, key dimensions and the relationship between quality and organisational performance. While many studies have shown that firms have succeeded by employing a quality strategy (Ittner & Larcker, 1997; Sim & Killough, 1998), others have found that almost two-thirds of US and UK firms saw “zero competitive gain” from TQM or mixed findings in relation to the TQM's success (Sohal & Terziovski, 2000; Soltani, van der Meer, & Williams, 2005; Taylor & Wright, 2003).
The mixed findings concerning the success of quality practices pose the question as to whether or not organisations are committed to TQM practices, and what factors can contribute to TQM success. In a special way, the importance of an organisational culture that is conducive to TQM practices is frequently referred to in the literature (Prajogo & McDermott, 2005; Rahman & Sohal, 2002; Sarros, Gray, Densten, & Cooper, 2005), with numerous authors referring to the need to change the organisational culture and attitudes of the workforce for TQM to be effective (Kumar & Sankaran, 2007; Sohal & Terziovski, 2000).
For this reason, some researchers have begun to explore TQM as a cultural phenomenon rather than a set of tools and techniques (Cameron & Sine, 1999; Cameron, 1991; Powell, 1995). The outcomes of some research works have reported evidence that successful TQM implementation depends on the organisation's quality culture (Cameron & Quinn, 1999). This means that unless this was congruent with the TQM initiatives, positive outcomes were less likely.
Using Cameron's framework for organisational quality culture (Cameron, 1991; Cameron, Freeman, & Mishra, 1993), this paper explores the relationship between quality cultures and TQM programme performance in a sample of 113 Spanish companies.
2Difficulties of TQM implementationThe implementation of TQM programmes seems to require very radical reforms, sometimes insurmountable, in basic organisational areas such as culture and leadership styles. Some empirical research carried out from the point of view of “Organisational Ecology” shows that innovations – for TQM this means innovation in organisation management – affect key organisational aspects such as strategy, structure and culture, these being specifically the aspects which offer the main risks to survival. There can also be some opposition to adopting these innovations, even if their expected values are positive for the organisation (Hannan & Freeman, 1984; Singh, Tucker, & House, 1986).
Other authors (see Carman, 1993) point out that many organisations will show some resistance to trying out basic reforms – even if improvement in organisational performance or fulfilment is expected from them – either due to their reticence to taking risks, their expectations that the strategies followed at present will bear fruit a little later or their fear of facing the mess brought about by such a change.
An analysis founded on the “Resources-based Theory” also corroborates the former idea of implementation difficulties, suggesting that many companies which are potential adopters of TQM programmes may find it difficult to imitate these programmes due to various factors which include the social complexity of certain organisations, the uncertainty about the cause-effect relationship between implementing TQM and the organisational performance (causal ambiguity), the time required to understand and assimilate the new programme and its subsequent cost, and so on (Barney, 1986, 1991; Dierickx & Cool, 1989; Peteraf, 1993). Besides, many managers may not make up their minds to implement TQM in their organisation on the grounds of shortage of human and/or financial resources. They may understand the advantages of employees’ empowerment, quality teams, suggestion systems and training programmes, and so forth, but might find them completely impossible to implement in their company with the resources that are available there.
In this sense, Young (1992) adduces that companies are not very likely to adopt certain practices related to Total Quality both successfully and in the short term if the following situations coincide: (1) Employees that are not really disciplined in their work. (2) Absence or lack of orientation towards teamwork. (3) Lack of cultural or demographic homogeneity. (4) Preference for fixed working rules and little initiative. (5) Poor opinion or acceptance of training. (6) Staff members generally unaccustomed to relating salary and fulfilment of the company's performance or results.
All the features described by Young (1992) for quality practices to be successfully implemented not only require a large amount of time for the change to take place but also increase the difficulties of achievement. When considering TQM adoption, many organisations may not realise or be aware that being successful depends not only on the correct implementation of TQM attributes, but also on the occurrence of certain complementary factors that may not apparently be TQM-related (such as the ones described by Young above). These are often more difficult to achieve or imitate than those which are specific to TQM.
For example, TQM implementation seems to require an organisational culture receptive to changes, improvement-based motivation both on a personal and an organisational level, people willing to get involved and understand – and later implement – a particular group of principles, TQM techniques and practices, corporate perseverance (some years may pass by without noticing the results), capacity for leadership and commitment at the highest level and perhaps some exogenous factors which mean a provocation or challenge and motivate learning and change (for instance, the threat of a rival, etc.). Without these so to speak complementary resources (many of which are intangible, ambiguous and difficult to imitate or achieve for certain companies), a TQM programme may become a complete failure (Winter, 1987).
3A quality culture typologyCameron (1991) has developed a quality culture pattern in which three different focuses/points of view about quality are described: error culture (EC), anticipation culture (AC) and creative culture (CC). These are quality-focused points of view and make up the ways or means that explain what organisations think of quality and how they define it. This means that an organisation's quality culture refers to its values about and interpretations of quality as well as about the way it seeks quality. It is not simply the existence of quality tools or techniques such as statistical process control, quality function development, continuous improvement cycles, experiment designing, and so on. Differences in cultural profiles of quality do exist in organisations. They are a fact and, according to Cameron, are widespread throughout various industrial and service companies. In terms of Cameron and Sine (1999, p. 10) “the quality culture of an organisation is a subset of an organisation's overall culture. It reflects the general approach, the values, and the orientation towards quality that permeate organisational actions. The key advantage of treating quality as a cultural variable is that the ambiguity associated with the multiple definitions and dimensions of TQM diminish”.
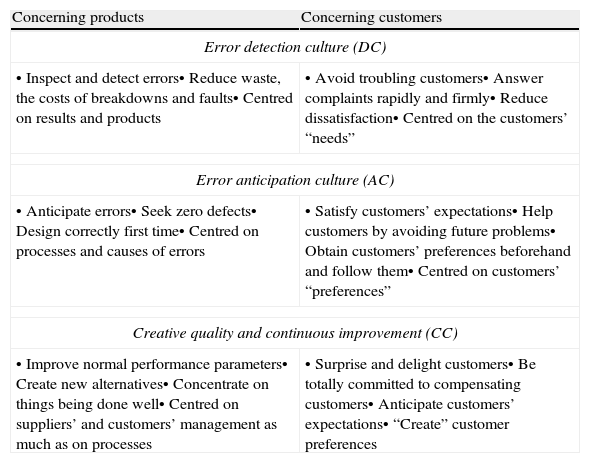
Table 1 shows the attributes attached to each of the three cultural types as distinguished by Cameron et al. (1993). Although in real terms no organisation is characterised by a single quality focus, most of them tend to emphasise or concentrate on one of them as the prevailing focus.
A model of quality cultures.
| Concerning products | Concerning customers |
| Error detection culture (DC) | |
| • Inspect and detect errors• Reduce waste, the costs of breakdowns and faults• Centred on results and products | • Avoid troubling customers• Answer complaints rapidly and firmly• Reduce dissatisfaction• Centred on the customers’ “needs” |
| Error anticipation culture (AC) | |
| • Anticipate errors• Seek zero defects• Design correctly first time• Centred on processes and causes of errors | • Satisfy customers’ expectations• Help customers by avoiding future problems• Obtain customers’ preferences beforehand and follow them• Centred on customers’ “preferences” |
| Creative quality and continuous improvement (CC) | |
| • Improve normal performance parameters• Create new alternatives• Concentrate on things being done well• Centred on suppliers’ and customers’ management as much as on processes | • Surprise and delight customers• Be totally committed to compensating customers• Anticipate customers’ expectations• “Create” customer preferences |
In order to evaluate the quality culture that characterises or prevails in a given organisation, the methodology chosen was the one prepared by Cameron (1991) and Cameron et al. (1993). This provides a measure of the emphasis given by each company to the different aspects of each of the three types of quality culture.
All the organisations in this research gave at least some degree of emphasis to each of the different cultures, but there was a predominance of one of the culture types over the others in every case. When an organisation focuses more (in relative terms) on an error-detection culture, Cameron et al. (1993) consider it “of a less developed quality culture level”. On the other hand, when more emphasis is given to the error-anticipation and/or creative quality, it is known as “high quality culture level”.
4Research model and hypothesesThe literature offers various evidence about the causal relationship of TQM factors with performance (Garvin, 1988; Lee, Adam, & Tuan, 1999; Powell, 1995; Ross & Shetty, 1985; Terziovski & Samson, 1999). Despite several studies not supporting the existence of this relationship (Becker, 1993; Fisher, 1991; Salegna & Fazel, 1995), most of the research works found a positive link between both kinds of constructs. They offered the following arguments: TQM-related factors increase the firm's competitive position by (1) process improvements (Terziovski & Samson, 1999), (2) product improvements (Mann & Kehoe, 1994), (3) process time reductions (Youssef, Boyd, & Williams, 1996), (4) error and waste cutting (Flynn, Schroeder, & Sakakibara, 1995; Lemak & Reed, 1997), (5) customer satisfaction focus (Dow, Samson, & Ford, 1999; Terziovski & Samson, 1999), (6) the cooperation networks’ use – including internal and external agents (Larson & Sinha, 1995), (7) the emergence of distinctive competencies (Escrig, 2001; Powell, 1995), and (8) learning and knowledge transfer processes – benchmarking (Adam et al., 1997; Dow et al., 1999; Escrig, 2001; Leal & Roldán, 2001; Powell, 1995).
The above works are characterised by the use of a large diversity of focuses on the performance construct. Thus, while some contributions have used performance indicators of TQM system implementation, others have employed global performance measures of the organisation (both objective and subjective). Although the greater part of the works have applied a TQM approach focused on system implementation factors, it is also true that there is a group of values and beliefs underlying every TQM implementation, i.e., a certain cultural philosophy or orientation.
On the other hand, TQM programme performance, in Powell's (1995) sense, refers to the business performance (financial and operational) induced by the TQM programme implementation.
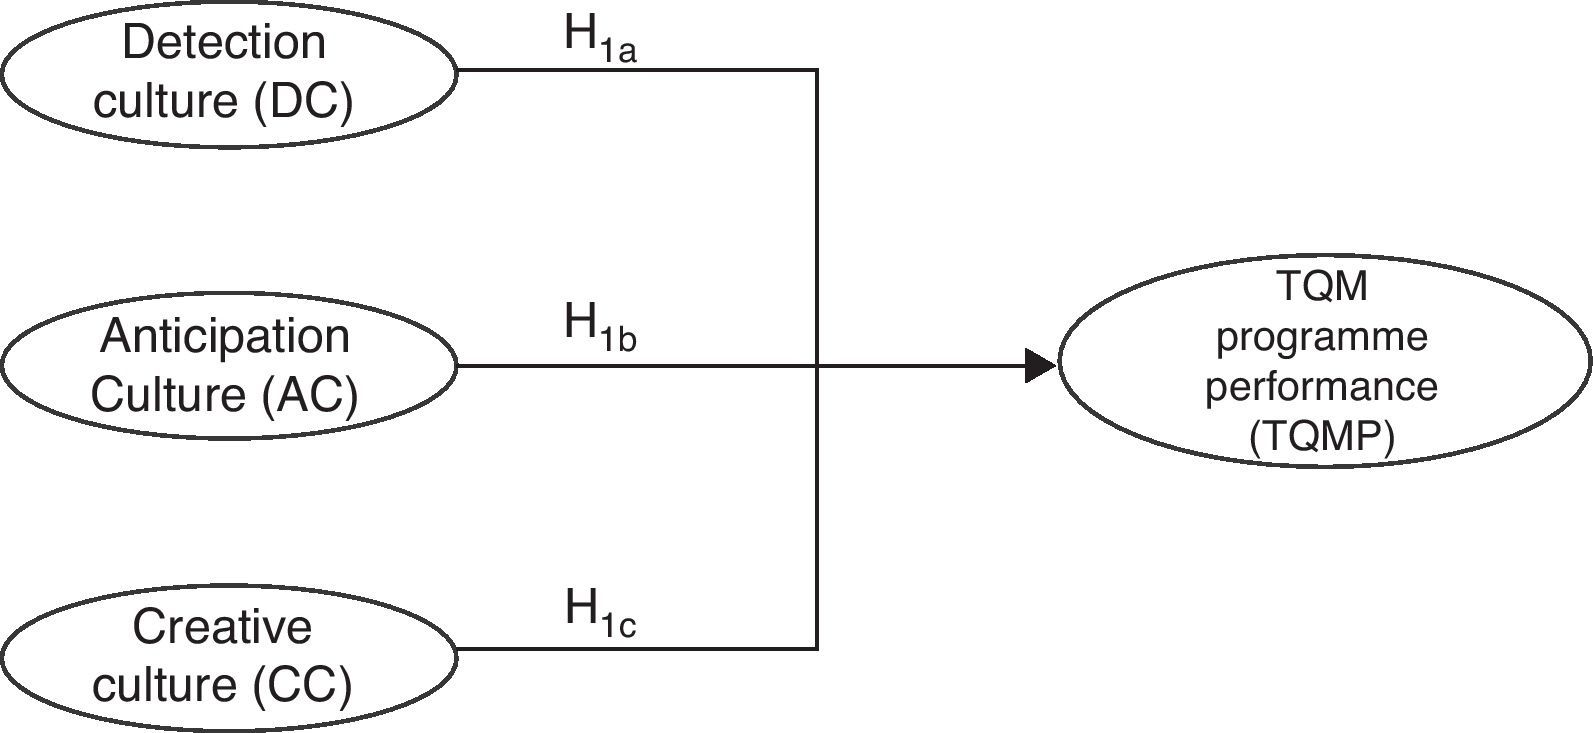
Based on the evidence offered by the literature quoted, we have formulated the following general hypothesis:H1 The quality culture adoption will be positively related to TQM programme performance.
This general proposition can be extended to the following three specific hypotheses (Fig. 1):H1a Detection culture (DC) will be positively related to TQM programme performance (TQMP). Anticipation culture (AC) will be positively related to TQM programme performance (TQMP). Creative culture (CC) will be positively related to TQM programme performance (TQMP).

A survey instrument was used to gather data to test the relationships shown in the research model. The study was carried out in Spain. A pilot test of the survey was carried out in order to assess the content validity and internal consistency1 of the instrument (Nunnally, 1978). The instrument was pre-tested with TQM managers of 30 firms.
The selected sample included 554 firms, which had implemented a TQM system. This sample was made up of 502 companies with ISO 9000 from the Spanish Agency of Standardisation and Certification (AENOR), and 79 enterprises, members of the Spanish Quality Management Club. The respondents of the survey were the CEOs or top executives of the sample selected. Finally, valid responses from 113 organisations were obtained. This is a response rate of 20.4%. A summary of the demographic characteristics indicates the predominance of manufactory firms (62%) in comparison to service companies (20%). Most of them had a broad experience with TQM system implementation (72% revealed more than five years of TQM experience), and 47% are small and medium-size enterprises (under 500 employees).
5.2MeasuresItems have been derived and translated from previously-verified sources. Because of paper-length limits, we cannot show the scales. A copy of the research instrument is available from the first author.
Indexes used to measure the three types of quality cultures, i.e., detection, anticipation, and creative culture have been adapted from Cameron (1991) and Cameron et al. (1993) and each consists of 8 descriptions. These items are attributes concerning the way that companies direct their TQM principles in their search for total quality. As in the original survey of Cameron (1991), respondents were asked to divide 100 points among the items corresponding to the three scenarios, according to the importance or emphasis that they attach to them in practice. Since the aim of Cameron's research was to identify the dominant culture starting from an additive operation, where the existence of correlated items or internal consistency was not presupposed, we decided to define the indicators that make up each culture type as formative indicators, i.e., indicators that cause or give rise to the unobserved theoretical construct (each type of culture). In this case, the empirical indicators produce or contribute to the latent variable (LV) (Fornell, 1982), representing different facets of it. Our objective is to account for the LV or component-level variance rather than observed indicators.
On the other hand, TQM programme performance was assessed by a scale adapted from Powell (1995, p. 37). This had five items measured on a five-point Likert scale, from “strongly disagree” (1) to “strongly agree” (5).
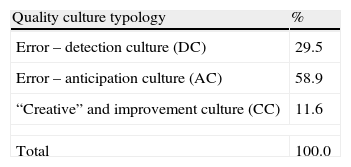
5.3Data analysisA descriptive result of our research (Table 2) points out there being a considerable predominance of “high level” cultures (AC and CC) among the Spanish companies studied (70.5%). However, there is a critical percentage (29.5%) of companies that still emphasise the type of quality cultures known as “error detection” (DC), which means focusing the employees’ attention on values and attributes which are nowadays to a certain extent overcome, if not obsolete, within the paradigm of Total Quality Management.
The research model has been tested using Partial Least Squares (PLS), a variance-based structural equation modelling (Roldán & Sánchez-Franco, 2012). We have used the PLS approach because this method is primarily intended for causal-predictive analysis in which the problems explored are complex and theoretical knowledge is scarce. PLS is an appropriate technique to use in a theory development situation (Wold, 1979), such as this research. In addition, the size of the final sample used also suggested the use of PLS with regard to covariance-based structural equation modelling (maximum-likelihood) (Reinartz, Haenlein, & Henseler, 2009). We have used the PLS-Graph software version 3.0 (Chin, 2003).
A PLS model is analysed and interpreted in two stages: (1) the assessment of the reliability and validity of the measurement model, and (2) the assessment of the structural model. This sequence ensures that the constructs’ measures are valid and reliable before attempting to draw conclusions regarding relationships among constructs (Barclay, Higgins, & Thompson, 1995).
6Results6.1Measurement modelThe measurement model for reflective constructs is assessed in terms of individual item reliability, construct reliability, convergent validity, and discriminant validity. In this respect, we would like to point out that the predictor variables – i.e., DC, AC and CC variables – are constructs specified with formative indicators. A latent variable with formative indicators implies that the construct is expressed as a function of the variables. The variables observed form, cause, or precede the construct (Diamantopoulos & Winklhofer, 2001). Because the LV is viewed as an effect rather than a cause of the indicator responses, traditional reliability and validity assessment have been argued as inappropriate and illogical (Bagozzi, 1994; Bollen, 1989).
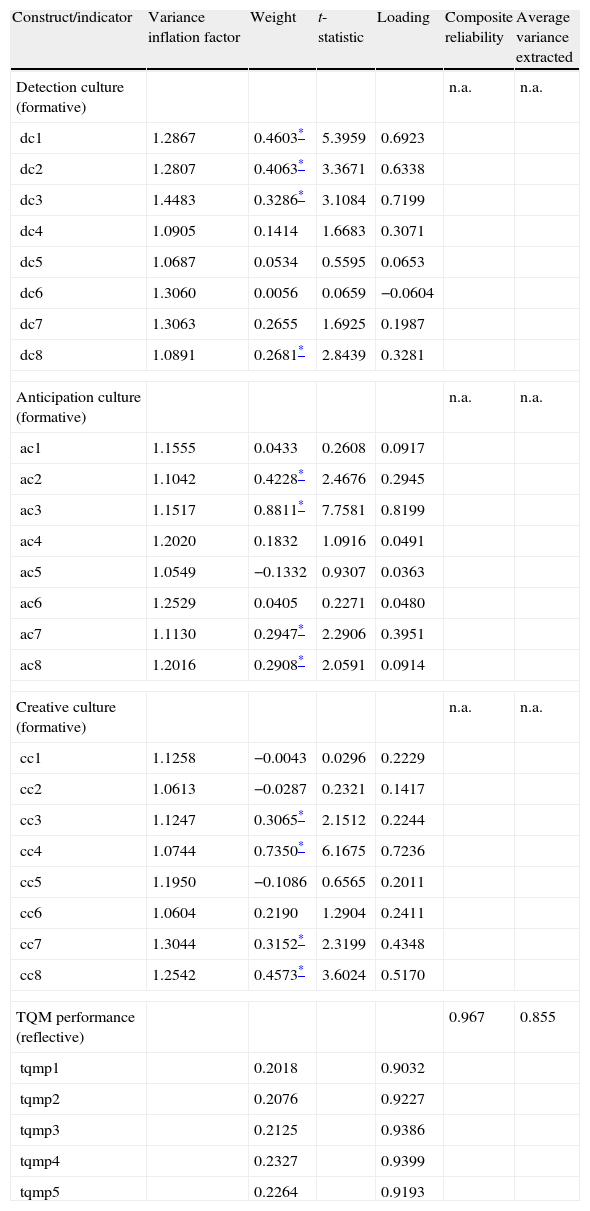
Individual item reliability is considered adequate when an item has a factor loading that is greater than 0.7 on its respective construct (Carmines & Zeller, 1979). This is applicable to variables with reflective indicators, i.e., TQMP (Table 3). Notwithstanding, in the case of constructs measured by formative indicators, the loadings are misleading because the intraset correlations for each block were never taken into account in the estimation process. Therefore, the assessment of formative measurement models at the indicator level is based on testing potential multicollinearity among items, as well as the analysis of weights (Roldán & Sánchez-Franco, 2012). A high collinearity among indicators would produce unstable estimates and would make it difficult to separate the distinct effect of the individual manifest variables on the construct. Consequently, a collinearity test was performed using the SPSS programme. Petter, Straub, and Rai (2007) indicate that a variance inflation factor (VIF) statistic greater than 3.3 signals a high multicollinearity. The maximum VIF value for our formative indicators came to 1.4483, well below this threshold (Table 3).
Measurement model.
| Construct/indicator | Variance inflation factor | Weight | t-statistic | Loading | Composite reliability | Average variance extracted |
| Detection culture (formative) | n.a. | n.a. | ||||
| dc1 | 1.2867 | 0.4603* | 5.3959 | 0.6923 | ||
| dc2 | 1.2807 | 0.4063* | 3.3671 | 0.6338 | ||
| dc3 | 1.4483 | 0.3286* | 3.1084 | 0.7199 | ||
| dc4 | 1.0905 | 0.1414 | 1.6683 | 0.3071 | ||
| dc5 | 1.0687 | 0.0534 | 0.5595 | 0.0653 | ||
| dc6 | 1.3060 | 0.0056 | 0.0659 | −0.0604 | ||
| dc7 | 1.3063 | 0.2655 | 1.6925 | 0.1987 | ||
| dc8 | 1.0891 | 0.2681* | 2.8439 | 0.3281 | ||
| Anticipation culture (formative) | n.a. | n.a. | ||||
| ac1 | 1.1555 | 0.0433 | 0.2608 | 0.0917 | ||
| ac2 | 1.1042 | 0.4228* | 2.4676 | 0.2945 | ||
| ac3 | 1.1517 | 0.8811* | 7.7581 | 0.8199 | ||
| ac4 | 1.2020 | 0.1832 | 1.0916 | 0.0491 | ||
| ac5 | 1.0549 | −0.1332 | 0.9307 | 0.0363 | ||
| ac6 | 1.2529 | 0.0405 | 0.2271 | 0.0480 | ||
| ac7 | 1.1130 | 0.2947* | 2.2906 | 0.3951 | ||
| ac8 | 1.2016 | 0.2908* | 2.0591 | 0.0914 | ||
| Creative culture (formative) | n.a. | n.a. | ||||
| cc1 | 1.1258 | −0.0043 | 0.0296 | 0.2229 | ||
| cc2 | 1.0613 | −0.0287 | 0.2321 | 0.1417 | ||
| cc3 | 1.1247 | 0.3065* | 2.1512 | 0.2244 | ||
| cc4 | 1.0744 | 0.7350* | 6.1675 | 0.7236 | ||
| cc5 | 1.1950 | −0.1086 | 0.6565 | 0.2011 | ||
| cc6 | 1.0604 | 0.2190 | 1.2904 | 0.2411 | ||
| cc7 | 1.3044 | 0.3152* | 2.3199 | 0.4348 | ||
| cc8 | 1.2542 | 0.4573* | 3.6024 | 0.5170 | ||
| TQM performance (reflective) | 0.967 | 0.855 | ||||
| tqmp1 | 0.2018 | 0.9032 | ||||
| tqmp2 | 0.2076 | 0.9227 | ||||
| tqmp3 | 0.2125 | 0.9386 | ||||
| tqmp4 | 0.2327 | 0.9399 | ||||
| tqmp5 | 0.2264 | 0.9193 | ||||
n.a.: non-applicable.
Next, we assess the weights of the formative indicators. Weights measure the contribution of each formative item to the variance of the construct (Roberts & Thatcher, 2009). They provide information about how each formative indicator contributes to the respective composite construct (Chin, 1998). Hence, they allow us to rank indicators according to their contribution. Also, a significance level of at least 0.05 suggests that a formative measure is relevant for the construction of the composite latent construct (Roldán & Sánchez-Franco, 2012). Consequently, we have checked the significance of the weights with a resampling procedure (bootstrap with 500 resamples) to obtain statistic values. In this vein, we observe the presence of non-significant formative indicators in Table 3. Nevertheless, we decide to keep these indicators because removing a formative indicator would imply the eliminating of a part of the composite latent construct (Roberts & Thatcher, 2009).
The measures for construct reliability and convergent validity represent measures of internal consistency and, as discussed earlier, are only applicable for LVs with reflective indicators, i.e., TQMP. Construct reliability is assessed using a measure of internal consistency: composite reliability (ρc). We interpret this value using the guidelines offered by Nunnally (1978) who suggests 0.7 as a benchmark for a ‘modest’ reliability applicable in the early stages of research. In our research, TQMP is reliable (Table 3) since it reaches 0.967. To assess convergent validity we examine the average variance extracted (AVE) measure, which was created by Fornell and Larcker (1981). AVE values should be greater than 0.50. Consistent with this suggestion, the AVE measure for TQMP construct is 0.855 (Table 3).
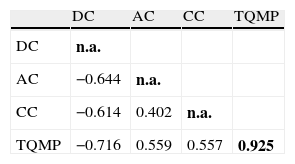
To assess discriminant validity AVE should be greater than the variance shared between the construct and other constructs in the model (i.e., the squared correlation between two constructs). For adequate discriminant validity, the diagonal elements should be significantly greater than the off-diagonal elements in the corresponding rows and columns (Roldán & Sánchez-Franco, 2012). This condition is satisfied for TQMP in relation to the rest of the variables (Table 4). For the variables with formative indicators, i.e., DC, AC, CC variables, we cannot analyse their situation because of the non-availability of AVE values.
Discriminant validity.
| DC | AC | CC | TQMP | |
| DC | n.a. | |||
| AC | −0.644 | n.a. | ||
| CC | −0.614 | 0.402 | n.a. | |
| TQMP | −0.716 | 0.559 | 0.557 | 0.925 |
Diagonal elements (bold) are the square root of variance shared between the constructs and their measures (AVE). Off-diagonal elements are the correlations among constructs. For discriminant validity, the diagonal elements should be larger than the off-diagonal elements. n.a.: non-applicable.
The evaluation of the structural model is based on the algebraic sign, magnitude and significance of the structural path coefficients, the R2 values, and the Q2 (redundancy) test for predictive relevance (Roldán & Sánchez-Franco, 2012). Consistent with Chin (1998), bootstrapping (500 resamples) was used to generate standard errors and t-statistics. This allows us to assess the statistical significance of the path coefficients.
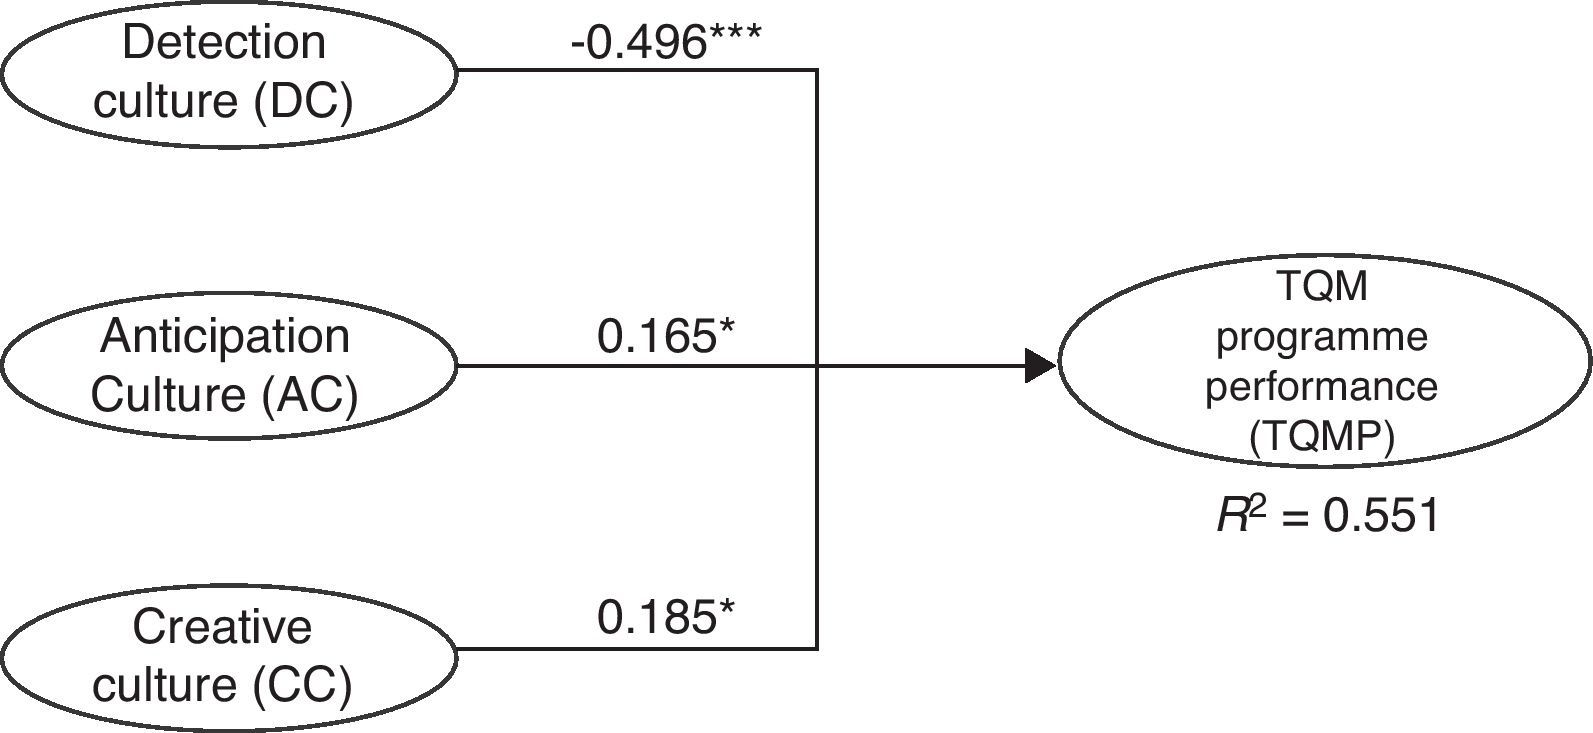
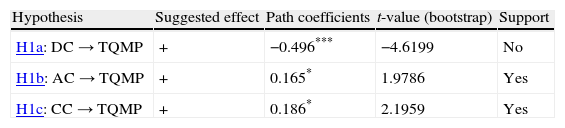
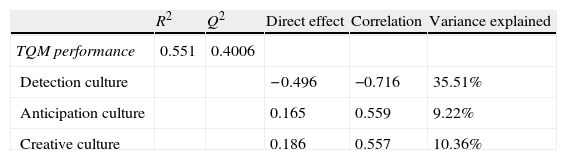
Two hypotheses have been supported (H1b, H1c) (Table 5, Fig. 2). However, the positive link proposed by H1a is not supported. Our study seems to show the presence of a strong and negative influence of the DC on TQMP. As well as this, both AC and CC exert a significant positive influence on the performance of the TQM programme (TQMP). On the other hand, the research model seems to have an adequate predictive power for the criterion variable. The explained variance of the TQM programme performance is 55.1%, achieving a level close to substantial according to Chin (1998) (Table 6). We also evaluate the model with the cross-validated redundancy index (Q2) for the endogenous variable (Roldán & Sánchez-Franco, 2012). Chin (2010) suggests this measure to examine the predictive relevance of the theoretical/structural model. A Q2 greater than 0 implies that the model has predictive relevance. Our results (Table 6) confirm that the structural model has satisfactory predictive relevance for the TQM programme performance variable (Q2=0.4006).
Structural model.
| Hypothesis | Suggested effect | Path coefficients | t-value (bootstrap) | Support |
| H1a: DC→TQMP | + | −0.496*** | −4.6199 | No |
| H1b: AC→TQMP | + | 0.165* | 1.9786 | Yes |
| H1c: CC→TQMP | + | 0.186* | 2.1959 | Yes |
*p < 0.05; **p < 0.01; ***p < 0.001 (based on t(499), two-tailed test); t(0.05; 499) = 1.964726835; t(0.01; 499) = 2.585711627; t (0.001; 499) = 3.310124157.
, two-tailed test).")
The aim of this paper was to test Cameron's framework, explaining types of quality cultures and their interactions to TQM programme performance. The results are consistent with the Resources-based view (complementary resources), and suggest that, rather than merely adopting or imitating less advanced cultures (DC), organisations should focus their efforts on generating a more advanced culture (e.g., creative culture). Furthermore, these recommend the organisations to focus on both exceeding the performance of expected standards, and to emphasise surprising and delighting customers.
Contrary to our initial expectations, the empirical results of this study seem to indicate that the DC negatively influences the TQMP, explaining more than 35% of the criterion variance (Table 6). On the other hand, both AC and CC show significant links with the TQMP, offering a variance explanation of 9.22% and 10.36% respectively of the dependent variable (Table 6).
Several conclusions and implications can be sustained: First, only a few organisations have developed a quality culture at the level of creative culture (11.6%). This supports the findings of previous works carried out by Cameron and Sine (1999). Second, consistent with Bair, Jia Hu, and Reeve (2011) findings, the more advanced quality cultures (AC and CC) are more related to the level of TQM programme performance than less advanced cultures (DC), the latter presenting a negative influence of the culture archetype. Third, the organisation's top management should assume an important role in promoting advanced quality cultures at all organisational levels, and lead change processes for both human resources and strategies, internalising the creative culture values: an emphasis on organisational learning, quality assurance, active use of teamwork, and customer data use to anticipate competitors in the new customer's preferences creation.
There are various limitations to the study that warrant mention. The first relates to organisation bias. It seems likely that organisations that are unhappy with their TQM system would be less inclined to participate in this study. Hence, the sample includes a larger proportion of “good” systems than is the case in the population. Second, while evidence of causality was provided, causality itself was not proven. Third, the research relied mainly on perceptions and a single method to elicit those perceptions. Finally, the study was carried out in a particular geographical context (Spain). We must therefore be cautious about generalising the results to other contexts.
