


To adapt and validate the Leiden Index of Depression Sensitivity-Revised for evaluating cognitive reactivity to depressive mood to Spanish and validate this Spanish version. To find the scale's factor structure and psychometric properties. The sample consisted of 600 participants (103 patients and 497 subjects from the general population). A four-factor structure was found, a general factor evaluating cognitive reactivity was proposed and ten items were eliminated. A brief version of the (LEIDS-R24) scale is proposed. The factors and the overall scale have adequate internal consistency, and the results of validation show that all the factors on the scale predict depressive symptomatology (BDI-II) adequately, and are highly correlated with the Dysfunctional Attitudes Scale and BDI-II scales. The complete scale adequately discriminated depressive symptomatology in general population subjects and patients with anxiety and depressive disorders. No significant differences were found in the LEIDS-R24 measurement between subjects with anxiety and depressive disorder. The LEIDS-R24 scale may be a useful brief measure for evaluating cognitive reactivity to depressive mood and analyzing the vulnerability which could be common to persons with anxiety and depressive disorders.
Adaptar y validar al español la escala Leiden de Sensibilidad para la Depresión Revisada para evaluar la reactividad cognitiva al humor depresivo. Conocer la estructura factorial de la escala y hallar las propiedades psicométricas. La muestra consistió en 600 participantes (103 pacientes y 497 sujetos de población general). Se obtuvo una estructura de cuatro factores, se propuso un factor general que evalúa la reactividad cognitiva y se eliminaron 10 ítems. Se propone una versión reducida de la escala (LEIDS-R24). Los factores y la escala global presentan una adecuada consistencia interna y los resultados de la validación muestran que todos los factores de la escala predicen adecuadamente la sintomatología depresiva (BDI-II) y muestran correlaciones elevadas con la Escala de Actitudes Disfuncionales y BDI-II. La escala completa discriminó adecuadamente en sintomatología depresiva entre sujetos de la población general y sujetos con trastornos de ansiedad y depresivos. No se hallaron diferencias significativas en la medida LEIDS-R24 entre sujetos con trastornos de ansiedad y depresivos. La escala LEIDS-R24 puede ser una medida útil y breve para evaluar la reactividad cognitiva al humor depresivo y analizar la vulnerabilidad común que puede darse entre personas con trastornos de ansiedad y depresivos.
Cognitive vulnerability to depression is considered an important factor in the etiology of depressive disorders and comprises cognitive processes such as negative cognitive styles, dysfunctional attitudes, rumination and cognitive reactivity (Ingram, Atchley, & Segal, 2011). Beck's cognitive model (Beck, 1967) argues that vulnerability to depression is marked by schemas or dysfunctional attitudes. These rigid and excessive beliefs are based on childhood experiences, configuring rules by which the person gives meaning to his/her surroundings. They remain latent until activated by negative or stressful events which lead to errors in information processing, favoring appearance of negative thoughts about oneself, the world and the future. Teasdale's (1988) differential activation hypothesis emerged from the Beck (1967) model to explain depressive relapse from reactivation of negative schemas in a light episode of sad mood in individuals who have previously suffered from depression. This facility with which dysfunctional attitudes are activated in stressful situations or light dysphoria is called “cognitive reactivity” (CR) and not only has its relationship with relapse and recurrence been demonstrated (Jarrett et al., 2012; Segal, Gemar, & Williams, 1999), but also its ability to predict start of a depressive episode (Elgersma et al., 2015; Kërqeli, Kelpi, & Tsigilis, 2013; Kruijt et al., 2013). CR has traditionally been evaluated using the change in scores on the Dysfunctional Attitudes Scale (DAS, Weissman & Beck, 1978) before and after being subjected to a negative mood induction task (Segal et al., 1999). The latent nature of dysfunctional schemas poses a difficulty for its evaluation when the person is not activated by a negative mood and the induction procedure has not had systematically consistent results (Van der Does, 2005). Some studies using the DAS scale have not found any differences in dysfunctional attitudes between subjects recovered from depression and those not depressed after an negative mood induction task (Brosse, Craighead, & Craighead, 1999; Van der Does, 2005). Other studies could predict a depressive relapse from the high scores on dysfunctional attitudes (Jarrett et al., 2012; van Rijsbergen et al., 2013), but not all (Figueroa et al., 2015). Van der Does (2005) concluded that the problem of inconsistency in the results stemmed from the instrument itself.
Van der Does (2002) designed the Leiden Index of Depression Sensitivity (LEIDS) to measure CR without the use of negative mood induction. This scale had 26 items and four factors (Negative Self-Evaluation, Acceptance/Coping, Indifference and Harm Avoidance). After unpublished factor analysis, the number of items on the original version was extended and the current LEIDS-R now has six factors instead of four (Van der Does & Williams, 2003; see note: http://www.dousa.nl/downloads/noteLEIDSrevision.pdf, Van der Does, 2003). The items on the scale are constructed such that they incite the person to imagine how they think in a situation marked by sad or dysphoric mood. For example: “When I feel sad, I more often think that I can make no one happy”. The LEIDS-R scale has demonstrated its relationship with biological markers of vulnerability to depression (Kruijt et al., 2013) and it seems to be a more consistent alternative than the DAS scale or the negative mood induction procedure for measuring CR (Figueroa et al., 2015). Furthermore, it has solid reliability and validity indicators, and can be a useful measure both in research and clinical settings (Solis, Antypa, Conijn, Kelderman, & Van Der Does, 2016).
The LEIDS and LEIDS-R scales differentiate currently recovered patients with a history of depressive episode from those who had never been depressed (Elgersma et al., 2015; Figueroa et al., 2015; Merens, Booij, & Van Der Does, 2008; Van der Does, 2002, 2005), as well as patients with different degrees of depression (Batmaz, Kocbiyik, & Yuncu, 2016). High scores on the LEIDS-R have shown its predictive power for depressive episode in individuals without a history of depression and also those with antecedent depressive episode (Figueroa et al., 2015; Kruijt et al., 2013; Struijs, Groenewold, Oude Voshaar, & de Jonge, 2013). CR evaluated with the LEIDS-R scale has also been studied as an indicator of the efficacy of psychological treatment, as CR has been found to decrease after Mindfulness intervention (Schoorl, Mil-Klinkenberg, & Does, 2015).
In view of its clinical usefulness and consistent results the scale has demonstrated, our goals were: a) To adapt the Leiden Index of Depression Sensitivity-Revised (LEIDS- R) to Spanish, b) To examine the factor structure of the LEIDS-R, c) To find reliability and validity indicators, d) To find out which scale (DAS or LEIDS-R) predicts depressive symptomology better, and e) To see whether the scale discriminates depressive symptomology in the general population with low and high CR from patients with anxiety and depressive disorders.
MethodParticipantsThe sample was comprised of 600 participants (103 patients and 497 subjects from the general population (GP): university students from the general population and non-university general population, 63.3%). All the patients from a private clinical psychology center recruited over a period of one year participated. 70.9% of the group were women aged 18 to 71 (M= 32.66 years; SD= 13.30). The average Hollingshead (1975) Social Class Index (SCI) was 33.68 (SD= 20.28), middle social class (ranges: 11-17, SCI very high; 18-27, SCI high; 28-43, SCI medium; 44-60, ICS low; 61-77, SCI very low). The university student GP was recruited by intentional sampling and the non-university GP group by snowball sampling. Subjects who expressly stated they had some psychopathology at the time of evaluation or were taking medication (n= 63 participants) were eliminated from the GP sample. The GP group (n=497) was 73% women aged 18 to 71 (M= 24.52 years; SD= 9.56). Their average SCI was 38.68 (SD= 18.50) middle social class.
The diagnoses of the participating patients were made by specialized professionals with over 20 years of clinical experience following DSM-IV-TR criteria in a clinical interview. All the patients were diagnosed and evaluated at the time they requested psychological help and were under medication. Patient diagnoses were the following, by general category: Depressive disorders (n= 24), adjustment disorders (n= 14), personality disorders (n= 9), anxiety disorders (n= 30), schizophrenia and other psychotic disorders (n= 7), eating disorders (n= 5), bipolar disorders (n= 4), somatoform disorders (n= 7).
Instruments- •
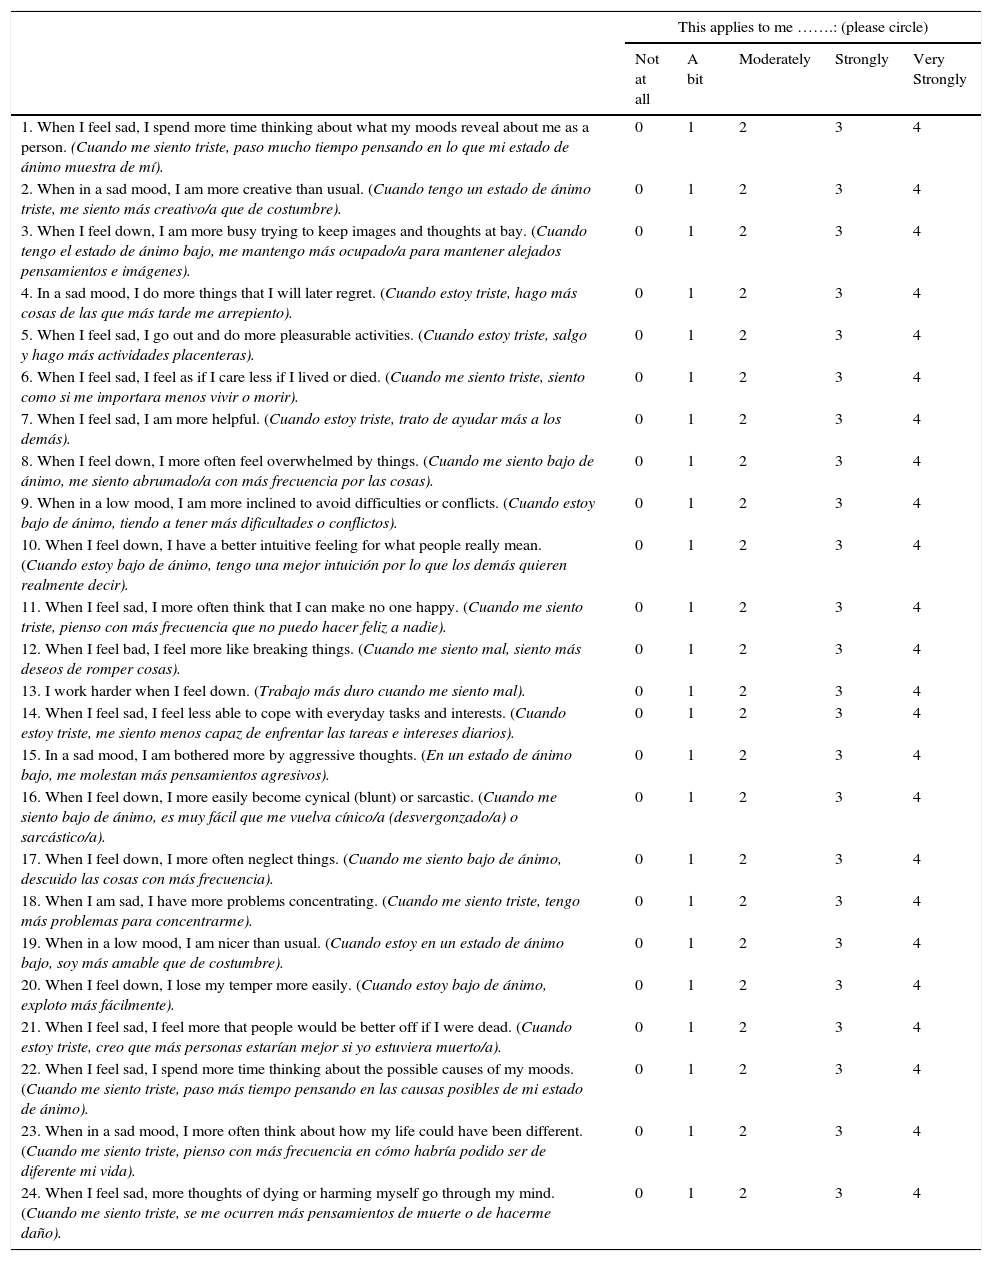
Leiden Index of Depression Sensitivity-Revised (LEIDS-R; Van der Does & Williams, 2003). This is a self-report on cognitive reactivity comprised of 34 items with six subscales. Hopelessness/suicidality (5 items): Reflects hopelessness, loss of interest in life and death wish (“When I feel sad, I more often think that I can make no one happy”); Acceptance/Coping (5 items): Coping with the depressed mood (“When I feel sad, I am more helpful”); Aggression (6 items): Manifestation of cognitive and behavioral aggressiveness (“When I feel bad, I feel more like breaking things); Control/Perfectionism (6 items): Need for control and perfection when the person feels in a sad mood (“When in a sad mood, I become more bothered by perfectionism”); Risk Aversion (6 items): Tendency to avoid difficulties or conflicts (“When in a low mood, I take fewer risk”) and Rumination (6 items): Repetitive thinking and worrying about low mood (“When I am sad, I have more problems concentrating”). The items are scored on a Likert-type scale from 0 (not at all) to 4 (very strongly). Solis et al. (2016) found that the Perfectionism/Control, avoidant coping (combination of risk aversion and rumination) and Hopelessness/Suicidality subscales are representative of CR. A higher total score on all the subscales except Acceptance/Coping shows higher CR.
- •
First self-reported evaluation (by authors). Identifies the social class index (SCI), a formula consisting of weighting employment category by seven and adding it to level of education weighted by four (Hollingshead, 1975), current illnesses, psychopathological background, history and duration of symptoms, psychopharmacological treatments and use of other drugs.
- •
Beck Depression Inventory (BDI-II; Beck, Steer, & Brown, 1996; adaptation to Spanish by Sanz, García-Vera, Espinosa, Fortún, & Vázquez, 2005; Sanz, Perdigón, & Vázquez, 2003). This is comprised of 21 items with four response choices (from 0 to 3 points) which evaluate the intensity of the depressive symptomatology. The Spanish adaptation of the scale shows α= .87 in GP (Sanz et al., 2003) and α= .89 in clinical population (Sanz et al., 2005). In this study it had a Cronbach's α=.89.
- •
Dysfunctional Attitudes Scale (DAS; Weissman & Beck, 1978; version by Sanz-Fernández & Vázquez-Valverde, 1993). This scale has 40 items related to attitudes or beliefs common to depressive states. The response format is a Likert-type scale of 0 to 7 points. It is made up of a total score and three factors: Achievement, Dependency and autonomous dysfunctional attitudes (α=79, α=72, α=39, respectively in Spanish population (Sanz Fernández & Vázquez Valverde, 1994)). In this study it had a Cronbach's α=87 (Achievement), α=79 (Dependency), α=44 (Autonomous dysfunctional attitudes) for the group of patients and Cronbach's α=.80, α=.71, α=.45, respectively for the GP.
The LEIDS-R scale was adapted and translated to Spanish by two clinical experts in psychopathology following the reverse translation method, the instructions of the International Test Commission (Muñiz, Elosua, & Hambleton, 2013) and the recommendations of Carretero-Dios and Pérez (2007). The translated version was reviewed by a bilingual expert and compared to the version that the author of the scale has available on his website (http://www.dousa.nl/LEIDS%20spanish.pdf, Van Der Does, n.d.), adapting it to Spanish usage in Spain. All the participants were informed of the purposes of the study and those who gave their written consent for participating in the study were administered the instruments. GP participants who were university students filled in the tests in a classroom at the School of Psychology and non-university participants filled them out at their homes with the supervision of a postgraduate student with a degree in psychology. The patients were given the instruments at the first or second session of therapy for them to fill out there or at home afterwards. The Clinical Research Ethics Committee of Cádiz (University Hospital Puerta del Mar) approved the research. The principles of the World Medical Association (Declaration of Helsinki) were guaranteed.
Data analysisA frequency analysis of LEIDS-R item responses was done and skewness and kurtosis were calculated (separating patients from GP). Internal consistency of the complete LEIDS-R and the six factors was evaluated. Descriptive statistics of the sociodemographic variables were calculated and means of participants in the two groups formed at random were compared for cross validation of the instrument.
The Exploratory Factor Analysis (EFA) was done with the first half of the sample using Unweighted Least Squares (ULS) and Direct Oblimin rotation, the number of factors was decided considering parallel analysis and eigenvalue. Multivariate normality was checked by the Mardia test. The ordinal alpha was calculated from the polychoric correlations matrix. Several Confirmatory Factor Analysis (CFA) were done with the second half of the sample to test different hypothetical models by Maximum Likelihood (ML, recommended when the variables do not deviate too much from normality, Kline, 2011). Chi squared, the Comparative Fit Index (CFI), Tucker–Lewis Index (TLI), Goodness of Fit Index (GFI), root mean square error of approximation (RMSEA) and its 90% confidence interval, and the Akaike Information Criterion (AIC) were used to test the overall fit of the models.
For validity of the structural content found in the EFA and CFA, 12 clinical psychologists were contacted and they evaluated the adequacy of each item with its respective construct on a Likert-type scale of 0 to 5 points. With the scores of each judge, the Aiken V (Aiken, 1985) content validity index was calculated for each item.
The reliability and validity psychometric properties of the resulting factors were analyzed. For convergent validity, bivariate Spearman Correlation analyses were conducted. Stepwise multiple regression analysis was performed taking the factors from the CFA (LEIDS-R24, Appendix 1) and DAS subscales on the total BDI-II score to verify predictive validity. Then the subjects from the GP with extreme scores on the total LEIDS-R24 scale (≥90th percentile and ≤ 10th percentile) and the patients with anxiety and depressive disorders were selected. A one-way ANOVA was done between these subjects on the BDI-II and post hoc Dunnet C. An ANOVA was done between subjects with anxiety and depressive disorders on the LEIDS-R24. Partial eta-squared was calculated as the measure of effect size. Finally, the ROC curve was calculated for LEIDS-R24 sensitivity and specificity.
Statistical analyses were done with the SPSS, AMOS v. 22 and FACTOR v. 10.03.1 programs.
ResultsDescriptive analyses of the items on the LEIDS-R scale and psychometric propertiesLess than 15% of the patients (n= 103) answered choices 3 or 4 (strong and very strong) on a total of four items (8, 19, 26, 28), and in the GP (n=497) on a total of 13 items (4, 7, 9, 10, 12, 19, 24, 26, 28, 30, 31, 34) fewer than 15% selected choices 3 and 4. Skewness varied from -1.26 to 1.69 in the group of patients, and from -0.54 to 2.87 in the GP, and kurtosis varied from -1.25 to 1.82 in the group of patients, and from -1.14 to 8.04 in the GP. Item 26 of the aggression factor showed the most skewness and Kurtosis in patients, and Items 30 and 34 of the hopelessness factor showed the most skewness and kurtosis in the GP.
The items-total correlations with their respective subscales were over .40. The Cronbach's alpha was=.90 for the general scale and for the six factors: α= .79 (Rumination), α= .81 (Hopelessness/suicidality), α= .66 (Acceptance/coping), α= .71 (Aggression/hostility), α= .56 (Control/perfectionism), α= .56 (Risk aversion).
Descriptive analyses of the two random groupsThe sample was divided at random into two halves for cross validation of the instrument (Half 1 =249 GP participants and 51 patients, Half 2=248 GP participants and 52 patients). Both groups were equivalent in gender (χ2(1, 600)= 0.34, p= .86), marital status (χ2(3, 600)= 3.15, p= .368) and age (t(598)= 0.93, p= .351), but not ICS (t(598)=4.01, p< .001). The patients in both groups were equivalent in clinical diagnosis (χ2(8, 103)=5.19, p=.89).
Mean scores on the LEIDS-R subscales in two groups formed at random were compared. There were no statistically significant differences between the groups on the LEIDS-R total score or on the factors, except in perfectionism/control (Table 1).
Comparison of means between Samples 1 and 2 over total LEIDS-R score and its factors.
| M (SD) Half 1 | M (SD) Half 2 | t | df | p | |
|---|---|---|---|---|---|
| Rumination | 76.66 | 79.50 | −1.16 | 598 | .245 |
| Hopelessness/suicidality | 27.35 | 28.67 | −0.72 | 598 | .477 |
| Acceptance/coping | 22.24 | 23.53 | −0.78 | 598 | .431 |
| Aggression/hostility | 45.06 | 48.82 | −1.65 | 598 | .099 |
| Control/perfectionism | 46.28 | 50.38 | −2.09 | 598 | .036 |
| Risk aversion | 69.76 | 73.02 | −1.69 | 598 | .092 |
| Total LEIDS-R | 49.58 | 52.39 | −1.80 | 598 | .072 |
An EFA was performed with the first half of the sample (n=300). Mardia's test yielded a value of 29.21. Parallel analysis and eigenvalue recommended a four-factor solution. The result showed adequate values for the KMO (KMO= .91) and Barlett sphericity (χ2 (378, 300)=3420.03, p<.001) tests. Items 1, 2, 11, 12, 16 and 31 were eliminated from the analysis because they had communalities below .30. This solution explained 58% of the variance. The factors are similar to those found by Van der Does and Williams (2003), so they have the same names as in the original version of the scale with some differences as discussed below.
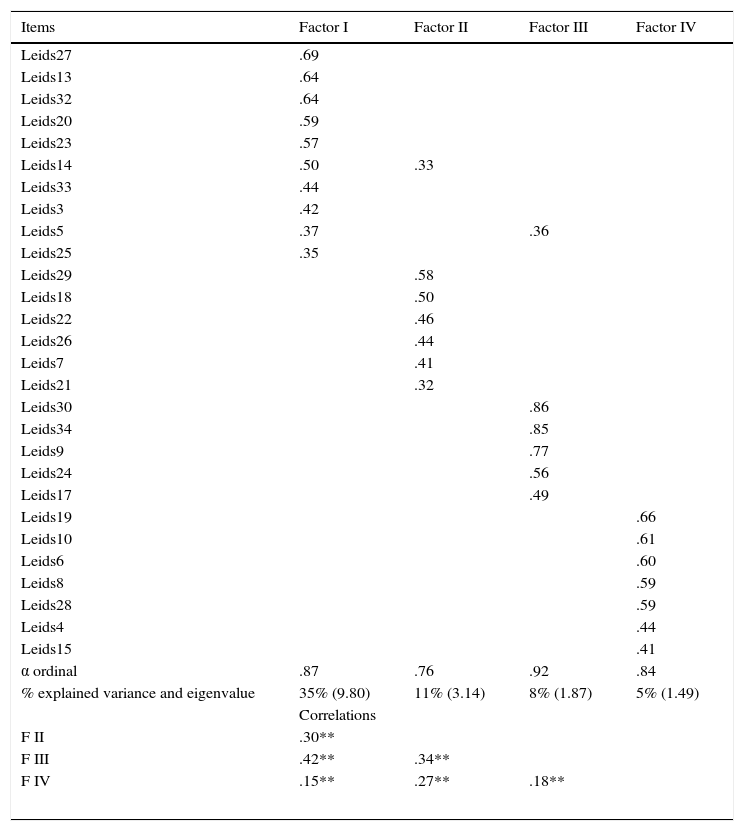
Table 2 shows the factorial solution found. The first factor explained the highest percentage of variance corresponding largely to the original Rumination factor, except for Items 14 and 23 which pertained to the risk aversion factor and Item 3 on the control/perfectionism subscale. All the items in the original Aggression factor group together in the second factor. The third factor groups the same items as the Hopelessness factor and includes Item 24. The fourth factor groups some items from the Acceptance, Control and Risk aversion factors. The correlations between factors vary from r= .42 to r= .16.
Exploratory Factorial Analysis Structure matrix.
| Items | Factor I | Factor II | Factor III | Factor IV |
|---|---|---|---|---|
| Leids27 | .69 | |||
| Leids13 | .64 | |||
| Leids32 | .64 | |||
| Leids20 | .59 | |||
| Leids23 | .57 | |||
| Leids14 | .50 | .33 | ||
| Leids33 | .44 | |||
| Leids3 | .42 | |||
| Leids5 | .37 | .36 | ||
| Leids25 | .35 | |||
| Leids29 | .58 | |||
| Leids18 | .50 | |||
| Leids22 | .46 | |||
| Leids26 | .44 | |||
| Leids7 | .41 | |||
| Leids21 | .32 | |||
| Leids30 | .86 | |||
| Leids34 | .85 | |||
| Leids9 | .77 | |||
| Leids24 | .56 | |||
| Leids17 | .49 | |||
| Leids19 | .66 | |||
| Leids10 | .61 | |||
| Leids6 | .60 | |||
| Leids8 | .59 | |||
| Leids28 | .59 | |||
| Leids4 | .44 | |||
| Leids15 | .41 | |||
| α ordinal | .87 | .76 | .92 | .84 |
| % explained variance and eigenvalue | 35% (9.80) | 11% (3.14) | 8% (1.87) | 5% (1.49) |
| Correlations | ||||
| F II | .30** | |||
| F III | .42** | .34** | ||
| F IV | .15** | .27** | .18** | |
Note. Loadings<30 were omitted.
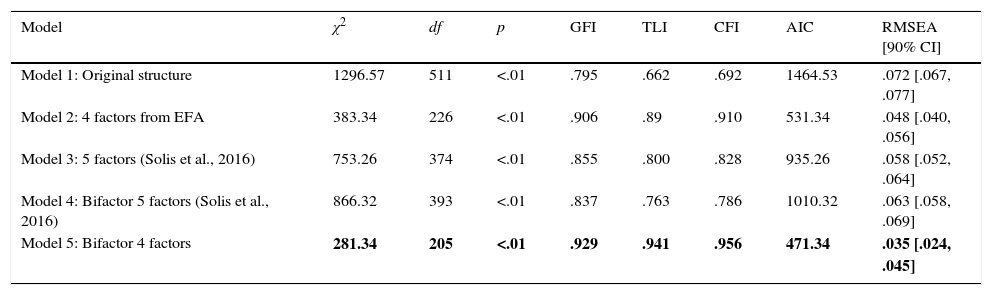
The CFA (ML method) were performed with the second half of the sample (n=300). Five models were tested, starting out with the original structure proposed by Van der Does and Williams (2003) (Model 1). Model 2 tested the EFA structure. The factor structure by Solis et al. (2016) was tested (Model 3) and the bifactor model which these authors proposed (one general factor and five specific factors, Model 4) and finally, a bifactor model similar to that one, but with the four factors from our EFA (Model 5).
The fit indicators for Model 1 were not good enough (Table 3). In some cases the factor loadings between the items and their latent variables were low, basically on the Risk aversion factors (factor loading=.11 and .29 for Items 6 and 2, respectively), and Control/perfectionism (factor loading=.16 for Item 8). Very high correlations were found between some factors, showing a multicollinearity problem. For example: Acceptance and Control/perfectionism r= .85, Aggression and Risk aversion r= .84; Control/perfectionism and Risk aversion r= .88; Rumination and Risk aversion r= .92. The remaining correlations between factors varied from .42 (Hopelessness and Acceptance) to .76 (Hopelessness and Risk aversion).
Fit indices of models analyzed by Confirmatory Factor Analysis.
| Model | χ2 | df | p | GFI | TLI | CFI | AIC | RMSEA [90% CI] |
|---|---|---|---|---|---|---|---|---|
| Model 1: Original structure | 1296.57 | 511 | <.01 | .795 | .662 | .692 | 1464.53 | .072 [.067, .077] |
| Model 2: 4 factors from EFA | 383.34 | 226 | <.01 | .906 | .89 | .910 | 531.34 | .048 [.040, .056] |
| Model 3: 5 factors (Solis et al., 2016) | 753.26 | 374 | <.01 | .855 | .800 | .828 | 935.26 | .058 [.052, .064] |
| Model 4: Bifactor 5 factors (Solis et al., 2016) | 866.32 | 393 | <.01 | .837 | .763 | .786 | 1010.32 | .063 [.058, .069] |
| Model 5: Bifactor 4 factors | 281.34 | 205 | <.01 | .929 | .941 | .956 | 471.34 | .035 [.024, .045] |
Model 2 resulted from the EFA with the following changes suggested by the modification indices: Item 14 was put in the Aggression factor, Items 5 and 26 were eliminated from the analysis because they had very high standardized residuals, and Item 24 because the factor loading was very low (.28). Finally, Item 23 was eliminated because it did not fit the theoretical content of the factor as recommended by the expert judges consulted. The goodness-of-fit indices of this model were adequate. The five-factor model by Solis et al. (2016) did not have adequate fit indices (Model 3) nor did the bifactor model they proposed (Model 4). Finally, a model which had the four specific factors from the modifications made from the EFA itself and a general factor that represented CR (Model 5) was tested. This model had the best fit indicators, and, AIC, CFI and RMSEA suggest that it is the best one analyzed (see Table 3). The chi-square difference tests show that Model 5 was better than Model 1, Δχ2 (306)=1015.16, p<.001; Model 2, Δχ2 (21)=102, p<.001; al Model 3, Δχ2 (169)=471.92, p<.001; and Model 4, Δχ2 (168) =584.98, p<.001.
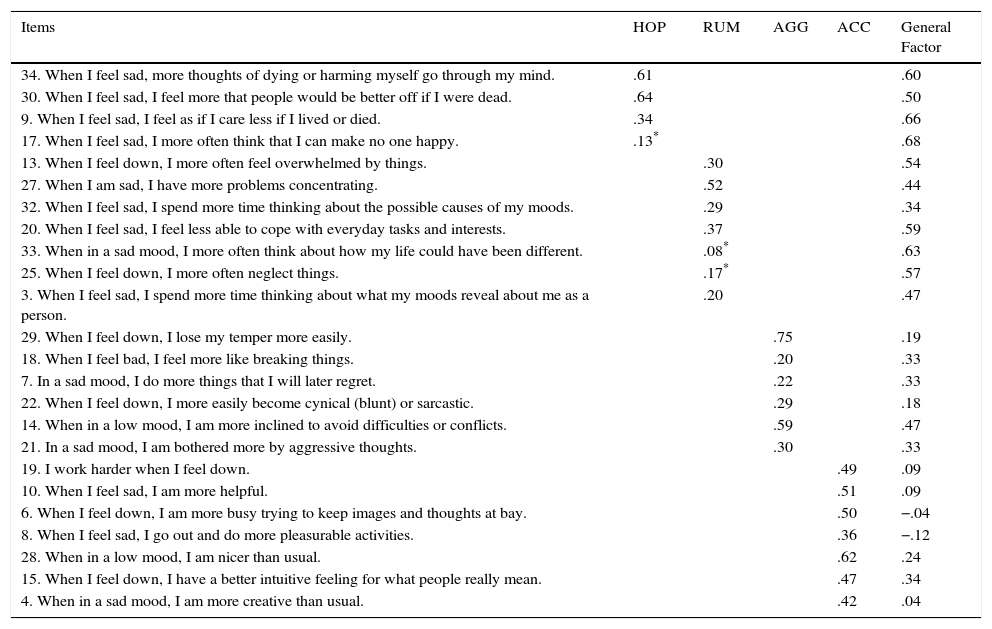
The items on the acceptance/coping subscale in the last model were observed to have very low factor loadings for the general factor, unlike the loadings for its specific factor. However, with the Hopelessness and Rumination subscales, the opposite occurred, with factor loadings higher on the general factor than on the corresponding specific factor. The factor loadings for the Aggression subscale were distributed similarly between the general and the specific factor. The results of the final 24-item model (after eliminating items 24, 23, 31, 11, 12, 16, 1, 2, 5, 26) are shown in Table 4.
Standardized factor loadings of bifactor model with four specific factors from confirmatory factor analysis.
| Items | HOP | RUM | AGG | ACC | General Factor |
|---|---|---|---|---|---|
| 34. When I feel sad, more thoughts of dying or harming myself go through my mind. | .61 | .60 | |||
| 30. When I feel sad, I feel more that people would be better off if I were dead. | .64 | .50 | |||
| 9. When I feel sad, I feel as if I care less if I lived or died. | .34 | .66 | |||
| 17. When I feel sad, I more often think that I can make no one happy. | .13* | .68 | |||
| 13. When I feel down, I more often feel overwhelmed by things. | .30 | .54 | |||
| 27. When I am sad, I have more problems concentrating. | .52 | .44 | |||
| 32. When I feel sad, I spend more time thinking about the possible causes of my moods. | .29 | .34 | |||
| 20. When I feel sad, I feel less able to cope with everyday tasks and interests. | .37 | .59 | |||
| 33. When in a sad mood, I more often think about how my life could have been different. | .08* | .63 | |||
| 25. When I feel down, I more often neglect things. | .17* | .57 | |||
| 3. When I feel sad, I spend more time thinking about what my moods reveal about me as a person. | .20 | .47 | |||
| 29. When I feel down, I lose my temper more easily. | .75 | .19 | |||
| 18. When I feel bad, I feel more like breaking things. | .20 | .33 | |||
| 7. In a sad mood, I do more things that I will later regret. | .22 | .33 | |||
| 22. When I feel down, I more easily become cynical (blunt) or sarcastic. | .29 | .18 | |||
| 14. When in a low mood, I am more inclined to avoid difficulties or conflicts. | .59 | .47 | |||
| 21. In a sad mood, I am bothered more by aggressive thoughts. | .30 | .33 | |||
| 19. I work harder when I feel down. | .49 | .09 | |||
| 10. When I feel sad, I am more helpful. | .51 | .09 | |||
| 6. When I feel down, I am more busy trying to keep images and thoughts at bay. | .50 | −.04 | |||
| 8. When I feel sad, I go out and do more pleasurable activities. | .36 | −.12 | |||
| 28. When in a low mood, I am nicer than usual. | .62 | .24 | |||
| 15. When I feel down, I have a better intuitive feeling for what people really mean. | .47 | .34 | |||
| 4. When in a sad mood, I am more creative than usual. | .42 | .04 |
Note. HOP: Hopelessness, RUM: Rumination, AGG: Aggression, ACC: Acceptance/Coping.
The LEIDS-R24 scale's structural content was judged by experts and the Aiken's V was found (n=12 clinical psychologists, average clinical experience=17.01 years, SD=10.51). The coefficients of items that saturated on a different factor from the structure proposed by Van der Does and Williams (2003) were valid according to the strictest criteria (V>.70, Charter, 2003): Vítem3= .85, Vítem14=.77, Vítem19=.73, Vítem6=.88 y Vítem8=.71.
The reliability, predictive and convergent validity analyses were performed with the total sample (N=600). The Cronbach's alpha for the overall 24-item scale was α= .87. The internal consistencies of four subscales were acceptable: Hopelessness (α= .82), Rumination (α= .80), Aggression (α= .73) and Acceptance (α= .71).
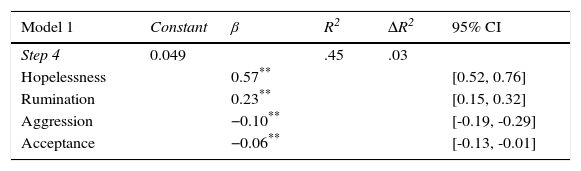
The predictive validity of the LEIDS-R24 scale was evaluated by three stepwise multiple regression analyses, taking as the dependent variable the total score on the BDI-II scale. The first analysis included the four factors from the LEIDS-R24 scale, the second included the dimensions from the DAS scale, and the factors from the DAS and LEIDS-R24 scales were entered in the third. The factor which best explained depressive symptomatology (BDI-II) was hopelessness (LEIDS-R24) with 42% of variance explained in both Model 1 and Model 3 (see Table 5).
Stepwise multiple regression analysis of the LEIDS-R24 and DAS scales factors on depressive symptoms (BDI-II).
| Model 1 | Constant | β | R2 | ΔR2 | 95% CI |
|---|---|---|---|---|---|
| Step 4 | 0.049 | .45 | .03 | ||
| Hopelessness | 0.57** | [0.52, 0.76] | |||
| Rumination | 0.23** | [0.15, 0.32] | |||
| Aggression | −0.10** | [-0.19, -0.29] | |||
| Acceptance | −0.06** | [-0.13, -0.01] |
Convergent validity was evaluated by Spearman's correlation. Correlations of all the factors extracted by CFA with the total DAS test and its subscales and with the BDI-II were positively statistically significant. The lowest correlations were between the acceptance factor and the BDI-II (r= .56), as well as between this factor and the three DAS scale factors (achievement r= .47, dependency r= .34, autonomous attitudes r= .38). The correlation between the BDI-II and the LEIDS-R24 was statistically significant (r= .49), as was the total DAS score and total LEIDS-R24 (r= .48).
Finally, subjects in the GP with a total score on the LEIDS-R24 above the 90th percentile (considered vulnerable n=36) and below the 10th percentile (not vulnerable n=36) were selected from the overall sample (N=600). Subjects with Depressive disorders (n=24) and Anxiety disorders (n=33) were selected from the clinical group. All the groups had equivalent sociodemographic variables (gender, age, SCI and marital status, p>.05). An ANOVA of the groups was done over the BDI-II. Statistically significant differences were found F(3,125)=43.25, p<.01, ¿2=.51. The Dunnet C test showed differences among the four groups for depressive symptomatology (Mnotvulnerable= 2.97, SD= 3.61; Mvulnerable= 12.11, SD= 8.26; Mdepressed=27.21, SD=11.97;Manxious= 23.27, SD=12.22).
To check LEIDS-R24 scale discriminability of the general depressive disorders and anxiety diagnoses, an ANOVA of both groups was done over the total score on the LEIDS-R24. The results did not show any statistically significant differences F(1, 56)= 0.045, p>.05, ¿2=01 (Mdepressed= 45.08, DT= 12.50; Manxious= 45.85, DT= 13.98). Finally, the sensitivity and specificity of the overall LEIDS-R24 scale were analyzed. The ROC curve showed a significant area of .80, 95% CI [.76-.83], showing sensitivity of 75% and specificity of 70% with a cutoff at 48 points.
DiscussionThis study found the psychometric properties of the LEIDS-R scale (Van der Does & Williams, 2003) in a Spanish population and presented a brief 24-item version. The structure is similar to the one found by the authors of the scale, but eliminating 10 items which showed low factor loadings, problems with standardized residuals or inadequate fit to the model. Two factors were eliminated because they showed problems of internal consistency: risk aversion and control/perfectionism. Therefore, the version presented has four factors (Rumination, Hopelessness, Aggression and Acceptance/coping) and a general factor which measures cognitive reactivity similar to what was found by Solis et al. (2016).
In the CFA, the Rumination and Hopelessness factors showed higher factor loadings on the general factor and lower on their specific factor, but the opposite was true for the Acceptance/coping factor. This result is very similar to what was found by Solis et al. (2016) who argued that the Acceptance factor is conceptually different from what the general factor measures. When the items that make up this dimension are read, it is observed that it is related to acceptance and positive coping with depressive symptoms, unlike the factors which make up the rest of the scale. In fact, Van der Does (2002) concluded that CR was predicted by a high score on negative self-assessment, harm avoidance and low acceptance. These results suggest that this factor might be evaluated separately, but on the same scale, since it provides much information on coping strategies adopted by the person who is depressed or in a state of dysphoria, and might be of great interest as a resource for clinical treatment and follow-up. The overall 24-item scale and four factors have acceptable internal consistency and adequate validity indicators (construct and concurrent.
The results of regression analysis showed that all the LEIDS-R24 subscales predicted depressive symptomatology and specifically, the hopelessness subscale was the one that explained the highest percentage of variance, higher than the DAS achievement and autonomy subscales. The LEIDS-R24 scale and its subscales showed high congruence with DAS and depressive symptoms, considered as convergent validity.
The LEIDS-R24 discriminated the selection of GP subjects analyzed by their scores (high and low, i.e. vulnerable and not vulnerable to depression) and patients with Anxiety and Depressive disorders for depressive symptomatology scores. This result shows that the LEIDS-R24 is a measure of cognitive vulnerability to depression, differentiable from the depressive symptomatology itself, although it cannot be used for diagnosis. Keeping in mind the results found by Kruijt et al. (2013), it might have been of interest to have done a follow-up of subjects with high CR and observe whether in fact at a later time, they had a depressive episode. In the future, this could be studied with the brief version proposed.
One of the disadvantages of the LEIDS-R24 is that it did not discriminate adequately between subjects with Anxiety and Depressive disorders. Although our sample of patients is small and hard to generalize, the results agree with those of Solis et al. (2016). The brief version of the LEIDS-R scale we propose highlights the existence of a vulnerability element common to emotional disorders with negative affect, as argued by Clark and Watson (1991) in their tripartite model. Barlow (2002) also demonstrated the existence of a vulnerability common to emotional disorders. He proposed general biological and psychological vulnerability for depressive disorders and generalized anxiety and specific psychological vulnerability for the rest of Anxiety disorders. Recently, the DSM-5 (American Psychiatric Association, APA, 2013) separated the diagnostic classes for depressive and anxiety disorders, but included the specifier “with anxious distress” (Rodríguez-Testal, Senín-Calderón, & Perona-Garcelán, 2014), which underlines that the two groups of disorders clearly have zones in common. From these common elements of vulnerability emerge new unified transdiagnostic treatment protocols for emotional disorders (Barlow et al., 2011) which are offering very promising results (Bullis, Fortune, Farchione, & Barlow, 2014). For psychological treatment, other researchers would have to corroborate whether CR is a vulnerability element common to Anxiety and Depressive disorders. Furthermore, in line with the results of Lopes, Gonçalves, Sinai, and Machado (2015), it would be of interest to study whether CR can predict patients exclusively with depressive disorders quitting therapy compared to those with anxiety and depression comorbidity.
This study has some limitations which should be born in mind. In the first place, it is a cross-study with no follow-up. Although the psychopathological histories of GP subjects were taken down, we cannot be sure whether anything was omitted from that information, since in a negative mood induction task there may be a bias in memory or have forgotten times when they may have had a transitory depressive manifestation (congruency hypothesis). It would have been interesting to have checked whether the CR of subjects in the GP who had previously suffered from some proven depressive episode was really higher than the subjects in the GP with no prior history of depression, and whether there were any differences from the subjects with depressive disorder. Apart from this, as the number of patients with depressive disorder was small, they could not be differentiated by the number of episodes they had had, or by the severity of their current episode.
In spite of its limitations, this study has several strong points. An alternative brief LEIDS-R scale was proposed which has similar factors and psychometric properties consistent in the Spanish population. The scale has a positive factor and does not concentrate attention entirely on vulnerability, and therefore, results in an interesting measure of presumably recoverable aspects of this vulnerability and improvement of coping. It would also help find out what aspects of vulnerability to depression are the most modifiable and which are not, whether improvements in coping contribute to change in the rest of the measure, and what forms of coping are the most beneficial in a treatment. Given its solidity, it could be related to physiological measures for a more comprehensive position on depression. As there is overlapping between anxiety and depression, the elements which are most common or different in them could be analyzed in line with the proposal Watson (2005) made for the DSM-5 which formulated combination of Anxiety and Depressive disorders in a category called Emotional disorders.
Measurement of CR using the LEIDS-R scale has demonstrated more solid results than those using the DAS scale for detecting cognitive vulnerability to depression in subjects with no antecedent depressive episode, preventing appearance of a depressive episode, predicting the recurrence of depression in subjects in remission, and detecting the severity of their depressive episode (Elgersma et al., 2015; Batmaz et al., 2016; Figueroa et al., 2015; Kruijt et al., 2013; Struijs et al., 2013). Moreover, we believe that a vulnerability scale may be a better strategy for constructing predictive models for depression than using depressive symptomatology scales (Richards et al., 2015). Therefore, the LEIDS-R scale is a proven measure which is clinically useful in the scope of prevention, intervention and measurement of therapeutic efficacy (Schoorl et al., 2015). Future studies should test whether the reduced version proposed here is as clinically useful as it was shown to be in this study.
Adapted from Van der Does and Williams (2003)
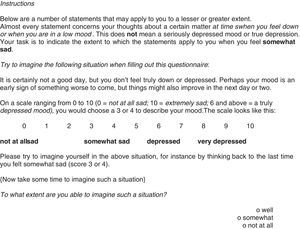
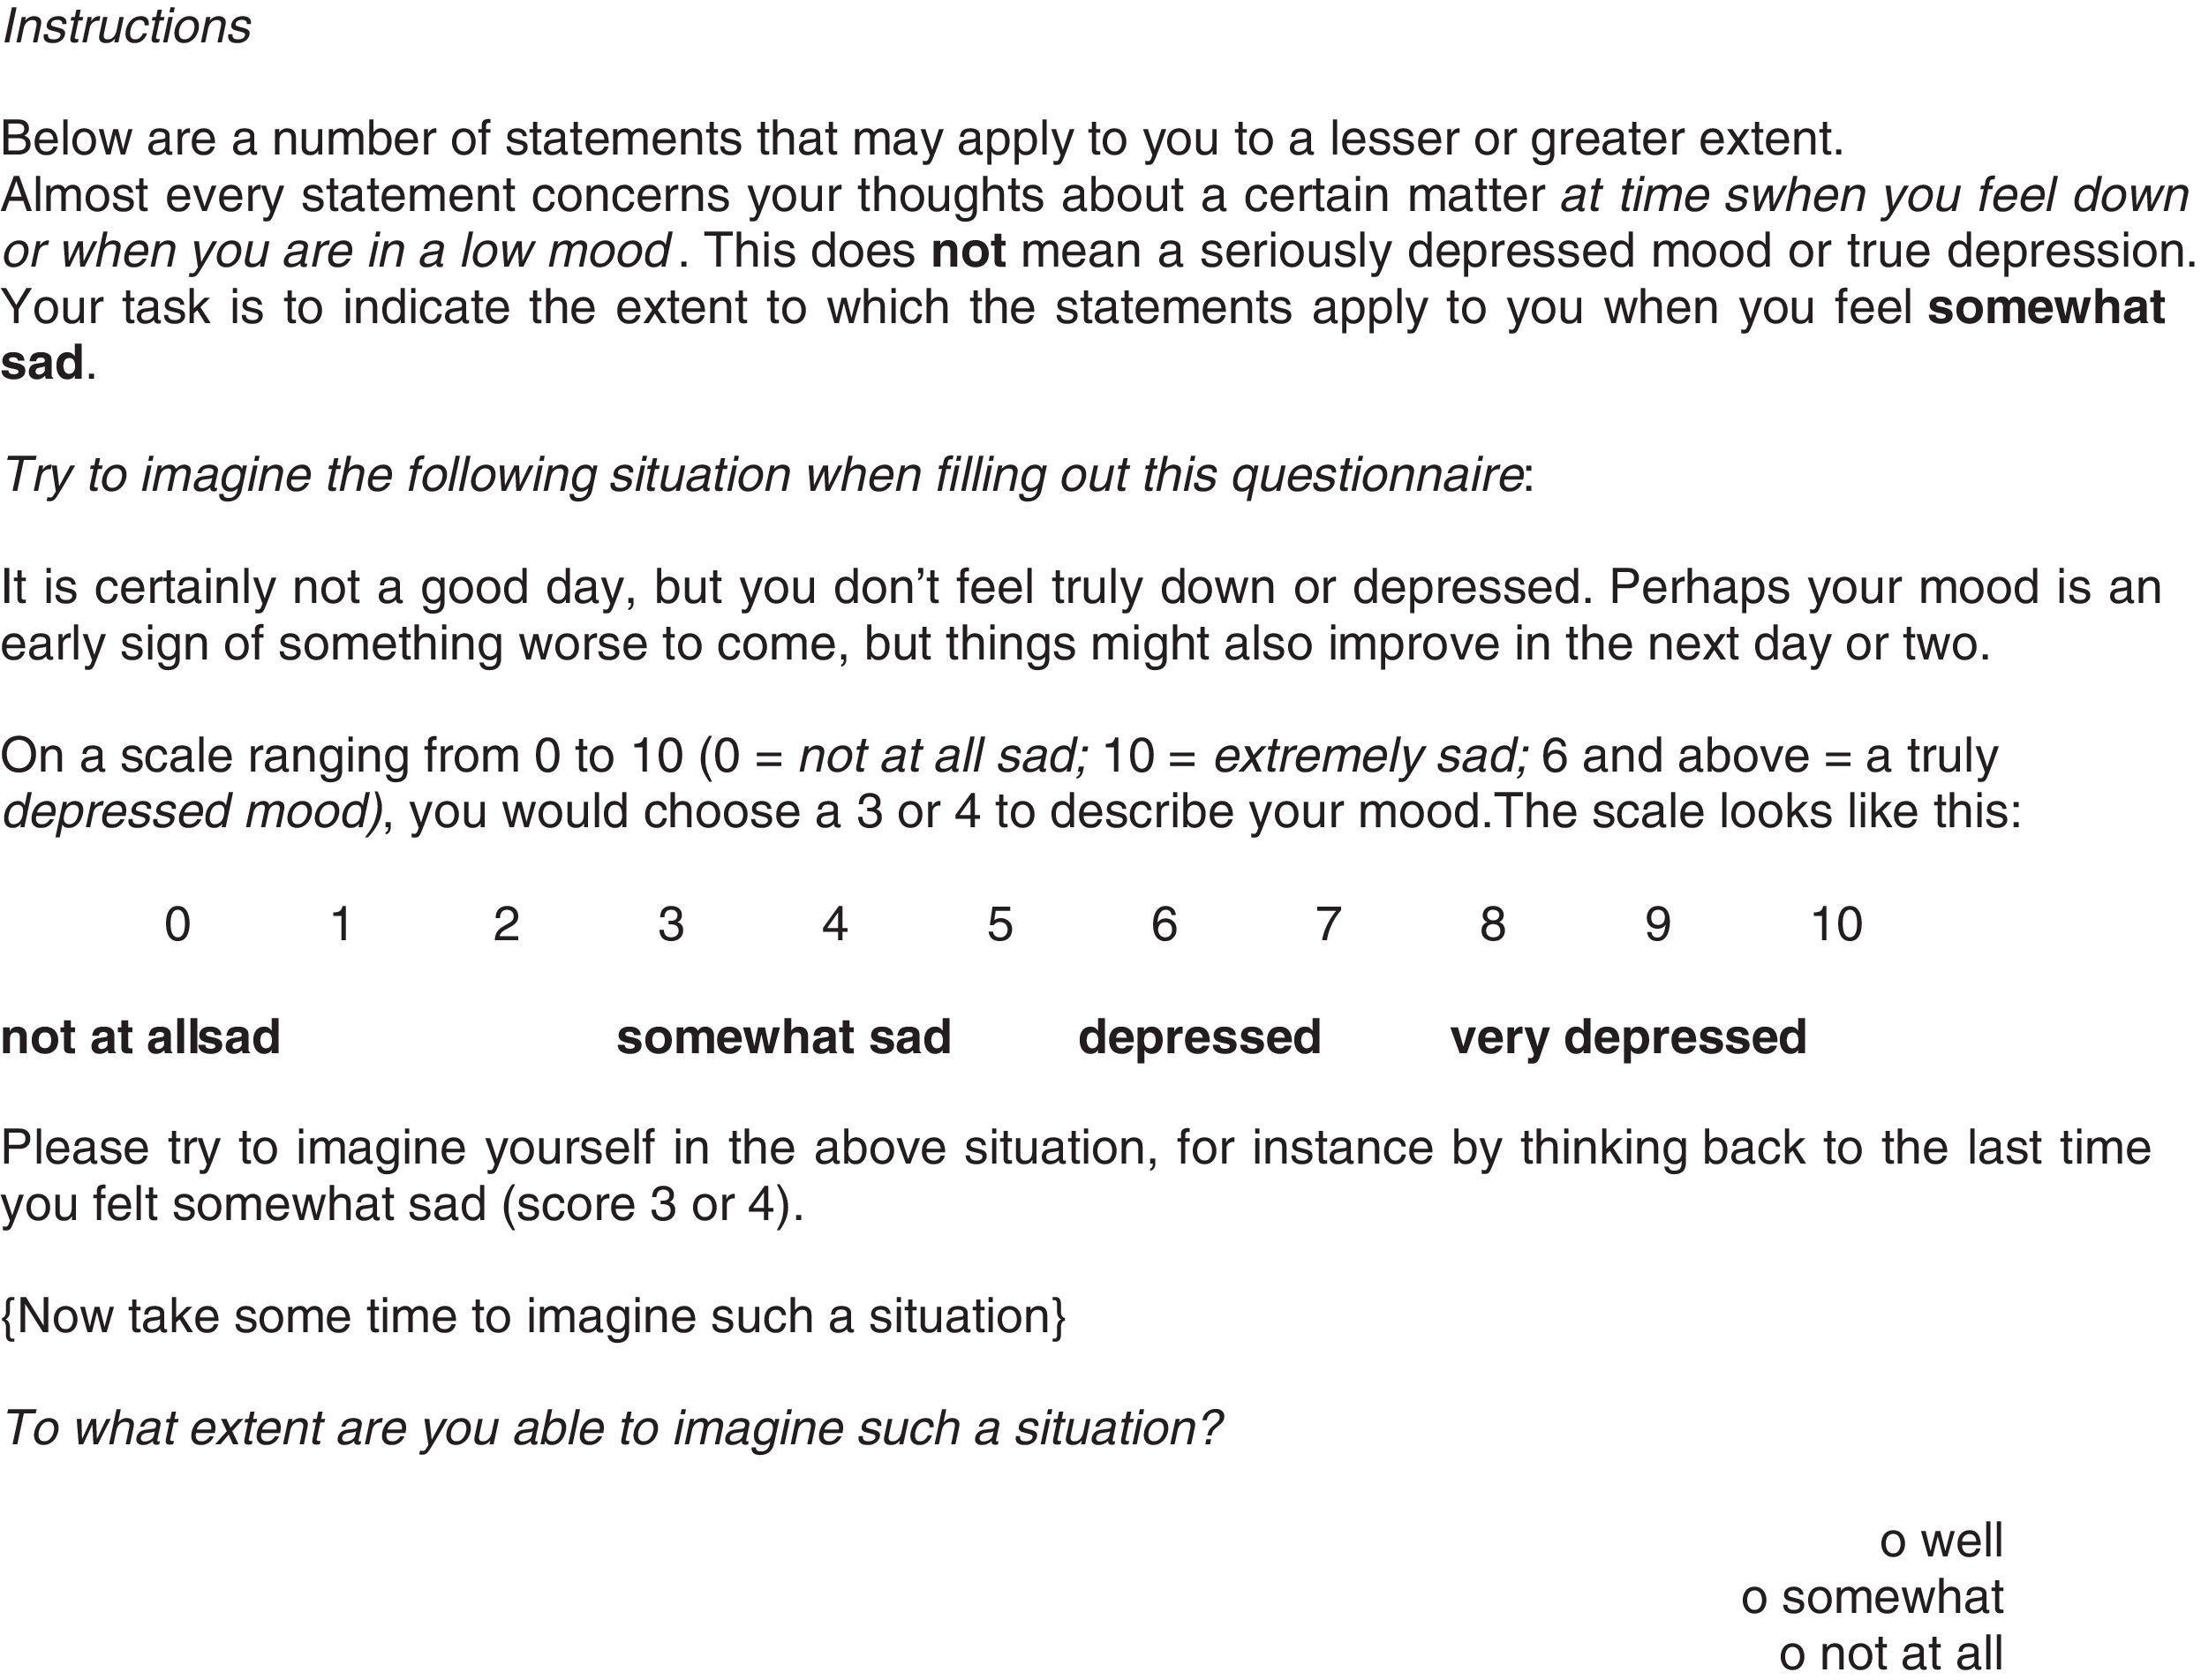
Now proceed to the next question (even if you find it difficult to imagine yourself in such a situation).
| This applies to me …….: (please circle) | |||||
|---|---|---|---|---|---|
| Not at all | A bit | Moderately | Strongly | Very Strongly | |
| 1. When I feel sad, I spend more time thinking about what my moods reveal about me as a person. (Cuando me siento triste, paso mucho tiempo pensando en lo que mi estado de ánimo muestra de mí). | 0 | 1 | 2 | 3 | 4 |
| 2. When in a sad mood, I am more creative than usual. (Cuando tengo un estado de ánimo triste, me siento más creativo/a que de costumbre). | 0 | 1 | 2 | 3 | 4 |
| 3. When I feel down, I am more busy trying to keep images and thoughts at bay. (Cuando tengo el estado de ánimo bajo, me mantengo más ocupado/a para mantener alejados pensamientos e imágenes). | 0 | 1 | 2 | 3 | 4 |
| 4. In a sad mood, I do more things that I will later regret. (Cuando estoy triste, hago más cosas de las que más tarde me arrepiento). | 0 | 1 | 2 | 3 | 4 |
| 5. When I feel sad, I go out and do more pleasurable activities. (Cuando estoy triste, salgo y hago más actividades placenteras). | 0 | 1 | 2 | 3 | 4 |
| 6. When I feel sad, I feel as if I care less if I lived or died. (Cuando me siento triste, siento como si me importara menos vivir o morir). | 0 | 1 | 2 | 3 | 4 |
| 7. When I feel sad, I am more helpful. (Cuando estoy triste, trato de ayudar más a los demás). | 0 | 1 | 2 | 3 | 4 |
| 8. When I feel down, I more often feel overwhelmed by things. (Cuando me siento bajo de ánimo, me siento abrumado/a con más frecuencia por las cosas). | 0 | 1 | 2 | 3 | 4 |
| 9. When in a low mood, I am more inclined to avoid difficulties or conflicts. (Cuando estoy bajo de ánimo, tiendo a tener más dificultades o conflictos). | 0 | 1 | 2 | 3 | 4 |
| 10. When I feel down, I have a better intuitive feeling for what people really mean. (Cuando estoy bajo de ánimo, tengo una mejor intuición por lo que los demás quieren realmente decir). | 0 | 1 | 2 | 3 | 4 |
| 11. When I feel sad, I more often think that I can make no one happy. (Cuando me siento triste, pienso con más frecuencia que no puedo hacer feliz a nadie). | 0 | 1 | 2 | 3 | 4 |
| 12. When I feel bad, I feel more like breaking things. (Cuando me siento mal, siento más deseos de romper cosas). | 0 | 1 | 2 | 3 | 4 |
| 13. I work harder when I feel down. (Trabajo más duro cuando me siento mal). | 0 | 1 | 2 | 3 | 4 |
| 14. When I feel sad, I feel less able to cope with everyday tasks and interests. (Cuando estoy triste, me siento menos capaz de enfrentar las tareas e intereses diarios). | 0 | 1 | 2 | 3 | 4 |
| 15. In a sad mood, I am bothered more by aggressive thoughts. (En un estado de ánimo bajo, me molestan más pensamientos agresivos). | 0 | 1 | 2 | 3 | 4 |
| 16. When I feel down, I more easily become cynical (blunt) or sarcastic. (Cuando me siento bajo de ánimo, es muy fácil que me vuelva cínico/a (desvergonzado/a) o sarcástico/a). | 0 | 1 | 2 | 3 | 4 |
| 17. When I feel down, I more often neglect things. (Cuando me siento bajo de ánimo, descuido las cosas con más frecuencia). | 0 | 1 | 2 | 3 | 4 |
| 18. When I am sad, I have more problems concentrating. (Cuando me siento triste, tengo más problemas para concentrarme). | 0 | 1 | 2 | 3 | 4 |
| 19. When in a low mood, I am nicer than usual. (Cuando estoy en un estado de ánimo bajo, soy más amable que de costumbre). | 0 | 1 | 2 | 3 | 4 |
| 20. When I feel down, I lose my temper more easily. (Cuando estoy bajo de ánimo, exploto más fácilmente). | 0 | 1 | 2 | 3 | 4 |
| 21. When I feel sad, I feel more that people would be better off if I were dead. (Cuando estoy triste, creo que más personas estarían mejor si yo estuviera muerto/a). | 0 | 1 | 2 | 3 | 4 |
| 22. When I feel sad, I spend more time thinking about the possible causes of my moods. (Cuando me siento triste, paso más tiempo pensando en las causas posibles de mi estado de ánimo). | 0 | 1 | 2 | 3 | 4 |
| 23. When in a sad mood, I more often think about how my life could have been different. (Cuando me siento triste, pienso con más frecuencia en cómo habría podido ser de diferente mi vida). | 0 | 1 | 2 | 3 | 4 |
| 24. When I feel sad, more thoughts of dying or harming myself go through my mind. (Cuando me siento triste, se me ocurren más pensamientos de muerte o de hacerme daño). | 0 | 1 | 2 | 3 | 4 |
