


As is known, the insertion of new generation technologies, whether it is on transmission or distribution, has several effects on the traditional electric network, from technical changes to its regulation. There is a global interest on finding the best way to take advantage of those emerging technologies and the best way they can interact with the traditional power system. This paper proposes a methodology to exploit the maximum potential of the traditional electric network and the integration of a well-known generation technology such as the wind generation. To do so, we present a Probabilistic AC Optimal Power Flow (POPF) that takes into account load variation, wind’s stochastic behavior and variable line’s thermal rating which is usually used as a deterministic value in several studies. A validation of two proposed schemes of the Point Estimate Method (PEM) is made, not only for normal distributions but for different kinds of probability distributions, such as Weibull and generalized extreme value. Obtained results are compared with the Monte Carlo (MC) simulation indicating that the proposed method significantly reduces the computational burden while maintaining a high level of accuracy.
Como se sabe, la inserción de nuevas tecnologías de generación, ya sea en transmisión o distribución, tiene varios efectos sobre la red eléctrica tradicional, desde cambios técnicos hasta cambios en la reglamentación. Existe un interés mundial en la búsqueda de la mejor manera de aprovechar dichas tecnologías nuevas para que puedan interactuar con el sistema de potencia tradicional. En este trabajo se propone una metodología para explotar al máximo el potencial de la red eléctrica tradicional y la integración de una conocida tecnología de generación como la generación eólica. Para ello, se presenta un flujo de potencia óptimo probabilístico AC (POPF) que tiene en cuenta la variación de la carga, el comportamiento estocástico del viento y la variación en los límites térmicos de las líneas, los cuales usualmente se toman como determinísticos en algunos estudios. Se presenta una nueva validación de dos esquemas propuestos del método de estimación por puntos, no solo para distribuciones normales, sino, para varios tipos de distribuciones como la Weibull y la distribución generalizada de valores extremos. Los resultados obtenidos se comparan con la simulación de Monte Carlo.
Because of the constant expansion of the electric system configuration (loads, lines, generators, etc.) and the recent need of using more efficient and environmentally friendly elements and procedures, the electrical sector has been involved on the task of designing and applying different kinds of strategies to decrease line losses, upgrade the system reliability and specially to ensure it to be economically viable.
The optimal power flow (OPF) has been one of those strategies, ensuring that for every load demand scenario there is an optimal amount of power generated and restricted into a set of constraints to ensure its operational success. However the OPF has been generally applied as a deterministic method, ignoring some uncertainties that in a certain moment could be an important factor such as load variation and change on the configuration of the network that may lead to measurement errors on the generation forecasting.
It is also evident the huge insertion of wind generators on existing power systems promoted by its reduction on the environmental consequences and the usage of infinite primary energy source (wind) which has made a lot of countries support the expansion of renewable energy generation capacity (Slootweg, 2003; Jenkins, 2000). Nevertheless, its stochastic behavior makes it an intermittent source, which makes it harder to predict its generation capacity. Several probability distribution functions (PDF) have been proposed in the literature (Carta, 2009) to represent such a characteristic; however the most widely accepted PDF is the two-parameter Weibull distribution as in Kazerooni (2011) and Banerjee (2012).
Another important fact that is going to be highlighted is the thermal rating of the lines, which has usually been used as a deterministic parameter in several POPF studies. As can be seen in Kazerooni (2011) and Yenumula (2004), lines have dynamical thermal ratings that can vary, among others, because of the ambient temperature, air direction, and velocity and season. The line ratings affect the power system’s transfer capacity, limiting the maximum amount of power that can be delivered from one bus to another. If that limit is increased, for example, in case of high presence of wind generation, it could increase the quantity of harnessed power coming from them, decreasing, among others, the generation costs and the power generated from no-renewable generation plants.
In recent literature the POPF has been used. For example in Verbic (2006) a POPF using the two-point estimate method is presented, where the bus’ load is taken as random variable and the local marginal prices (LMP) are taken as results. Again in Li (2008), a POPF based on the variation of the nodal load power is presented, but using the first-order second-moment method (FOSMM) and taking into account the correlation between stochastic variables and may not be accurate if congestion on system’s lines. There is also literature such as Zaker (2012) and Ahmadi (2011) that incorporates wind generation and the PEM to solve the POPF.
Finally in Banerjee (2012) a DC modeled POPF (only active power is involved) is proposed, taking into account load variation, wind generation and variable line capacity values using a MC simulation based algorithm for a six nodes test system and a methodology to estimate the power reserve.
This paper presents an AC Probabilistic Optimal Power Flow using the 2m and 2m+1(3m) schemes of the PEM (Hong, 1998) taking into account the uncertainty on bus loads, the stochastic behavior of wind velocities and line’s thermal ratings being the random variables (RV). An explanation of the model for the wind generators used is also discussed. A comparison between the point estimate schemes implemented, when different kind of probability distributions are used, and the MC simulation of the generation costs obtained from two test systems (IEEE 14 and IEEE 118) is presented. Finally, results for two different cases on each test system, assuming fixed and dynamic line’s thermal ratings are exposed and discussed. The optimization procedure was made using Matpower.
Wind generators modelThere are several kinds of wind generator technologies to convert wind energy into electrical energy (Jenkins, 2000); however most of the installed turbines are basically one of these three: squirrel cage induction generators, doubly fed induction generators or direct drive synchronous generator. The main differences between one and other basically are the controllability and its connection to the network. The model used in this document is based on a variable speed asynchronous generator turbine, with negative generated power (QW load) and a lagging power factor of 0.8, which has been already used in the literature (Zaker, 2012).
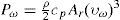
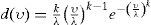
The dependence of the power extracted from the airflow on the wind speed is given by equation (1).
where
PW = mechanical power extracted from the airflow [W]
ρ = air density [kg/m3]
cp = performance coefficient or power coefficient that depends on the ratio between the rotational speed of the tip of a blade and the actual velocity of the wind (tip speed ratio) and on the pitch angle of the blade
υW = actual velocity of the wind in [m/s]
Ar = area swept by the rotor [m2].
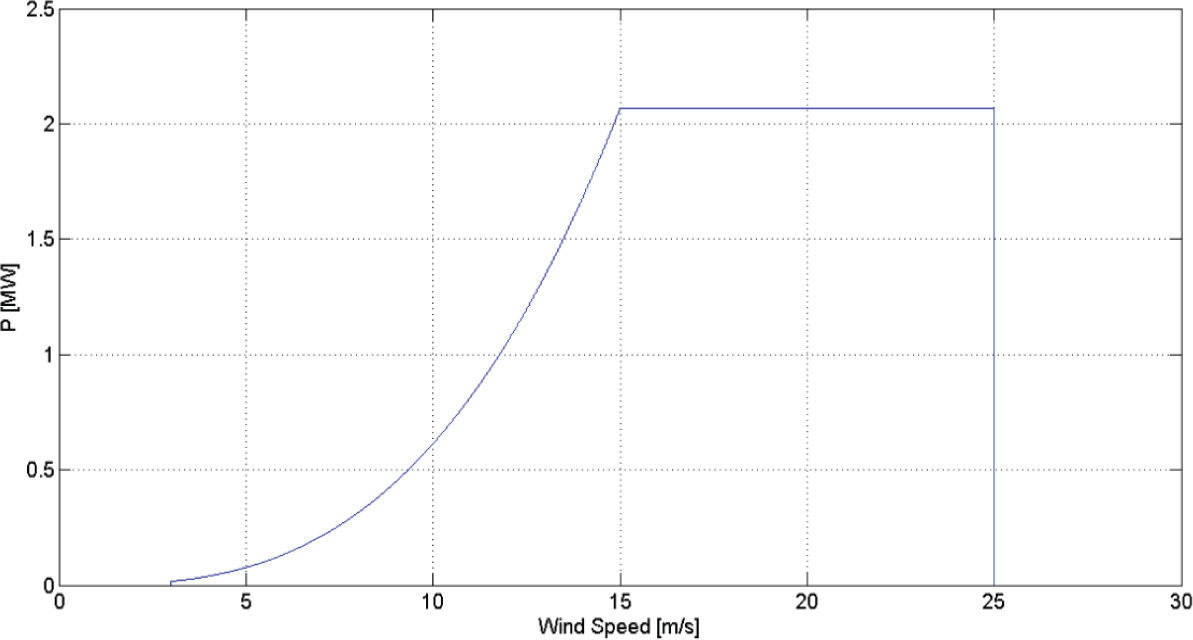
However this dependence is not valid for all wind’s possible velocities, it has to be bounded between operational limits if real wind generators are going to be modeled. At low speeds (usually less than 3 [m/s]) the energy contained on the air is just too low to generate any power; that speed is called cut-in speed. Between the cut-in speed and the rated speed, the generated power depends on the relation in equation (1). If wind velocity is higher than the rated speed but less than the cut-out speed, the generated power is set to the nominal power of the wind generator. In some rare cases wind speeds exceed the cut-out speed, if it does; the generated power is set to cero (Slootweg, 2003).
Several studies have shown that a good way of representing the stochastic behavior of wind velocities is a Weibull distribution (Kazerooni, 2011; Banerjee, 2012). In this paper, a two parameters Weibull distribution function is used.
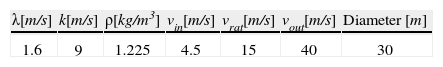
The parameters, cut-in speed, rated speed, etc. for all wind farms are shown in Table 1. Every wind generator on the wind farms is a variable speed, 1.41 [MW] rated power machine and every performance coefficient cp is arbitrarily set to one.
Line transfer capability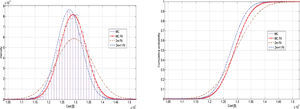
The maximum capacity of the transmission lines depends of several factors, a lot of those factors are associated with the weather, what makes line’s capacity a non deterministic variable. It is common for network’s capability to be underestimated if thermal ratings are fixed in their rated value which is usually quite conservative in comparison to the real network transfer capacity at a given time (Banerjee, 2012).
Thus, it is necessary to consider line capacities as probabilistic variables, where the probability distribution function of the maximum power flows in lines corresponds to a generalized extreme value distribution, which is expressed as shown in equation (3). This distribution is commonly used in literature (Banerjee, 2012; Kazerooni, 2011) because it has proven to be the more suitable PDF for the phenomena.
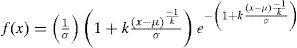
The shape parameters of the probability distribution are defined by σ, k, μ. These parameters are determined according to a set of factors in the lines (Kazerooni, 2011). Those values were scaled, adapted and used on each one of the test systems considered in this paper. On the other hand, based on each line’s PDF, a probabilistic value for the line’s thermic capacity will be used as constraint for the optimal power flow; this will be discussed later.
Probabilistic optimal power flowOptimal power flow formulationAny probabilistic analysis starts from the hypothesis that the behavior of stochastic variables is approximately known, depending on the PDF; several parameters are needed in order to obtain a satisfactory response. The variables involved in a usual OPF are deterministic variables; in this paper a POPF is built based on a deterministic one because the OPF that MATPOWER uses is a deterministic optimal power flow. In order to do that, a probabilistic method that can be used iteratively as input argument for the OPF has to be developed. The method to be used is the PEM, more exactly, the well-known 2m and 2m+1 particular schemes.
The running cost of a thermal power plant can be approximated by a quadratic function as in equation (4).
Where ai, bi and ci are constant coefficients related to the cost of fuel at generator i. And i=1, 2, …, m, where m is the total number of thermal generators and mw is the number of wind generators. The deterministic optimization problem consists on minimizing the operational costs while keeping a secure operation of the system, as is proposed in (5).
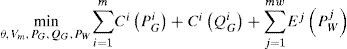
subject to
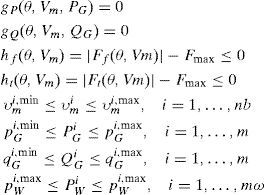
The equality constraints g(x) are the full set of 2 · nb nonlinear active and reactive power balance equations, where nb is the number of buses. The inequality constraints h(x) consist of two sets of nl branch flow limits as nonlinear functions, where nl is the number of lines; one for the from-end and one for the to-end of each branch. Finally, the variable has upper and lower limits on all bus voltage magnitudes and real and reactive generator injections. PGi is the power generated by the i-th thermal generator, Pwi and Ej are the power generated by the j-th wind farm and its feed-in tariff respectively.
Point estimate methodThe point estimate method is a statistic method for modeling the uncertainty in the output variables according to their central moments evaluating the model at specific previously calculated points that are within the sample space (Rosenblueth, 1975). Basically, the object of this method in the POPF is to obtain the most representative points of each random variable (locations and weights) by a mathematical process, using one variable at a time as input value in the OPF and storing the output data to finally obtain an estimate of the stochastic behavior of the output variables (Chun, 2005; Peñuela, 2010; Morales, 2007).
2m Scheme2m scheme relates the first three central moments of each random variable k which is part of a variables vector M. Its mean μk and its standard deviation σk must be known from a set of N observations, allowing thr estimation of the behavior of the output variables by 2m output points after the execution of 2m OPF, where m is the number of RV. So it is necessary to find those two xk,i points named as locations for each random variable as in equation (6).

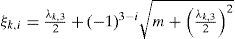
The λk,3 parameter is known as the skewness coefficient of k when j = 3 in equation (8).

It is also necessary to find a weighting factor for every pair of points xk,i, so a pair (xk,i, wk,i) can be used as in equation (9).
2m+1 Scheme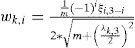
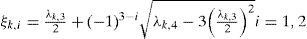
According to Hong (1998), every hm+1 scheme is an adaptation of (2i+1)m schemes or (odd)m schemes. In the case study, the 2m+1 scheme is a particular case of the 3m scheme taking the third value of ξi (i=1, 2, 3) as cero, this is with one of its locations equal to the random variable’s mean, as shown in equation (6) when ξk,3=0. For the other two locations the procedure does not change but the way of finding the values does as in (10).
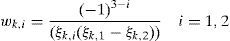
The weighing factors for the first two locations are obtained with (11), and the third one with (12).
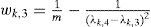
Since just one extra OPF is needed and the relation to find the weights is used independently for each random variable, an equivalent weighing can be found for the extra point with (13) which accumulates the weights of every random variable in (12) in a single point.
Probabilistic optimal power flow formulation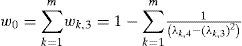
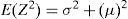
After finding both values (xk,i, wk,i) for the random variable k according to the scheme used, it is possible to run the ACOPF, shown in the section of: optimal power flow formulation with the value of the variable k equal to its first location, and the rest set to their respective mean value, OPF(μ1, μ2, χK,1, …, μm). Output variables (cost, LMP, etc.) are saved in an output vector named Z together with its corresponding weights. The same is made for every single random variable, one at the time. Finally the expected value μ and standard deviation σ of Z are derived in (15) and (16) using (14).
Results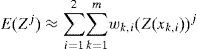

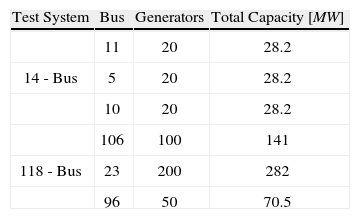
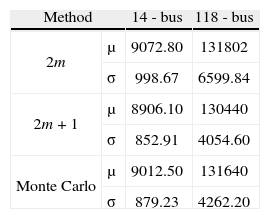
The proposed method was tested on the IEEE 14-bus system and on the IEEE 118-bus system with the addition of the wind generators in Table 2. Each of them was split into two different cases. The first case takes bus loads and wind speed as RV and fixing their line’s thermal rating on its mean. The second case takes load demand, wind speed and thermal line ratings as RV. Both cases were applied using the 2m and the 2m+1 schemes of the PEM and the costs obtained were compared with a MC simulation of 3000 samples. Different kinds of probability distributions were used. For both cases, load demand for all buses were described as a normal distributions with their deterministic value as mean and coefficient of variation of 20%; wind speed was assumed to have a Weibull distribution for all wind farms; every wind farm was composed by a number of wind generators as shown in Table 2 and with the parameters of Table 1. For the second case, line thermal ratings were assumed as RV and were characterized by a general extreme value distribution, with the same shape parameter k=−0.19, for all of them μ is set as the deterministic value and σ as a variable number between 10% and 15% of the deterministic value. For both scenarios, the mean and standard deviation obtained with the proposed PEM schemes, calculated as in equations (15) and (16), are compared with those of the MC simulation, which are commonly used as reference values and are calculated in equations (17) and (18). Finally, a comparison is made between the results obtained with the fixed thermal line ratings and the dynamic ones in order to show the differences in the generation cost probability.
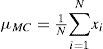
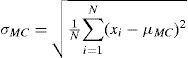
where N is the number of samples and x is the random variable.
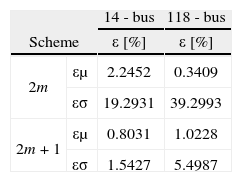
To compare the accuracy of the proposed PEM schemes the absolute relative error between results was used (equation 19), where y refers to μ or σ.
First case, fixed thermal line parameters
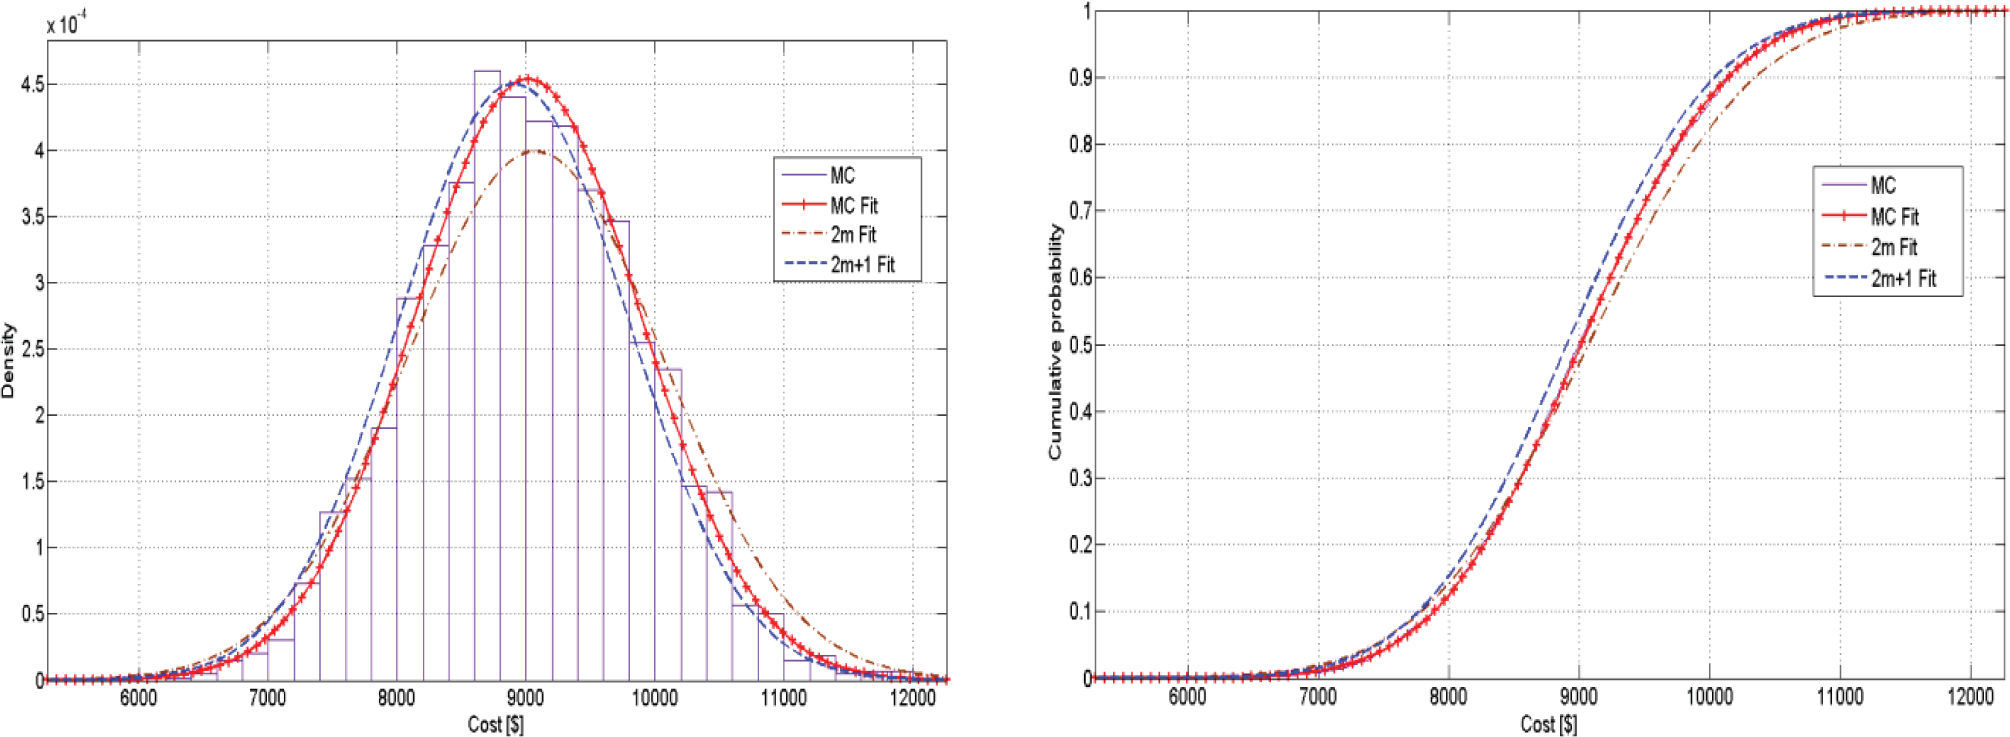
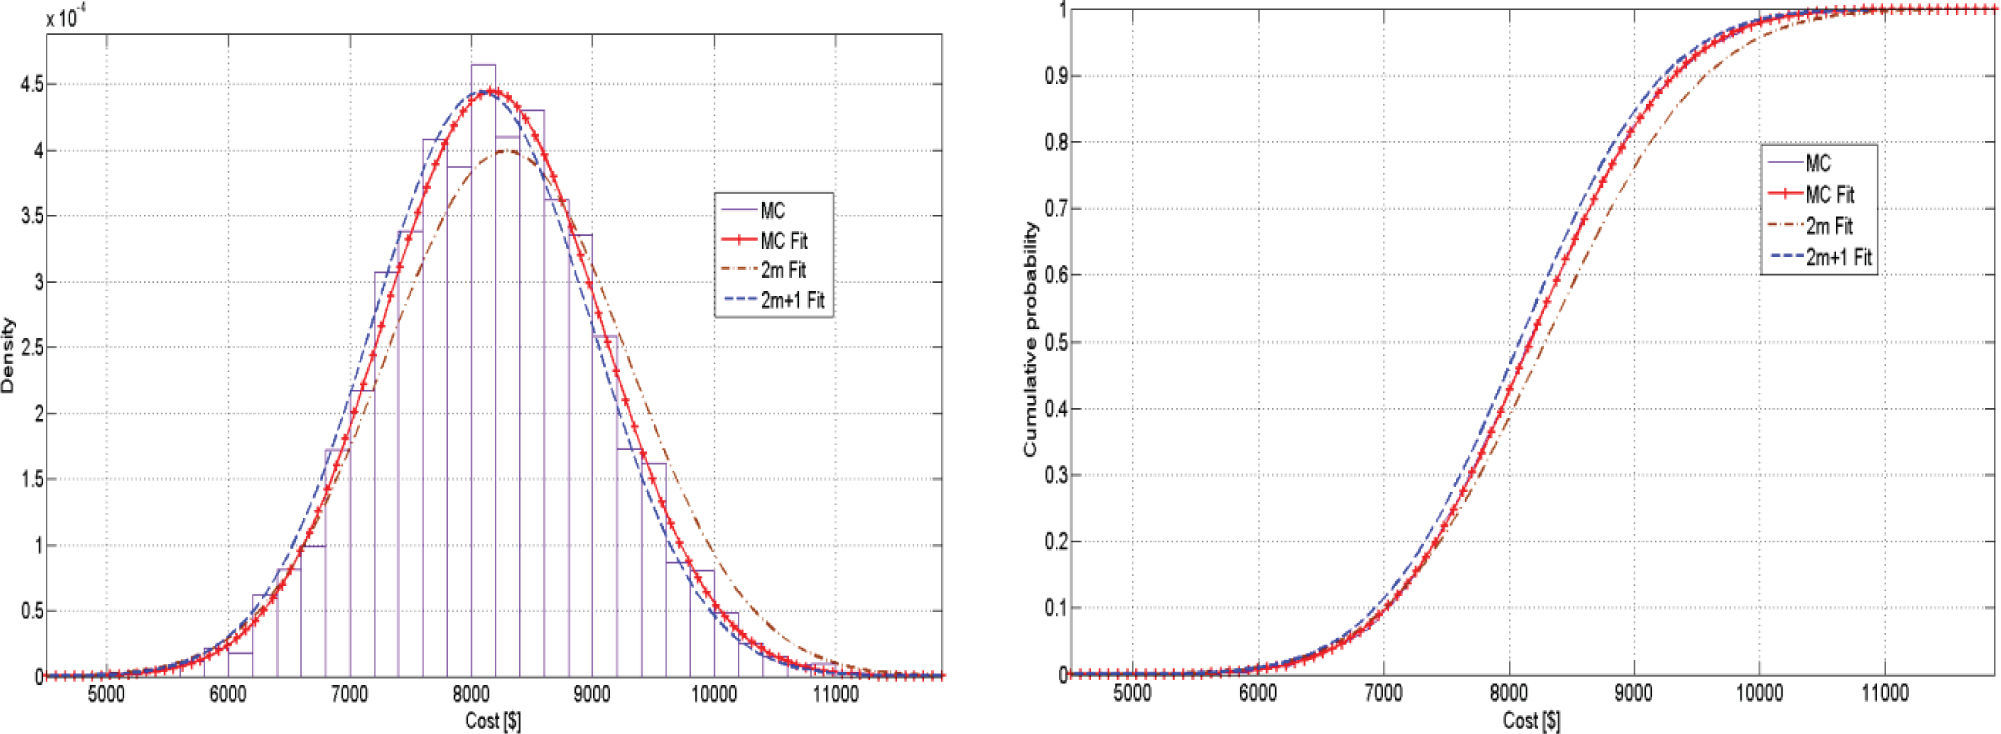
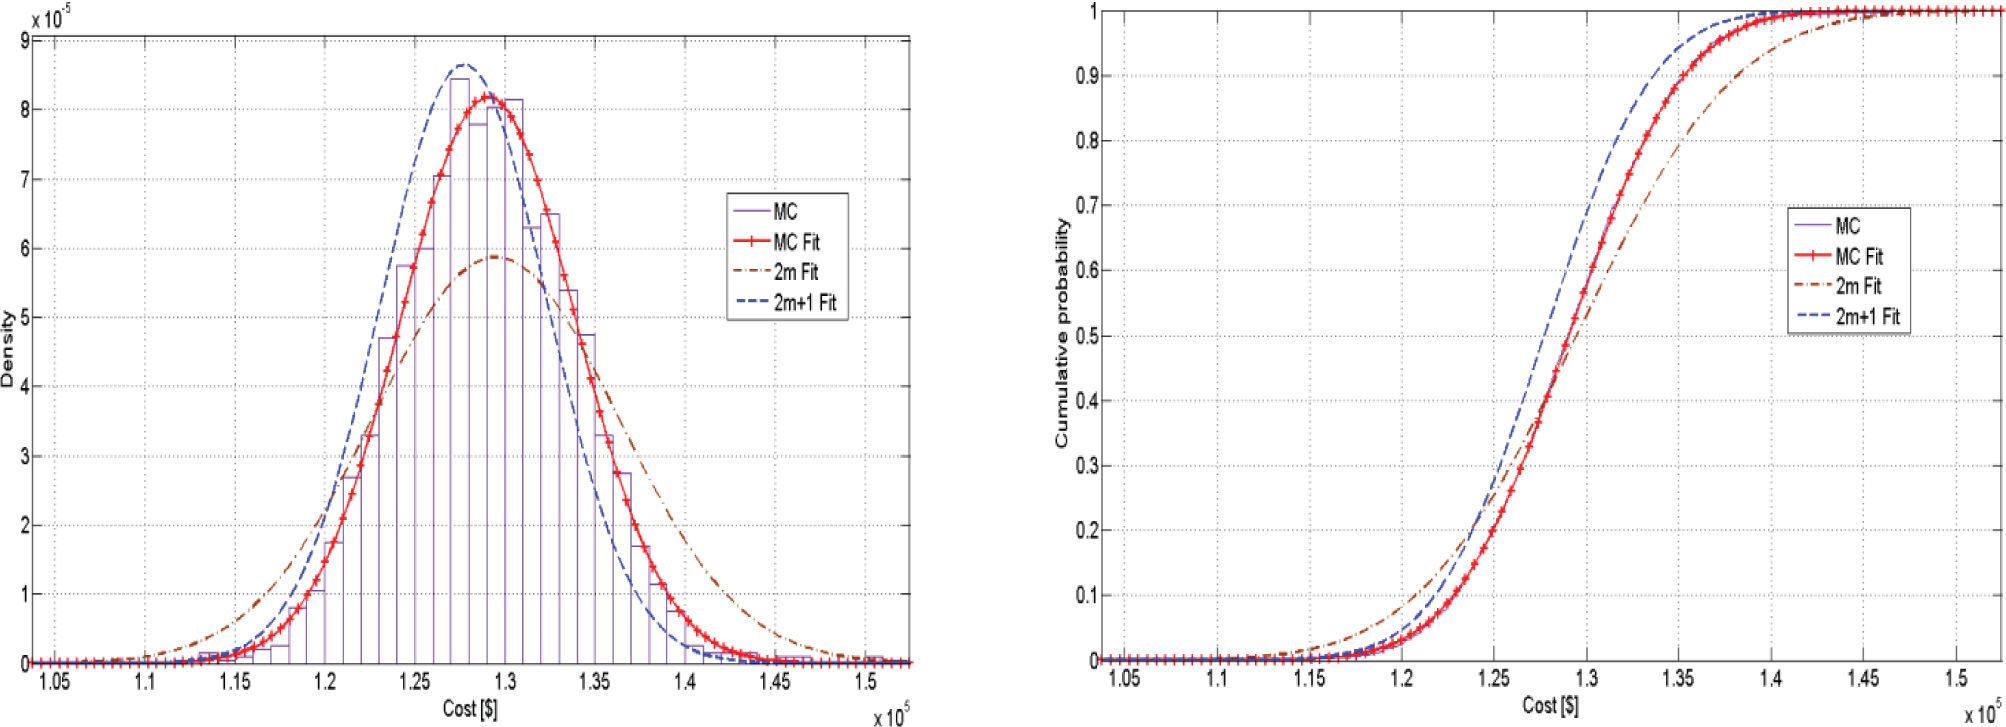
The results obtained after running the POPF for the 14-bus test are shown in Figure 2, it can be seen that both schemes represent in a good way those obtained with the MC simulation. It should be noted that fixed thermal line ratings were taken into account for every simulation and that the 14-system problem has 25 RV and the 118-bus problem has 202. However, there is a tendency for the 2m+1 scheme to be more accurate than the 2m.

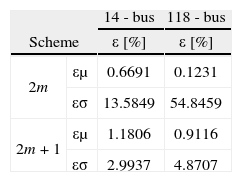
This is more evident in Figure 3, where the same output parameter was calculated for the 118-bus system using the same three proposed methods and the same conclusion were deduced. In Table 3 the values of ε show that the 2m+1 scheme is actually more accurate than the 2m, what confirms the previous suppositions.
Second Case, Dynamic Thermal Line Parameters
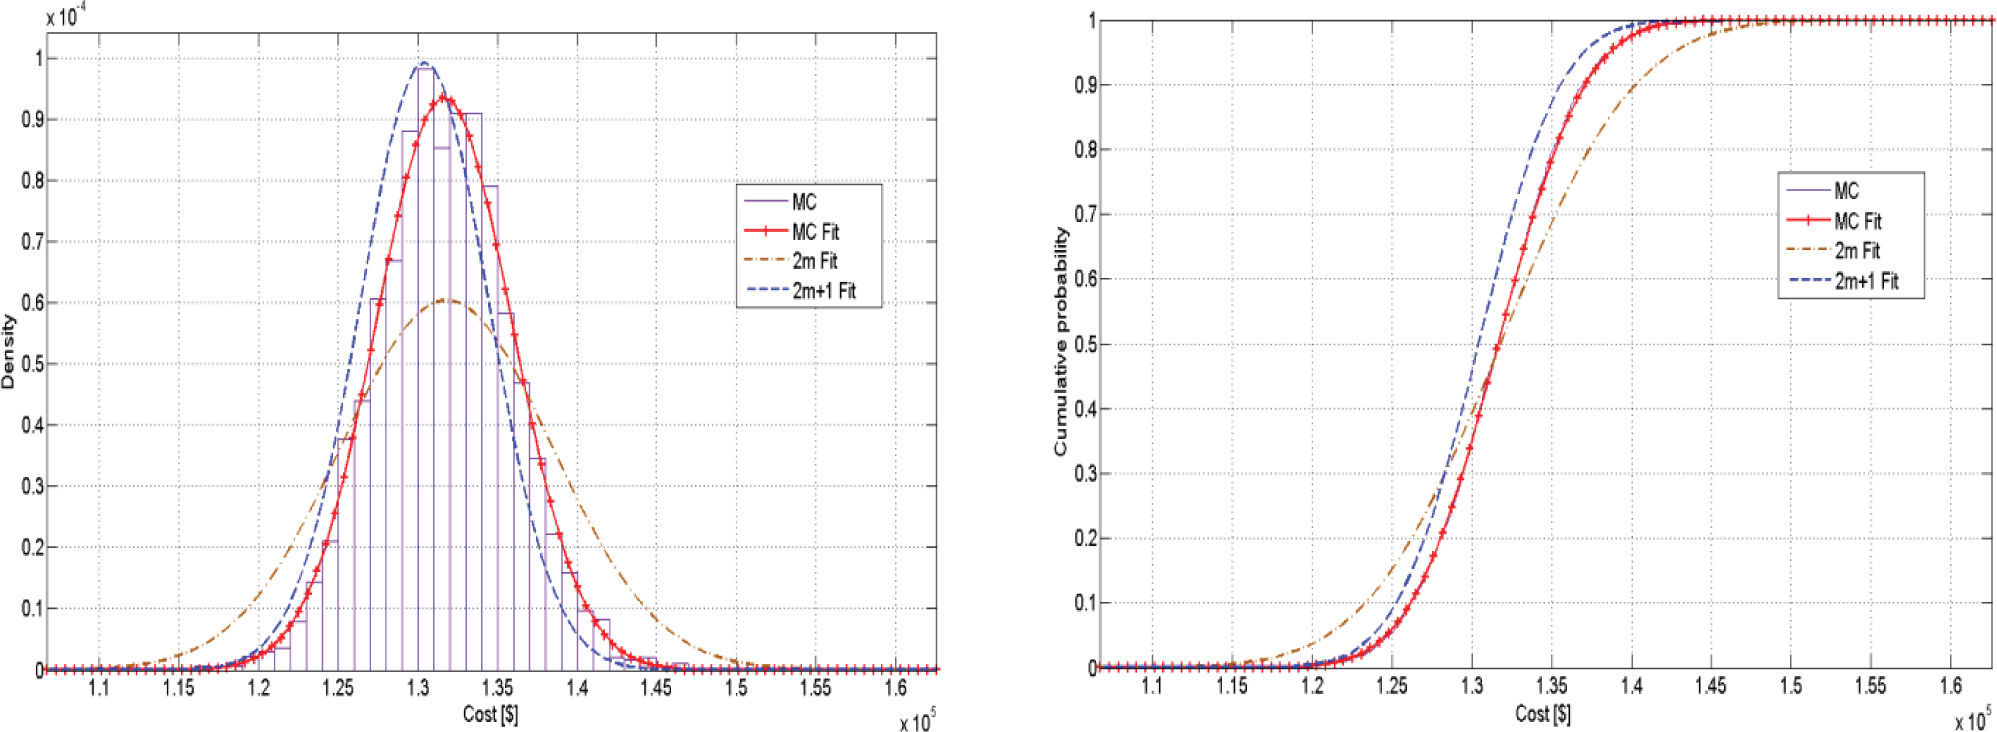
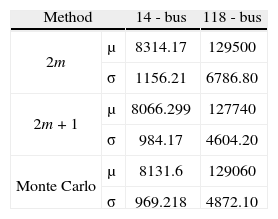
This time all line thermal ratings are stochastic variables, what means an increment in the number of RV of 80% and 87.1% for the 14-bus and 118-bus test systems, respectively. In Figure 4, it can be seen again that the 2m+1 has better results than the 2m. In this case for the 118-bus systems in Figure 5, both schemes seem to have high error results, but observing Table 4, again the 2m+1 scheme has less percentage of error in the standard deviation than the 2m scheme; which means that it has a better behavior.


Basically the main reason for the difference between the obtained results with the 2m scheme and the MC simulation is the fact that the used scheme only takes into account the first three statistical moments of the random variable; what leads to an important error when distributions with reasonable values of kurtosis are used. That error is also increased by the explicit dependence of the used scheme on the number of variables as can be seen comparing the standard deviation in both test systems for the shown cases.
Based on the MC simulation mean results in Table 5 and Table 6, it can be inferred that the generation cost increases if fixed limits are taken. This can be seen if a figure from the first case is compared with one on the second, whether it is for the 14-bus or for the 118-bus system. For example for the 14-bus system based on the CDF on Figure 2 there is approximately a probability of 50% that generation cost are equal or greater than $9000.
On the other hand, the CDF on Figure 4 shows that there is probability of 18% for the generation cost to be equal or greater than $9000. This means that if dynamic thermic line ratings are taken, there is approximately 32% less probability to have costs greater than $9000, what in other words means that if dynamic limits are taken the overall generation cost of the system will decrease. The same procedure can be done for the 118-bus system and similar results must be reached.
This happens because if a higher quantity of power can be injected to the network from cheaper generators, i.e. line power transfer increase and generators still have generation reserve, then the generation cost might decrease, as is shown on the used test systems.
ConclusionsA Weibull distribution for wind generators was used to simulate the stochastic behavior of wind speeds; also a model was used, that takes into account wind generator limits such as cut-in and cut-out wind velocities and treats such generators as active power injections with reactive power consumption with constant power factor. An AC POPF was proposed including wind farms and dynamic line’s thermal ratings using the 2m and the 2m+1 schemes of the PEM and comparing their results with those obtained by a 3000 MC simulation.
It was observed that even though the used PEM schemes may not be an exact reproduction of the distribution function obtained with the MC simulation, it is a really good approximation. Especially if low dispersed distribution functions were used. If that is not the case, as in this paper, where Weibull and generalized extreme value distributions were used, it was shown that the 2m+1 scheme is a better option rather than the 2m; basically because its independence from the number of RV and also because it relates up to the fourth statistic moment of each random variable, what allows it to have more information such as the kurtosis, which is an important parameter on highly dispersed distributions.
It was also shown that the usage of dynamic ratings on maximum thermal line ratings can be a better solution for the optimization problem if compared to the results obtained when those limits are fixed. It could be observed that a reduction on the mean cost and also on the probability of reaching higher generation costs was obtained when dynamic limits where used.
Juan Sebastián Giraldo-Chavarriaga. Received the B.S degree in electrical engineering from the Universidad Tecnolgica de Pereira (UTP), Pereira, Colombia, in 2012. He is currently pursuing his M.S. in Electrical Engineering at the Universidade Estadual de Campinas (UNICAMP), Campinas, Brazil. His research interests are in voltage stability analysis and operation of transmission and distribution power systems.
Jhon Alexander Castrillón-Largo. Received the B.S degree in electrical engineering from the Universidad Tecnolgica de Pereira (UTP), Pereira, Colombia, in 2012. Currently is pursuing his M.S. in Electrical Engineering at the Universidade Estadual de Campinas (UNICAMP) in Campinas, Brazil. His research interests are voltage stability analysis and operation of transmission and distribution power systems.
Mauricio Granada-Echeverri. Received the P.E. and M.Sc degrees from the Universidad Tecnológica de Pereira, Colombia, in 2001 and 2003, respectively, and the Ph.D. degree from the Universidade Estadual Paulista (UNESP), SP, Brazil, in 2011, all in electrical engineering. His research interests include application of optimization theory in operation and planning of power systems.