
Gastroesophageal varices are present in approximately 50% of patients with liver cirrhosis. The aim of this study was to evaluate liver stiffness measurement (LSM), Fib-4, Forns Index and Lok Score as noninvasive predictors of esophageal varices (EV).
MethodsThis prospective study included 65 patients with HCV-related liver cirrhosis. All patients underwent routine laboratory tests, transient elastograhy (TE) and esophagogastroduodenoscopy. FIB-4, Forns Index and Lok Score were calculated. The diagnostic performances of these methods were assessed using sensitivity, specificity, positive predictive value, negative predictive value, accuracy and receiver operating characteristic curves.
ResultsAll predictors (LSM, FIB-4, Forns Index and Lok Score) demonstrated statistically significant correlation with the presence and the grade of EV. TE could diagnose EV at a cutoff value of 18.2kPa. Fib-4, Forns Index, and Lok Score could diagnose EV at cutoff values of 2.8, 6.61 and 0.63, respectively. For prediction of large varices (grade 2, 3), LSM showed the highest accuracy (80%) with a cutoff of 22.4kPa and AUROC of 0.801. Its sensitivity was 84%, specificity 72%, PPV 84% and NPV 72%. The diagnostic accuracies of FIB-4, Forns Index and Lok Score were 70%, 70% and76%, respectively, at cutoffs of 3.3, 6.9 and 0.7, respectively. For diagnosis of large esophageal varices, adding TE to each of the other diagnostic indices (serum fibrosis scores) increased their sensitivities with little decrease in their specificities. Moreover, this combination decreased the LR− in all tests.
ConclusionNoninvasive predictors can restrict endoscopic screening. This is very important as non invasiveness is now a major goal in hepatology.
Aproximadamente, el 50% de los pacientes con cirrosis hepática presentan varices gastroesofágicas. El objetivo de este estudio es evaluar la medida de rigidez hepática (LSM, por su nombre en inglés), FIB-4, el índice de Forns y el índice de Lok como predictores no invasivos de varices esofágicas (VE).
MétodosEste estudio prospectivo incluyó a 65 pacientes con cirrosis hepática asociada a VHC. Todos los pacientes fueron sometidos a pruebas de laboratorio rutinarias, elastografía de transición (ET) y endoscopia de las vías digestivas altas. Se calculó el FIB-4, el índice de Forns y el índice de Lok. Se evaluó el rendimiento de estos métodos respecto al diagnóstico mediante la medición de sensibilidad, especificidad, valor predictivo positivo (VPP), valor predictivo negativo (VPN), precisión y curvas ROC.
Resultadostodos los predictores (LSM, FIB-4, índice de Forns eíndice de Lok) mostraron una correlación estadísticamente significativa entre la presencia y el grado de EV. La elastografía de transición diagnosticó EV con un valor de corte de 18,2KPa. El valor de corte para Fib-4, índice de Forns, índice de Lok fue de 2,8; 6,61 y 0,63 respectivamente. En la predicción de varices grandes (grado 2, 3) LSM mostró la precisión más elevada (80%) con un punto de corte de 22,4KPa y una AUROC de 0,801. Su sensibilidad fue del 84%, la especificidad del 72%, el VPP de 84% y el VPN de 72%. La precisión diagnóstica de FIB-4, índice de Forns e índice de Lok fueron del 70, 70 y 76% respectivamente, con puntos de corte de 3,3; 6,9 y 0,7 respectivamente. Para el diagnóstico de varices esofágicas grandes, la adición de la ET a cada uno de los demás índices de diagnóstico (puntuaciones séricas de fibrosis) aumentó la sensibilidad con poca disminución de la especificidad. Además, dicha combinación disminuyó el índice de probabilidad negativo (LR-) en todas las pruebas.
Conclusiónlos predictores no invasivos pueden reducir el uso de pruebas endoscópicas. Esto es muy importante puesto que el empleo de pruebas no invasivas es en la actualidad una meta importante en hepatología.
Hepatitis C virus (HCV) is the most common cause of chronic liver disease (CLD) in Egypt, where prevalence of anti-HCV antibodies is 10-fold greater than in the United States and Europe.1 Liver cirrhosis (LC) is the end stage of HCV-related chronic liver disease. Gastroesophageal varices are present in approximately 50% of patients with liver cirrhosis.2 The annual rate of developing esophageal varices is about 5%.3
Bleeding from esophageal varices (EV) is the most risky complication, occurring in 20–40% of cirrhotic patients and is associated with high morbidity and mortality.4 About 20% of cirrhotic patients with acute variceal bleeding die within 6 weeks.5 After spontaneous stopping of hematemesis, the incidence of early rebleeding ranges from 30% to 40% within the first 6 weeks, and about 40% of all rebleeding episodes occur within the first 5 days.6 The mortality rate associated with each bleeding episode ranges between 17% and 57%.7 The current guidelines recommend screening all cirrhotic patients by endoscopy to identify those at risk of bleeding so that they can be administered prophylactic therapy.8 Compensated patients who do not have varices should receive an endoscopic examination every 2–3 years. Those with small varices should receive an examination every 1–2 years.9 Decompensated cirrhotic patients should receive an endoscopic examination every year even if they have no varices.9,10
The current guidelines cause significant burden and cost to the endoscopy units, because up to 50% of patients with liver cirrhosis may still not have developed esophageal varices 10 years after the initial diagnosis.11 Moreover, repeated endoscopic examinations are unpleasant to the patients, reducing their compliance to screening. That is why selection of patients having esophageal varices has become an important issue.
Our study is based on the concept that progressive liver fibrosis causes portal hypertension with the consequent development of esophageal varices and that common tests previously validated as predictors of liver fibrosis, such as Fib-4, Forns Index and Lok Score, can be used to predict the presence of esophageal varices.
In this study, we aim to prospectively evaluate and compare transient elastography (TE) and serum markers of hepatic fibrosis; Fib-4, Forns Index and Lok Score as noninvasive predictors of esophageal varices and large esophageal varices in Egyptian patients with HCV-related liver cirrhosis.
MethodsThis prospective cross-sectional study was approved by the institutional Ethical Committee. It included 65 patients with HCV-related liver cirrhosis who were under investigation and/or treatment at gastroenterology and hepatology outpatient clinics, patients admitted to the endemic medicine department of the Cairo university hospitals or patients referred to the hospital endoscopy unit for endoscopic screening for the presence of esophageal varices in the period between January 2012 and February 2013. All patients supplied informed consent before participating in this study according to the 1975 Helsinki Declaration. Liver cirrhosis diagnosis was based on physical findings, laboratory investigations, ultrasonographic findings and TE value of > 14.5kPa (cutoff value for diagnosis of stage 4 fibrosis). Exclusion criteria included the following: (1) patients with previous or active gastrointestinal bleeding; (2) patients who previously had undergone injection sclerotherapy, band ligation or surgery for esophageal varices; (3) patients receiving beta blockers; (4) patients with liver cirrhosis due to causes other than HCV; (5) patients with perihepatic ascites (hinder TE examination of the liver); (6) patients with hepatocellular carcinoma; and (7) patients with concomitant hepatic schistosomiasis.
All patients underwent routine laboratory work-up, LSM and esophagogastroduodenoscopy for the assessment of EV.
Laboratory work-up and calculation of serum liver fibrosis scores:
Laboratory tests included alanine aminotransferase (ALT), aspartate aminotransferase (AST), total bilirubin (Bil), alkaline phosphatase (ALT), gamma glutamyl transpeptidase
(GGT), international normalized ratio (INR), and platelets count (Pl) were recorded. Serum liver fibrosis scores were then calculated.
- -
FiB4=[age (years)×AST (IU/L)]/[platelet count (109/L)×square root ALT (IU/L).12
- -
Forns Index=7.811−3.131×ln [platelet count (109/L)]+0.781×ln[GGT(IU/L)]+3.467×ln [age (years)]−0.014[cholesterol (mg/dL)].13
- -
Lok score: log odds=−5.56−0.0089×platelet count (103/mm3)+1.26×(AST/ALT)+5.27×INR; Lok=[exp(log odds)]/[1+exp (log odds)].14
All esophagogastroduodenoscopies were performed by a single experienced endoscopist using Olympus GIF 160-Q165 (EXERA II). Esophageal varices were graded according to their size as follows: (i) grade 1: small, straight EV; (ii) grade 2: enlarged, tortuous EV occupying less than one-third of the lumen; and (iii) grade 3: large, coil-shaped EV occupying more than one-third of the lumen. Endoscopic examination was done within a month of LSM.
Liver stiffness measurementLiver stiffness measurements (LSM) were performed using TE (Fibroscan, Echosens, Paris, France) following the technical background and examination procedure as described previously.15 The results were expressed in kilopascals (kPa). The median value of 10 successful measurements was considered as a representative of the liver stiffness. According to the manufacturer's recommendations and previous evidence, interquartile range (IQR) lower than 30% of the median value and success rate (the ratio of the number of successful acquisitions over the total number of acquisitions) of at least 60% were included.16,17 All LSMs were performed by as single experienced operator. The cutoff value to define cirrhosis was 14.5kPa.
Statistical analysisData were statistically described in terms of mean±standard deviation (±SD), median and range, or frequencies (number of cases) and percentages when appropriate. Comparison of numerical variables between the study groups was done using Mann–Whitney U test for independent samples when comparing 2 groups and Kruskal–Wallis test with post hoc multiple 2-group comparisons when comparing more than 2 groups. For comparing categorical data, Chi square (χ2) test was performed. Exact test was used instead when the expected frequency was less than 5. The diagnostic performance of LSM and serum fibrosis scores was assessed using sensitivity (Se), specificity (Sp), positive predictive value (PPV), negative predictive value (NPV), accuracy, and likelihood ratios (LR). Receiver operator characteristic (ROC) analysis was used to determine the optimum cut off value for the studied diagnostic markers. Optimal cutoffs for the variables were chosen so that the sum of sensitivity and specificity would be maximal. p values less than 0.05 was considered statistically significant. Logistic regression models with backward selection were used to identify independent predictors of esophageal varices. Variables that showed significant association with esophageal varices by univariate analysis were included in a multivariate analysis. All statistical calculations were done using computer programs SPSS (Statistical Package for the Social Science; SPSS Inc., Chicago, IL, USA) version 15 for Microsoft Windows.
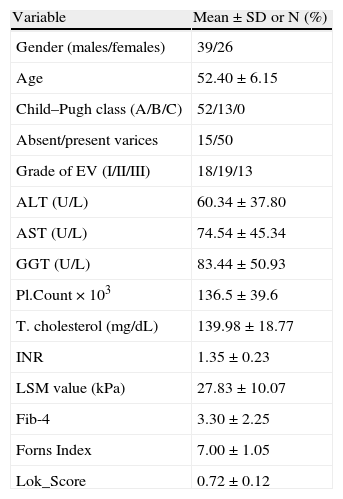
ResultsA total number of 65 HCV-induced LC patients were enrolled in the study. Baseline characteristics are presented in Table 1. Fifty-two patients were Child A and 13 patients were child B. All patients with no varices (15 patients) were Child A. The mean value of Child–Pugh score was 5.55±0.72 in patients with no varices and it was 5.96±1.07 in patients with esophageal varices (P;0.03).
Baseline characteristics of patients.
| Variable | Mean±SD or N (%) |
| Gender (males/females) | 39/26 |
| Age | 52.40±6.15 |
| Child–Pugh class (A/B/C) | 52/13/0 |
| Absent/present varices | 15/50 |
| Grade of EV (I/II/III) | 18/19/13 |
| ALT (U/L) | 60.34±37.80 |
| AST (U/L) | 74.54±45.34 |
| GGT (U/L) | 83.44±50.93 |
| Pl.Count×103 | 136.5±39.6 |
| T. cholesterol (mg/dL) | 139.98±18.77 |
| INR | 1.35±0.23 |
| LSM value (kPa) | 27.83±10.07 |
| Fib-4 | 3.30±2.25 |
| Forns Index | 7.00±1.05 |
| Lok_Score | 0.72±0.12 |
AST=aspartate amino transferase; ALT=alanine amino transferase; GGT=gamma glutamyl transpeptidase; Pl count=platelets count; T. cholesterol=total cholesterol; INR=international normalized ratio; EV=esophageal varices; LSM=liver stiffness measurement.
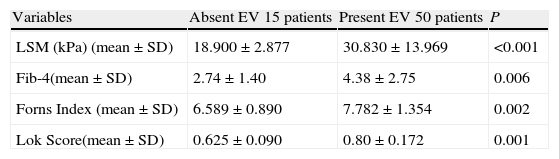
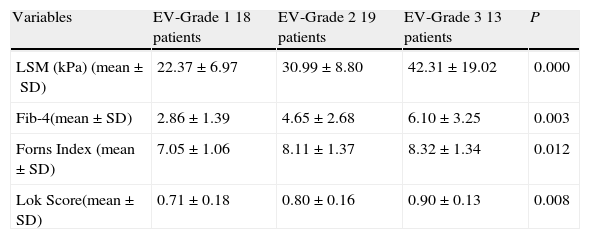
Significant correlations were noted between the mean values of LSM and serum fibrosis scores (Fib-4, Forns Index, Lok Score) and the presence as well as the grade of esophageal varices (Tables 2 and 3).
Performance of LSM and serum fibrosis scores to detect the presence of esophageal varices.
| Variables | Absent EV 15 patients | Present EV 50 patients | P |
| LSM (kPa) (mean±SD) | 18.900±2.877 | 30.830±13.969 | <0.001 |
| Fib-4(mean±SD) | 2.74±1.40 | 4.38±2.75 | 0.006 |
| Forns Index (mean±SD) | 6.589±0.890 | 7.782±1.354 | 0.002 |
| Lok Score(mean±SD) | 0.625±0.090 | 0.80±0.172 | 0.001 |
EV=esophageal varices; LSM=liver stiffness measurement.
Performance of LSM and serum fibrosis scores to detect the grade of esophageal varices.
| Variables | EV-Grade 1 18 patients | EV-Grade 2 19 patients | EV-Grade 3 13 patients | P |
| LSM (kPa) (mean±SD) | 22.37±6.97 | 30.99±8.80 | 42.31±19.02 | 0.000 |
| Fib-4(mean±SD) | 2.86±1.39 | 4.65±2.68 | 6.10±3.25 | 0.003 |
| Forns Index (mean±SD) | 7.05±1.06 | 8.11±1.37 | 8.32±1.34 | 0.012 |
| Lok Score(mean±SD) | 0.71±0.18 | 0.80±0.16 | 0.90±0.13 | 0.008 |
EV=esophageal varices; LSM=liver stiffness measurement.
Among the fifty patients with esophageal varices, 18 patients had grade 1 esophageal varices (small esophageal varices) and 32 patients had grade 2–3 varices (large esophageal varices).
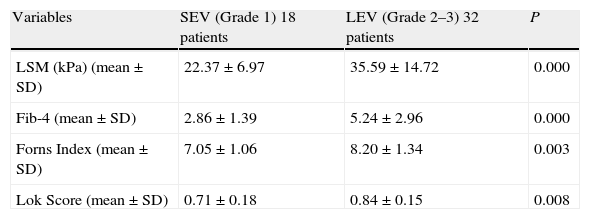
Mean values of LSM and serum fibrosis scores (Fib-4, Forns Index, Lok Score) could significantly differentiate between small esophageal varices (SEV); grade 1 varices and large esophageal varices (LEV); grade 2–3 varices (Table 4).
Performance of LSM and serum fibrosis scores to differentiate between small esophageal varices (SEV) and large esophageal varices (LEV).
| Variables | SEV (Grade 1) 18 patients | LEV (Grade 2–3) 32 patients | P |
| LSM (kPa) (mean±SD) | 22.37±6.97 | 35.59±14.72 | 0.000 |
| Fib-4 (mean±SD) | 2.86±1.39 | 5.24±2.96 | 0.000 |
| Forns Index (mean±SD) | 7.05±1.06 | 8.20±1.34 | 0.003 |
| Lok Score (mean±SD) | 0.71±0.18 | 0.84±0.15 | 0.008 |
SEV=small esophageal varices; LEV=large esophageal varices; LSM=liver stiffness measurement.
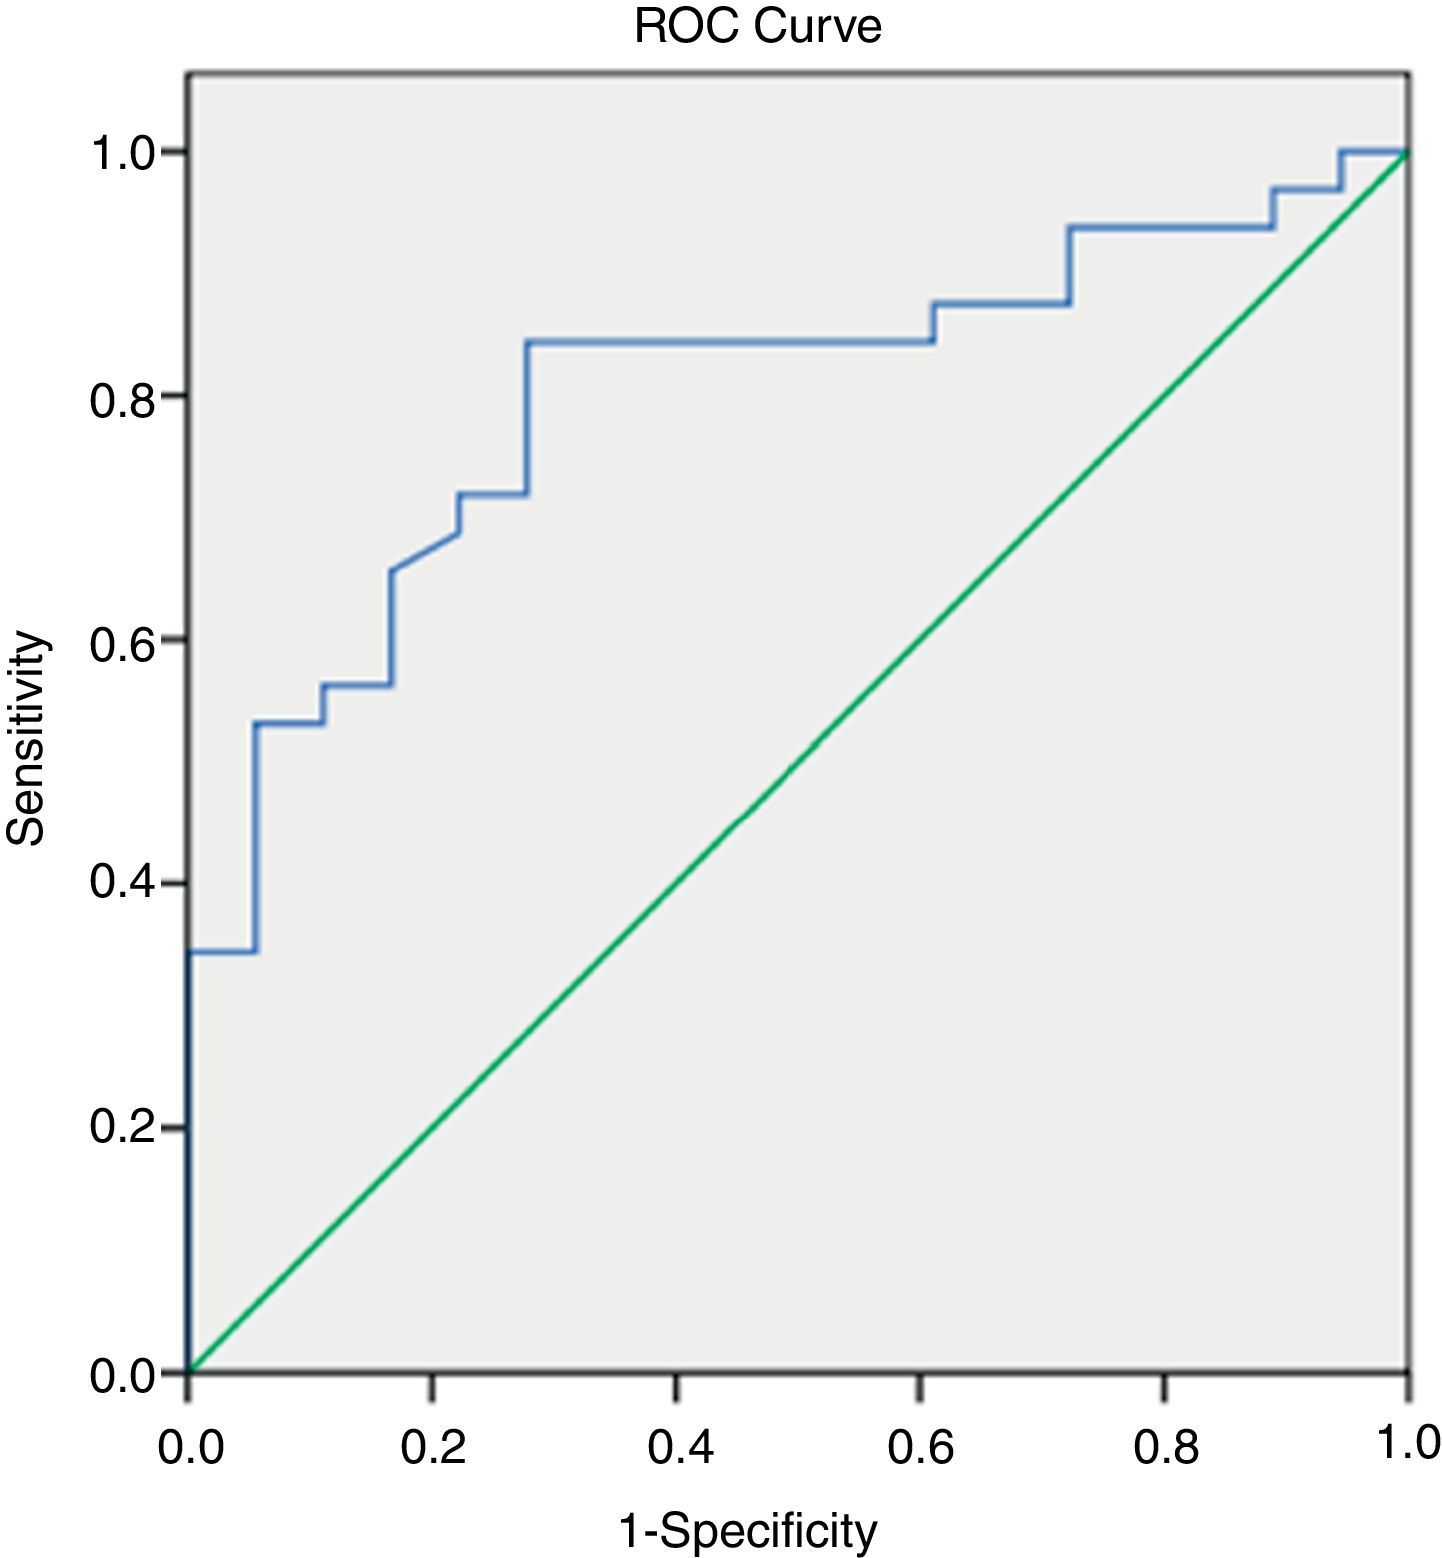
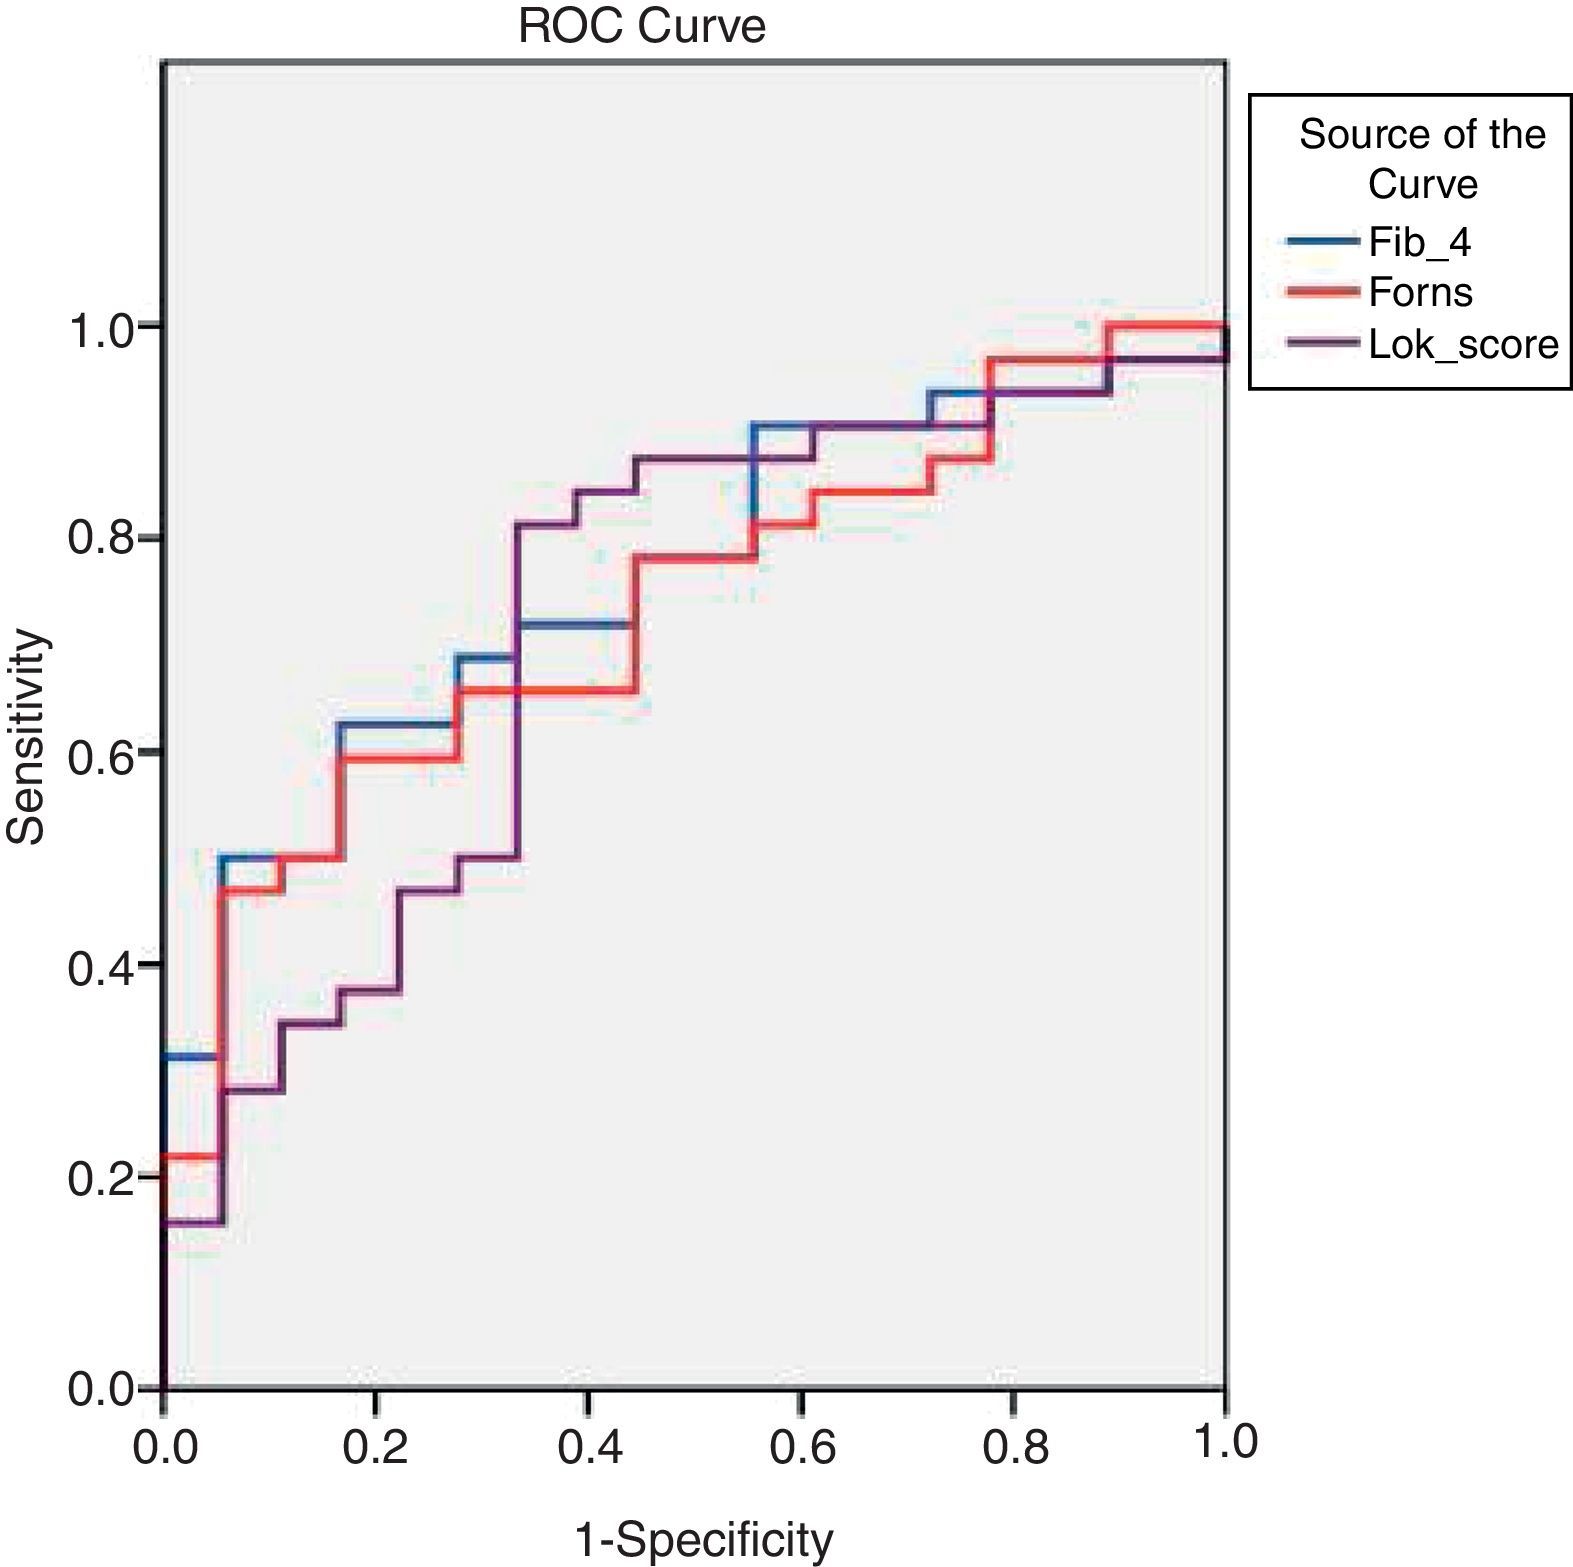
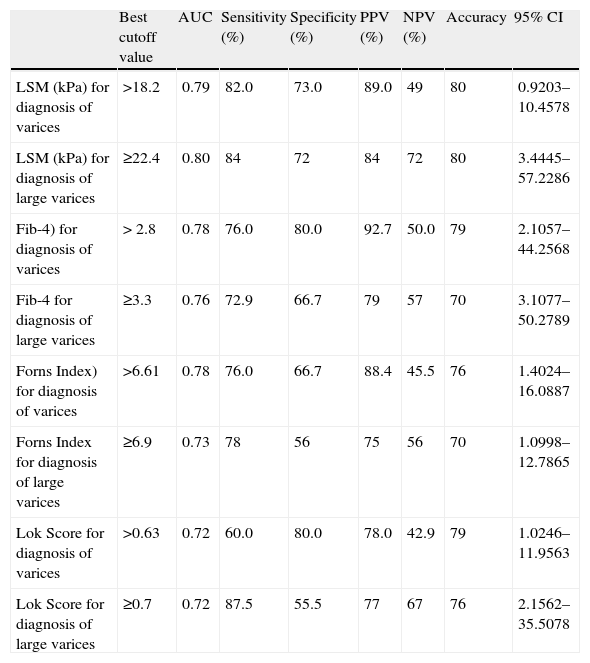
By applying ROC curves, the sensitivity, specificity and accuracy of LSM, Fib-4, Forns Index and Lok Score as noninvasive predictors of EV and LEV were studied, and the cutoff values with the best sensitivity and specificity were determined (Table 5, Figs. 1 and 2).
Accuracy of LSM and serum fibrosis scores in diagnosis of esophageal varices and large varices.
| Best cutoff value | AUC | Sensitivity (%) | Specificity (%) | PPV (%) | NPV (%) | Accuracy | 95% CI | |
| LSM (kPa) for diagnosis of varices | >18.2 | 0.79 | 82.0 | 73.0 | 89.0 | 49 | 80 | 0.9203–10.4578 |
| LSM (kPa) for diagnosis of large varices | ≥22.4 | 0.80 | 84 | 72 | 84 | 72 | 80 | 3.4445–57.2286 |
| Fib-4) for diagnosis of varices | > 2.8 | 0.78 | 76.0 | 80.0 | 92.7 | 50.0 | 79 | 2.1057–44.2568 |
| Fib-4 for diagnosis of large varices | ≥3.3 | 0.76 | 72.9 | 66.7 | 79 | 57 | 70 | 3.1077–50.2789 |
| Forns Index) for diagnosis of varices | >6.61 | 0.78 | 76.0 | 66.7 | 88.4 | 45.5 | 76 | 1.4024–16.0887 |
| Forns Index for diagnosis of large varices | ≥6.9 | 0.73 | 78 | 56 | 75 | 56 | 70 | 1.0998–12.7865 |
| Lok Score for diagnosis of varices | >0.63 | 0.72 | 60.0 | 80.0 | 78.0 | 42.9 | 79 | 1.0246–11.9563 |
| Lok Score for diagnosis of large varices | ≥0.7 | 0.72 | 87.5 | 55.5 | 77 | 67 | 76 | 2.1562–35.5078 |
LSM=liver stiffness measurement; AUC=area under the curve; PPV=positive predictive value; NPV=negative predictive value; 95%CI=95% confidence interval.


TE (fibroscan) could diagnose EV at a cutoff value of 18.2kPa. Fib-4, Forns Index, and Lok Score could diagnose EV at cutoff values of 2.8, 6.61 and 0.63, respectively (Table 5).
Among all noninvasive predictors of LEV, the LSM gave the highest accuracy at a cutoff value of 22.4kPa (Table 5).
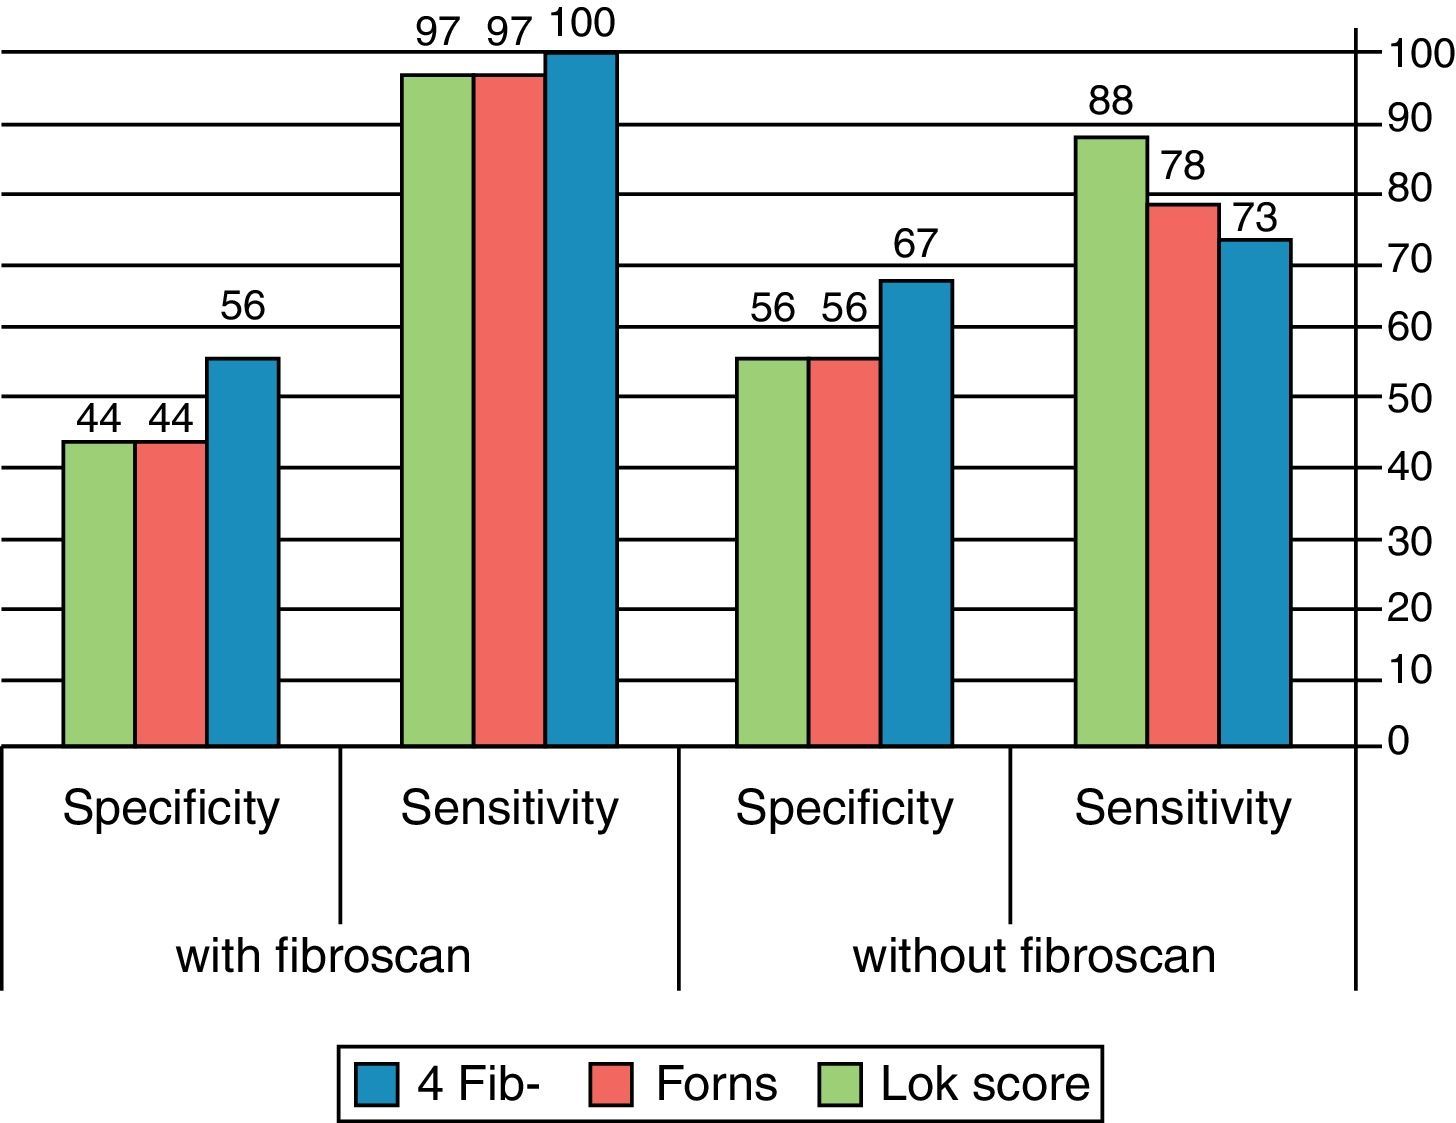
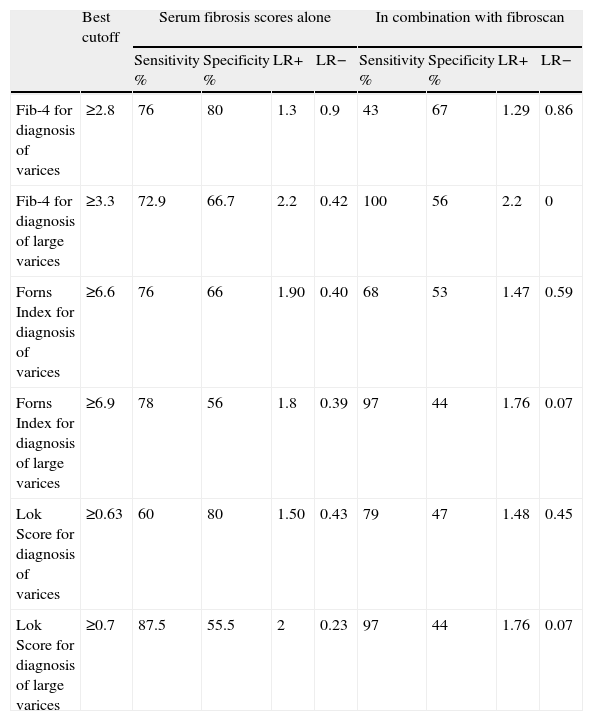
For detection of esophageal varices, addition of fibroscan to either Fib-4 or Forns Index improved neither the sensitivity nor the specificity. On the contrary, combination of Lok score with Fibroscan increased the sensitivity from 60% (in case of Lok Score alone) to 79% with much decrease in the specificity from 80% (in case of Lok Score alone) to 47%.
For diagnosis of large varices, combination of Fib-4 with fibroscan increased the sensitivity from 72.9% (in case of Fib-4 alone) to 100%. Combination of Forns Index with fibroscan increased the sensitivity from 78% (in case of Forns Index alone) to 97% and combination of Lok Score with fibroscan increased the sensitivity from 87.5% (in case of Lok Score alone) to 97% with mild decrease in the specificity. Indeed, this combination decreased the LR− in all tests. (Table 6, Fig. 3).
Accuracy of diagnosis of esophageal varices and large esophageal varices by combining LSM and serum fibrosis scores.
| Best cutoff | Serum fibrosis scores alone | In combination with fibroscan | |||||||
| Sensitivity % | Specificity % | LR+ | LR− | Sensitivity % | Specificity % | LR+ | LR− | ||
| Fib-4 for diagnosis of varices | ≥2.8 | 76 | 80 | 1.3 | 0.9 | 43 | 67 | 1.29 | 0.86 |
| Fib-4 for diagnosis of large varices | ≥3.3 | 72.9 | 66.7 | 2.2 | 0.42 | 100 | 56 | 2.2 | 0 |
| Forns Index for diagnosis of varices | ≥6.6 | 76 | 66 | 1.90 | 0.40 | 68 | 53 | 1.47 | 0.59 |
| Forns Index for diagnosis of large varices | ≥6.9 | 78 | 56 | 1.8 | 0.39 | 97 | 44 | 1.76 | 0.07 |
| Lok Score for diagnosis of varices | ≥0.63 | 60 | 80 | 1.50 | 0.43 | 79 | 47 | 1.48 | 0.45 |
| Lok Score for diagnosis of large varices | ≥0.7 | 87.5 | 55.5 | 2 | 0.23 | 97 | 44 | 1.76 | 0.07 |
LSM=liver stiffness measurement; LR+=likelihood positive ratio; LR−=likelihood negative ratio.
.")
By multivariate logistic regression analysis, fibroscan was found to be the most reliable predictor for diagnosis of esophageal varices and large varices.
DiscussionIdentification of patients with esophageal varices by periodic endoscopic examination is of utmost importance because this allows selection of patients who should receive prophylactic treatment. However, endoscopy is an invasive procedure that is not easily accepted by all patients.18 The use of the noninvasive predictors will help physicians to restrict the number of endoscopic examinations.
Many studies have been performed examining the relationship of liver stiffness to size and presence of esophageal varices.19–21 For the diagnosis of variceal presence, AUROC curves varied from 0.76 to 0.85, with sensitivities of 84–95%, specificities of 43–78%, PPV 57–89%, and NPV 66–91% using cutoffs between 13.9 and 21.5kPa. For the diagnosis of large esophageal varices, AUROC varied from 0.76 to 0.87, with sensitivities of 77–91%, specificities of 60–85%, PPV 48–56% and NPV 94–95% using cutoffs between 19 and 30.5kPa.
Castera et al.22 stated that although TE had been initially proposed to assess liver fibrosis, a good correlation had been reported between liver stiffness values and HVPG as well as the presence of esophageal varices, suggesting that it could be an interesting tool for the non-invasive evaluation of portal hypertension.
The current study showed that LSM values increased with the presence and the grade of varices (P; 0.001and 0.000, respectively). LSM can diagnose the presence of esophageal varices at a cutoff of 18.2kPa with sensitivity of 82%, specificity of 73%, PPV of 89%, NPV of 49% and an overall accuracy of 80%. At an AUROC of 0.801, a cutoff value of 22.4kPa predicted the presence of LEV with sensitivity of 84%, specificity 72%, PPV 84%, NPV 72% and overall accuracy 80%.
Serum fibrosis scores as Fib-4, Forns Index and Lok Score were confirmed as a good noninvasive marker of liver fibrosis for chronic hepatitis C.23,24
In our cohort of HCV-induced cirrhotic patients, it was found that Fib-4, Forns Index and Lok Score values correlated significantly with the presence and the grades of esophageal varices (Tables 2 and 3).
Fib-4 had been examined for the prediction of EV in patients with cirrhosis, having an AUROC of 0.64 for the prediction of EV at a cutoff value of 3.5, while for the diagnosis of LEV the AUROC was 0.63 and the cutoff value 4.3.25 In another study, for predicting EV, they used a cutoff value of 3.98 and the AUROC was 0.624; for the diagnosis of LEV they used a cutoff value of 6.75.26 In the current study, we proposed a very low cutoff (2.8) which showed sensitivity 76%, specificity 80%, PPV 92.7%, NPV 50% and an overall accuracy 79%.
We used a cutoff value of 3.3 for which the AUROC was 0.762 for the diagnosis of LEV with 72.9% sensitivity, 66.7% specificity, 79% PPV, 57% NPV and 70% overall accuracy.
Previous studies investigating Forns Index as a predictor for EVs in LC patients showed that; for a cutoff value of 8.5, the AUROC for predicting EVs was 0.74. For diagnosing LEV, its performance was not good: 0.61 AUROC for a cutoff value of 8.8.25 Another study proposed a cutoff of 7.3 for an AUROC of 0.648 for the diagnosis of any grade EV, while using a cutoff value of 8.5, the AUROC for predicting LEV was 0.645.26 Our study proposed a cutoff value of 6.61 for the diagnosis of esophageal varices. At this cutoff the sensitivity was 76%, specificity was 66.7%, PPV was 88.4%, NPV was 45.5% and the overall accuracy was 76%. We also proposed a cutoff of 6.9 for the diagnosis of LEV at which sensitivity was 78%, specificity was 56% and the overall accuracy was 70%. AUROC was 0.73.
Lok Score had been considered a very satisfactory predictor of EV. At a cutoff value of 0.9, the Lok Score had an AUROC of 0.77 for the diagnosis of EV, while for a cutoff value of 1.5, the AUROC was 0.69 for the prediction of LEV.25 In another prospective study, the best cutoff value for the diagnosis of LEV was 0.8, with an AUROC of 0.731 and a NPV of 86.4%.26 In the current study, a cutoff value of 0.63 was proposed for diagnosis of EV. At this cutoff, the sensitivity was 60%, specificity was 80%, PPV was 78%, NPV was 42.9% and the overall accuracy was 79%. We also proposed a cutoff of 0.72 for the diagnosis of LEV at which sensitivity was 87.5%, specificity was 55.5% and the overall accuracy was 76%. AUROC was 0.72.
By multivariate logistic regression analysis, fibroscan was found to be the most reliable predictor of esophageal varices (P; 0.007) and large esophageal varices (P; 0.025).
This study had the privilege over others in that all patients had cirrhosis secondary to hepatitis C (avoiding the bias in LSM values caused by different etiologies of CLD).
Castera et al.19 indirectly suggested that the association between TE and Lok Score would be valuable for increasing the diagnostic performance. In the current study, we tested the association between LSM and serum fibrosis scores for the prediction of esophageal varices and large varices. Adding TE to each of the other diagnostic indices (serum fibrosis scores) increased their sensitivities for diagnosis of large varices. Moreover, this combination decreased the LR− in all tests.
ConclusionEndoscopy is still the gold standard for the diagnosis of esophageal varices, but the noninvasive predictors; TE, Fib-4, Forns Index and Lok Score can be used by physicians to restrict endoscopy to those patients who are highly suspected of having esophageal varices. TE was found to be the most reliable predictors of esophageal varices and large esophageal varices. Adding TE to, Fib-4, Forns Index and Lok Score may be beneficial in the diagnosis of large esophageal varices. More studies are needed on a larger sample of HCV-related liver cirrhosis patients to determine a cutoff value that can be safely recommended for the noninvasive diagnosis of esophageal varices.
Conflict of interestThe authors declare no conflict of interest.
We gratefully acknowledge the workers in the Fibroscan and endoscopy units who were very cooperative throughout the work