


This paper evaluates the effect of diversification strategy on corporate value for a sample of Italian companies. It accounts for both the level of diversification and relatedness components. Empirical analyses show a U-shaped curvilinear relationship between diversification and value. In contrast to the mainstream literature, our results highlight that related diversification has a negative effect, while unrelated diversification is a value-creating strategy.
The relationship between diversification strategies and firm performance has been the object of scientific investigation for several decades and by a wide variety of authors. Until the end of the 1990s, the vast majority of corporate finance studies on the subject agreed with the conclusion that diversified firms are generally traded at a discount compared to focused firms operating in the same business (Scharfstein & Stein, 2000, p. 2537). However, in the last few years, a growing number of studies have challenged these conclusions, thus contributing to a renewed interest among the scientific community in this area of research (He, 2009; Hoechle, Schmid, Walter, & Yermack, 2012; Kuppuswamy & Villalonga, 2016; Villalonga, 2004a, 2004b).
On a geographic basis, many analyses have been conducted (Claessens, Djankov, Fan, & Lang, 1999; Fauver, Houston, & Naranjo, 2003; Fuente & Velasco, 2015; Hernández-Trasobares & Galve-Górriz, 2017; Lins & Servaes, 1999, 2002) with the aim of verifying the emerging hypotheses, but no analysis has been conducted on the Italian market. The aim of this paper is to fill this gap by testing the main hypotheses proposed in the literature on the Italian industrial context. The Italian context seems to be particularly rich and of special interest for research application on account of the many peculiarities that distinguish it not only from the countries of Anglo-Saxon tradition but also from other countries in continental Europe.
First of all, the Italian governance structure is characterized by the large number of family-owned businesses (Barca & Becht, 2001; La Porta, Lopez de Silanes, Shleifer, & Vishny, 1999), with others in the hands of business groups that, in agreement with financial institutions and by means of pyramidal systems and non-voting shares, control a large number of firms with a relatively small amount of capital. The main agency problem concerns the conflict of interest between large shareholders and minority shareholders. In this regard, diversification may mitigate or exacerbate such opportunistic problems.
Secondly, the Italian economic environment presents a large number of elements of inefficiency in the allocation of funds: the number of listed firms is relatively small in comparison to that of other countries which have a similar gross domestic product (Carpenter & Rondi, 2000). Italy has a bank-based economy with a low presence of institutional investors in the financial markets. In this context, the combination of benefits and costs related to diversification could be significant (Prowse, 1990). The benefits provided by diversification strategies which arise from internal capital markets can be larger with such significant external capital market constraint and imperfections (Khanna & Palepu, 1997).
The paper focuses on a sample of 76 Italian listed firms from 1987 to 2007, with the aim of investigating the relationship between diversification, both related and unrelated, and firm performance. Controlling for endogeneity problems, we demonstrate that the role of product diversification in shaping firm value is different compared to the main results based on US data. It shows that diversification can have a negative effect, mainly due to inefficient decision-making with regards to diversifying into related segments. By contrast, becoming a conglomerate improves the value of the firm, due to the poor financial market that characterizes Italy and the benefits provided by an internal capital market. In our view, contributing toward the research literature on the heterogeneity of the value of diversification across different geographical and/or institutional contexts is of great interest. Given the dominance of US data, this paper presents some very interesting evidence with respect to the Italian context.
The present work is structured as follows: in Section 1, we present a literature review which identifies the main hypotheses. In Section 2, the methodology, the models applied and the variables used are described. In Section 3, we present the data, the sample selection and the descriptives. Section 4 presents the main findings. Finally, the last section summarizes and concludes the paper.
2Literature review and hypothesisThe relationship between diversification and performance has long been a central topic of research on strategic management (Ansoff, 1958; Datta, Rajagopalan, & Rasheed, 1991; He, 2009; Hoechle et al., 2012; Hoskisson & Hitt, 1990; Kuppuswamy & Villalonga, 2016; Palich, Cardinal, & Miller, 2000; Ramanujam & Varadarajan, 1989). In spite of the persistent efforts from researchers over the years, clear-cut conclusions remain evasive. Although a few papers, including the article published by Hernández-Trasobares and Galve-Górriz (2017), did not find any statistically significant linkage, the connection between diversification and performance depends on the way in which the benefits and costs related to this corporate strategy are combined. Firms choose to diversify their activities in more businesses when the benefits of diversification overcome its costs, while if the opposite occurs, companies prefer to stay focused. Hoechle et al. (2012, p. 43) find a significant diversification discount and a large amount of this discount can be explained by corporate governance variables, “… better corporate governance is associated with less value destruction (or more value creation) when diversifying mergers occur”.
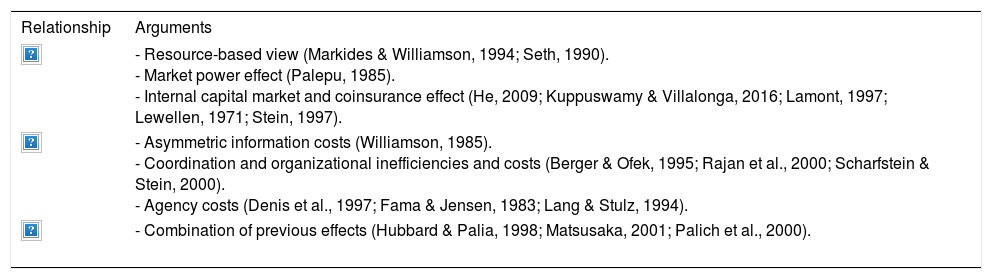
A short overview of the literature follows, in accordance with the need to explain the research hypothesis, while a broad review of the literature is provided by Ramanujam and Varadarajan (1989), Hoskisson and Hitt (1990), Datta et al. (1991) and more recently by Martin and Sayrak (2003) and He (2009, 2012). In particular, the main effect of diversification as a whole on firm value is explained in Appendix A.
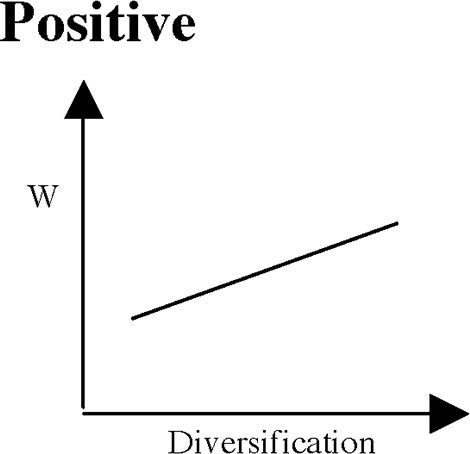
2.1Positive relationship between diversification and valueOne stream of research points to diversification as a value-increasing strategy for the firm. In this case, the hypothesis is that “corporate diversification has a positive impact on firm value.” According to this view, the benefits of diversification outweigh the possible costs (Gertner, Scharfstein, & Stein, 1994; Villalonga, 2004b). This was the traditional view in the industrial organization literature that considered diversification and performance to be linearly and positively related (Gort, 1962). From the resource-based perspective, diversification provides operational synergies (Markides & Williamson, 1994) based on economies of scale and scope (Panzar & Willig, 1981), increasing efficient ways of organizing economic activities. From a market power perspective, diversification can be based on anticompetitive motives against competitors (Seth, 1990). According to a financial approach, there should be a coinsurance effect, providing risk reduction derived from combining businesses whose cash flows are less than perfectly correlated (Lewellen, 1971). In addition, the diversification strategy provides a superior means of funding an internal capital market (Lamont, 1997; Stein, 1997).1 Consistent with the internal capital market hypothesis, He (2009) finds that diversification leads to a value premium in the post-1997 period. In addition, Kuppuswamy and Villalonga (2016) provide new evidence on the efficiency of internal capital markets during the 2007–2009 financial crisis.H1 Product diversification has a positive effect on firm value.
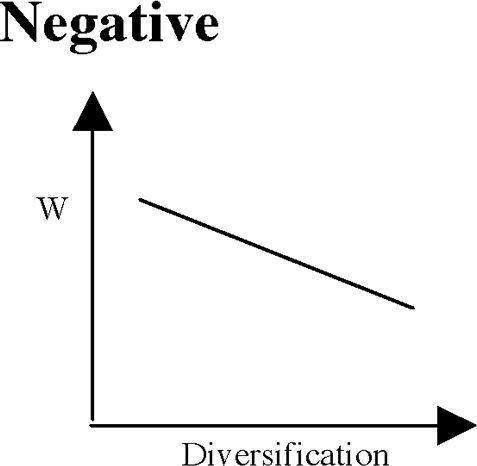
An opposite stream of research that theorizes a prevalence of the costs of diversification rather than its benefits is based on the evidence obtained in the corporate finance literature. It considers diversification to be a value-destroying strategy, and multi-segment firms are traded at a discount (Berger & Ofek, 1995; Lamont & Polk, 2000; Lang & Stulz, 1994; Rajan, Servaes, & Zingales, 2000; Servaes, 1996). Due to the fact that the costs of diversification outweigh the possible benefits, it is assumed that “corporate diversification has a negative impact on firm value”. According to an inefficiency narrative, diversified firms do a worse job of allocating their resources than focused firms (Lamont, 1997; Rajan et al., 2000; Seth, 1990) as a result of information asymmetry between headquarters and divisions, power struggles between divisions and, in general, higher coordination and control costs over the managers. With regard to the agency theory, diversification can somehow exacerbate managerial agency problems that result from the pursuit of managerial self-interest strategies at the expense of stockholders (Denis, Denis, & Sarin, 1997; Fama & Jensen, 1983; Lang & Stulz, 1994).H2 Product diversification has a negative effect on firm value.
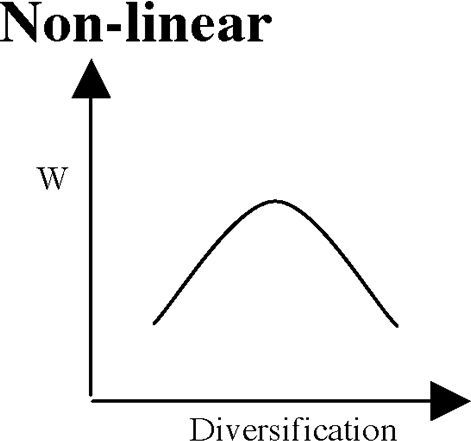
The combination of benefits and costs can provide a changing net result according to the different levels of diversification. In particular, it is possible to observe a non-linear relationship between diversification and firm value by identifying an optimum level of diversification and balancing the benefits and costs of a diversification strategy (Jones & Hill, 1988). For low levels of diversification, expansion into product lines could be expected to improve firm value by better exploiting economies of scale and scope. However, we might observe diminishing marginal returns owing to costs arising from potential organizational inefficiencies, coordination and governance costs, and shirking (imperfect monitoring). Therefore, we should observe an inverted-U shape (Grant, Jammine, & Thomas, 1988). Palich et al. (2000) suggest that diversification has a positive effect on value, but the returns fall beyond the point at which the optimal level is reached.H3 Product diversification has a curvilinear effect on firm value.
The abovementioned theoretical motivations underline the benefits and costs of diversification, which are not mutually exclusive, so it is not surprising that empirical works have found it difficult to differentiate between them. The controversial outcomes could be driven by the lack of due consideration and control of the type of diversification. Distinguishing between related and unrelated diversification is crucial in order to explore the effect on a firm's value.2
Related diversification is based on operational synergies related to: (1) resource sharing in the value chains among businesses and (2) the transfer of skills, which involves the transfer of knowledge from one value chain to the other. Thus, related diversification is based on the sharing and transfer of skills connected to tangible (plant and equipment, sales forces, and distribution channels) and intangible resources (brand names, innovative capabilities, and know-how). Conversely, unrelated diversification is associated with the financial synergies hypothesis, which states that firms diversify in order to benefit from the economies of an internal capital market and an internal labor market, to obtain tax benefits, and to reduce business risk (coinsurance argument). Financial resources, which are more mobile and less rare and are thus likely to create less value than other types of resources (Hoskisson & Hitt, 1990), are associated with unrelated diversification. Related diversification strategies are theoretically and empirically connected to positive effects on firm value. Alternatively, unrelated diversification strategies are theoretically connected to a positive or negative effect on firm value, while empirically, a dominant negative sign appears. This leads to the following hypotheses:H4 Related diversification has a positive effect on firm value. Unrelated diversification can have a positive or negative effect on firm value.
The empirical analysis took into account the effect of the degree and direction of related as well as unrelated diversification on corporate value. The following model was applied:

Corporate value is commonly approximated by certain measures of performance. We used three financial performance measures. Model A is focused on the measurement of the relationship between diversification and value revealed by an accounting-based measure of performance (Tallman & Li, 1996). Accounting-based performance measures are derived from the annual statements and reflect the firm's past performance. In model A, we considered the variable ROA, defined as earnings before interest and taxes (EBIT) relative to total assets. As this measure is strongly influenced by the accounting standards employed and can be subject to managerial manipulation, we have also used the market-to-book ratio (MtB), which is used as a forward-looking measure of firm performance that incorporates both accounting-based and market-based elements (Nayyar, 1992) reflecting investors’ valuation of both the tangible and intangible assets of the firm. The main drawback of this measure is that it restricts the study to listed companies.
In order to measure diversification, it was crucial to identify the degree of diversification and associated relatedness. This was done by using the number of business segments to define product diversification, taking into account the amount of sales in each business segment and identifying the degree of relatedness for each segment. In Italy, diversification is classified in accordance with the Standard Industrial Codes (S.I.C.). Specifically, entropy indicators were employed in the empirical analysis as the main measures to operationalize diversification, as they allowed the objectivity of the product-count measures to be combined with the ability to apply the relatedness concept categorically, weighting the businesses by the relative size of their sales (Palepu, 1985). Entropy measures simultaneously consider the number of businesses in which a firm operates, the distribution of a firm's total sales across industry segments, and the different degrees of relatedness among the various industries (the relative importance of each segment to firm sales). We used the total diversification index (DT) to measure the complete level of diversification of a firm. The entropy measure of the total level of diversification (DT) is calculated as ∑Pj*ln1Pj, where P refers to the proportion of sales in business segment j, and ln(1/Pj) is the weight for that segment. Moreover, the DT variable is a better diversification measure compared to the Herfendahl index because, as it is able to measure the degree of relatedness among the various industries, it can be broken down into the related and unrelated components of diversification. DR is the related diversification index that results from businesses in different 3- or 4-digit segments within a 2-digit industry group. For example, Barilla operates in the pasta production industry and in the sauce industry, which are different 4-digit industries, but both are related. On the other hand, DU is the unrelated diversification index that results from businesses in different 2-digit industry groups. Villalonga (2004a, 2004b) claimed that in many studies on diversification, there were some issues in the collection and treatment of data. The related diversification index (DR) and the unrelated diversification index (DU) take into account the roles of all business units in which the firm is involved without over-emphasizing only those business segments with higher proportions of sales. To avoid the mechanical treatment of data, we used some rational adjustment together with the difference in the numbers of digits in the Ateco Code to appreciate the type of diversification. We considered two businesses to be related when they provided a product or service to a similar group of customers, sharing the same technology in the production system or operating in the same industry as the client and supplier. Therefore, the direct effect of DT, DR and DU on corporate value was investigated. The empirical analysis is run as follows, relying on ROA and the market-to-book ratio (MtB) alternatively as the dependent variable.
The general model is based on the effect of the entropy measure of total diversification to appreciate the existence of a positive or negative relationship between diversification and value (model 1):

In the model, the subscript i refers to the firm, t refers to the time period and ¿it represents the random disturbance. In addition, to see if the combination of benefits and costs of diversification can have different effects according to the level of diversification, a non-linear relationship is appreciated through the inclusion in the model of the squared value of the DT variable (DT2), to verify the existence of a non-monotonic effect (model 2):

Moreover, to appreciate the different effects of the types of diversification, related and unrelated, the entropy measures of related diversification (DR) and unrelated diversification (DU) are tested in model 3, without the presence of the total diversification variable (DT):

In the analysis, we control for other firm characteristics, which have been traditionally considered in the literature as determinants of corporate value. Theoretical and empirical studies have shown that corporate value is affected by leverage (as the ratio between financial debt scaled by total asset), tangibility (as the ratio between tangible fixed asset scaled by total asset), age (the natural logarithm of the firm's age), foreign sales (as the ratio between sales in foreign countries scaled by total sales), size (as the natural logarithm of total assets), growth opportunity (as sales growth) and ownership (as the percentage of shares held by the principal shareholder).
There are several econometric issues to address. The estimation method was selected to avoid unobservable heterogeneity and endogeneity. For example, Campa and Kedia (2002) found that the diversification discount becomes a premium when endogeneity is considered in the analysis. Therefore, the panel data estimation by the Generalized Method of Moments (GMM) allows us to study the dynamic nature of performance at the firm level, thereby eliminating unobservable heterogeneity and controlling for the endogeneity problem. As suggested by Blundell and Bond (1998), we used the GMM in the system estimator. All of the right-hand-side variables are used in the models, with two and three lags, as instruments. Specifically, to eliminate the individual effect, we took first differences of the variables, and then we estimated the models thus obtained. This approach is correct if there is no second-order serial correlation between the error terms of the first-differenced equation. In our models, this hypothesis of second-order serial correlation is always rejected. The statistics m1 and m2 were used to test for the lack of serial correlation (for completeness, we also tested for a lack of first-order serial correlation through the m1 test). With respect to the instruments, the Sargan statistic, which tests for the presence of over-identifying restrictions and for the validity of instrumental variables, is reported.
4Data and descriptivesThe analysis is based on the data provided by Mediobanca – Ricerche & Studi (RS). The RS Directory is an annual publication that contains a broad range of high-quality financial and non-financial information on the largest companies based in Italy in terms of total assets and value added, and whose aim is to provide a fully comprehensive financial profile of their operations, enabling the user to gain in-depth knowledge of the leading Italian companies. The sample consisted of an unbalanced panel made up of 76 Italian listed firms evaluated in the period from 1987 to 2007. Firms belonging to the financial services industry were excluded. The sample was comprised of 690 observations. This is a unique database, created using RS books until 2000 and PDF files until 2007. RS is the only database on Italy with details on the numbers and the amount of sales for each business segment that allows an analysis of corporate diversification, and hence allowed us to obtain all of the data available with the features we required.
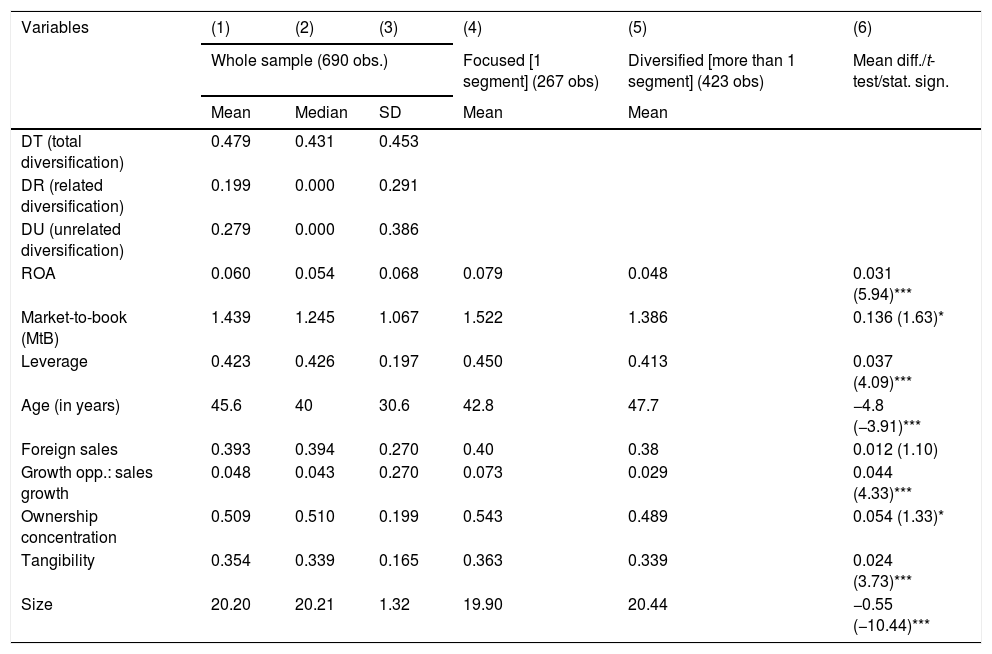
Table 1, columns (1), (2) and (3), show the main descriptives for the variables used in the analysis sorted by the whole sample and the listed sample.
Descriptives for the whole sample and the listed sample.
| Variables | (1) | (2) | (3) | (4) | (5) | (6) |
|---|---|---|---|---|---|---|
| Whole sample (690 obs.) | Focused [1 segment] (267 obs) | Diversified [more than 1 segment] (423 obs) | Mean diff./t-test/stat. sign. | |||
| Mean | Median | SD | Mean | Mean | ||
| DT (total diversification) | 0.479 | 0.431 | 0.453 | |||
| DR (related diversification) | 0.199 | 0.000 | 0.291 | |||
| DU (unrelated diversification) | 0.279 | 0.000 | 0.386 | |||
| ROA | 0.060 | 0.054 | 0.068 | 0.079 | 0.048 | 0.031 (5.94)*** |
| Market-to-book (MtB) | 1.439 | 1.245 | 1.067 | 1.522 | 1.386 | 0.136 (1.63)* |
| Leverage | 0.423 | 0.426 | 0.197 | 0.450 | 0.413 | 0.037 (4.09)*** |
| Age (in years) | 45.6 | 40 | 30.6 | 42.8 | 47.7 | −4.8 (−3.91)*** |
| Foreign sales | 0.393 | 0.394 | 0.270 | 0.40 | 0.38 | 0.012 (1.10) |
| Growth opp.: sales growth | 0.048 | 0.043 | 0.270 | 0.073 | 0.029 | 0.044 (4.33)*** |
| Ownership concentration | 0.509 | 0.510 | 0.199 | 0.543 | 0.489 | 0.054 (1.33)* |
| Tangibility | 0.354 | 0.339 | 0.165 | 0.363 | 0.339 | 0.024 (3.73)*** |
| Size | 20.20 | 20.21 | 1.32 | 19.90 | 20.44 | −0.55 (−10.44)*** |
Notes: (*), (**) and (***) indicates that coefficients are significant at 10, 5 and 1 percent level, respectively.
Some variables, such as leverage, appear to be symmetrically distributed, while others, such as the diversification measures, are rather asymmetrically distributed. The majority of these diversified firms adopted an unrelated strategy.
Table 1, columns (4), (5) and (6) compare the main descriptives, sorting the samples by the number of business segments in order to define diversity. Specifically, it compares the results for firms that are focused (specializing in one industry) or diversified (operating in two or more industries).
Some interesting differences arise from comparing focused firms and diversified firms. The t-test of the difference between the means shows significant relevance with a tolerance of 10%. Diversified firms have lower ROA and market-to-book ratio compared to the focused firms, they have less ownership concentration and tangibility, and they are also larger in size.
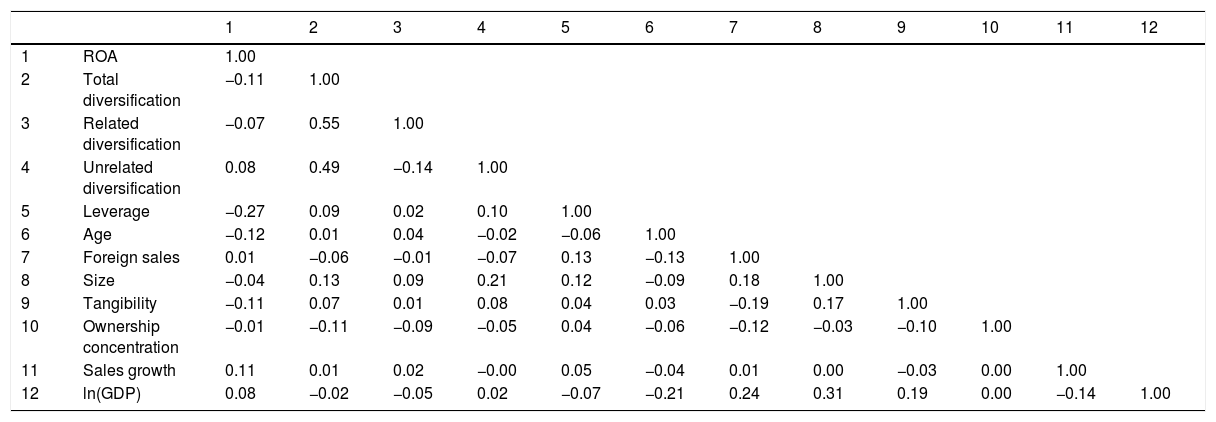
Table 2 shows an absence of significant correlations between variables that could affect the validity of the econometric results. Using variance inflation factor (VIF) analysis (not reported), the result shows no potential multicollinearity problem.
Correlation matrix.
| 1 | 2 | 3 | 4 | 5 | 6 | 7 | 8 | 9 | 10 | 11 | 12 | ||
|---|---|---|---|---|---|---|---|---|---|---|---|---|---|
| 1 | ROA | 1.00 | |||||||||||
| 2 | Total diversification | −0.11 | 1.00 | ||||||||||
| 3 | Related diversification | −0.07 | 0.55 | 1.00 | |||||||||
| 4 | Unrelated diversification | 0.08 | 0.49 | −0.14 | 1.00 | ||||||||
| 5 | Leverage | −0.27 | 0.09 | 0.02 | 0.10 | 1.00 | |||||||
| 6 | Age | −0.12 | 0.01 | 0.04 | −0.02 | −0.06 | 1.00 | ||||||
| 7 | Foreign sales | 0.01 | −0.06 | −0.01 | −0.07 | 0.13 | −0.13 | 1.00 | |||||
| 8 | Size | −0.04 | 0.13 | 0.09 | 0.21 | 0.12 | −0.09 | 0.18 | 1.00 | ||||
| 9 | Tangibility | −0.11 | 0.07 | 0.01 | 0.08 | 0.04 | 0.03 | −0.19 | 0.17 | 1.00 | |||
| 10 | Ownership concentration | −0.01 | −0.11 | −0.09 | −0.05 | 0.04 | −0.06 | −0.12 | −0.03 | −0.10 | 1.00 | ||
| 11 | Sales growth | 0.11 | 0.01 | 0.02 | −0.00 | 0.05 | −0.04 | 0.01 | 0.00 | −0.03 | 0.00 | 1.00 | |
| 12 | ln(GDP) | 0.08 | −0.02 | −0.05 | 0.02 | −0.07 | −0.21 | 0.24 | 0.31 | 0.19 | 0.00 | −0.14 | 1.00 |
Note: Correlations greater than 0.038 or lower than −0.038 are statistically significant at the 0.05 level or lower.
This section presents the results obtained by estimating the models with the GMM technique. The key identifying assumption that there is no serial correlation in the error terms was verified by testing for the absence of a second-order serial correlation in the first residuals. The Hansen statistic, which confirms the absence of a correlation between the instruments and the error term, as well as the AR2 tests, suggested that the feature of our model for the sample of Italian firms was valid, well-specified, and consistent.
We applied the empirical models to two performance measures as dependent variables. We showed the results using ROA and the MtB ratio as dependent variables. We first showed the results of our basic model. Then, we incorporated the square of the diversification variable into the model. Finally, the results concerning relatedness are provided.
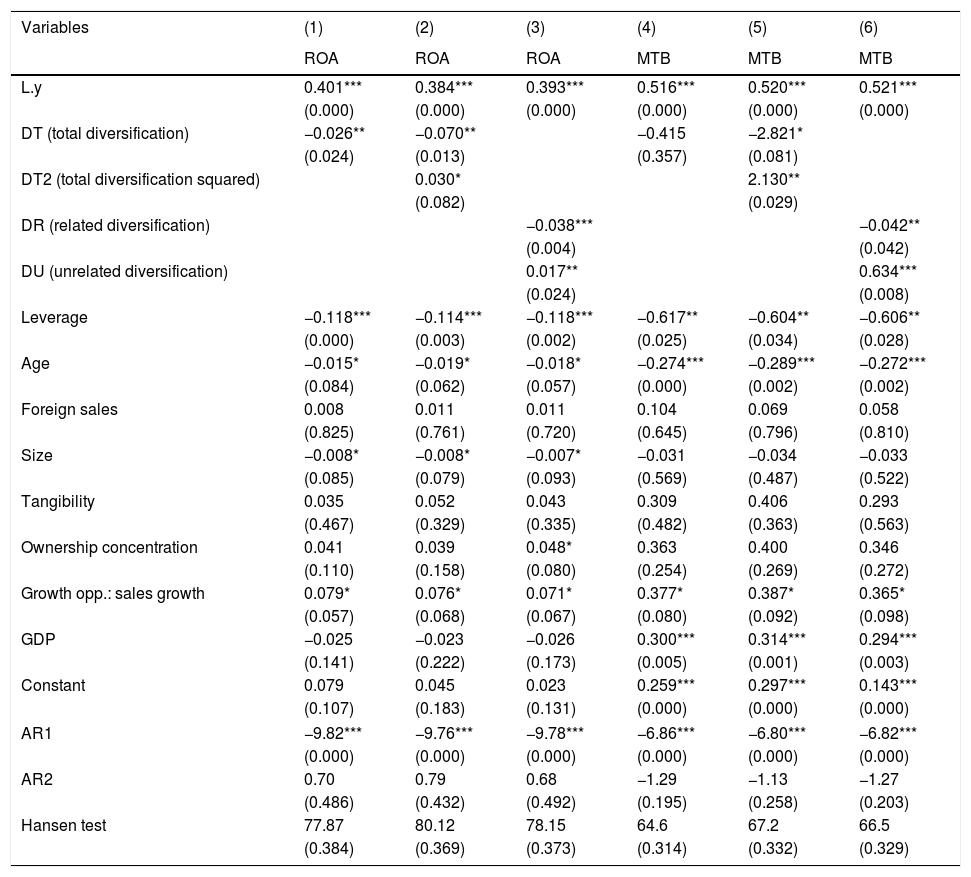
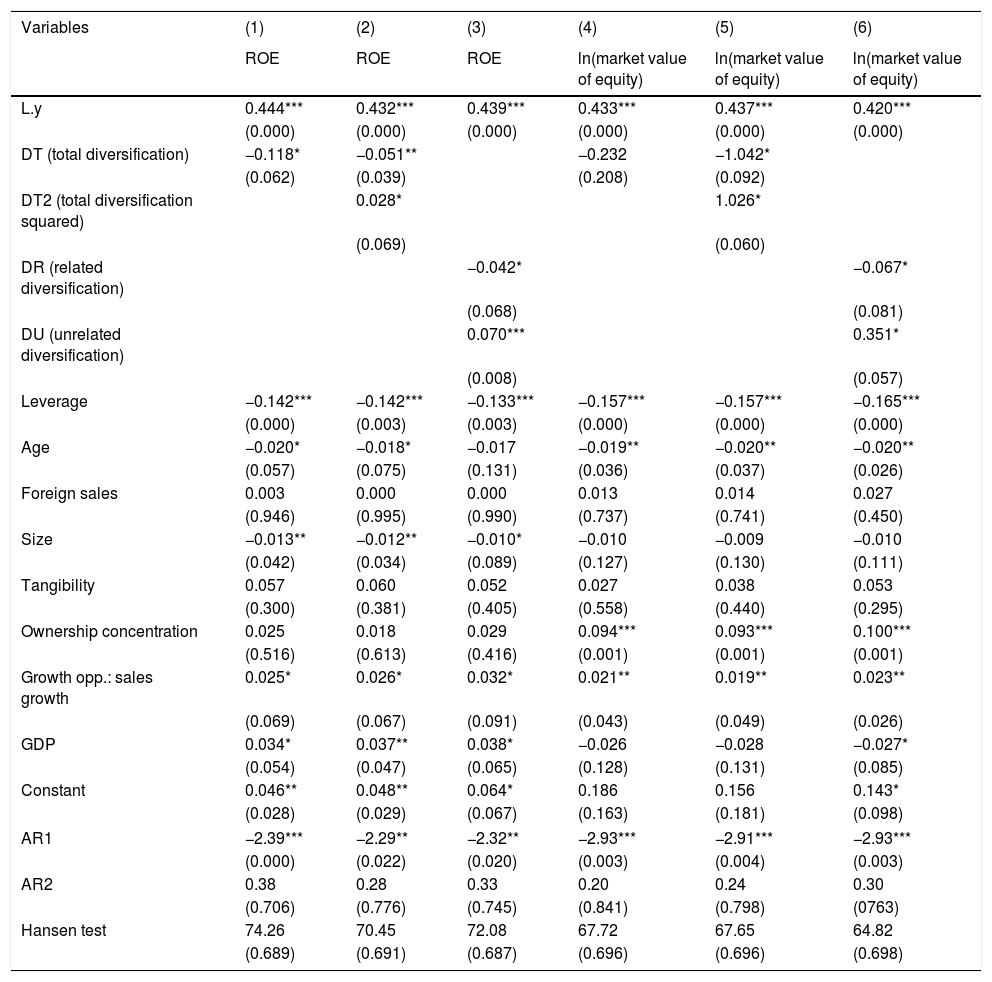
Table 3 shows the GMM results, which follow the same general lines when we consider both ROA and MTB as dependent variables. Columns (1) and (4) of Table 3 suggest that more diversified firms tend to have lower profitability or, equivalently, a higher focus on the core business provides greater profitability. As shown in columns (2) and (5) of Table 3, the non-monotonic relationship appears to be significant. Although a prevalent negative relationship occurs, a counterbalancing effect between the benefits and costs of diversification is shown. According to Grant et al. (1988) and Markides (1996), our findings show that there is an optimal level of diversification. The direction of this non-monotonic relationship is significant, being negative at first and later becoming positive. The U-shaped relationship between diversification and performance, compared to the inverted U-shape that is theoretically and empirically known, seems to be rather difficult to justify. In Italy, contrary to conventional wisdom, firm value first decreases and, after a certain breakpoint, then increases with the rise in the level of diversification. These results, as highlighted in columns (3) and (6) of Table 3, seem to be associated with the negative effect of related diversification and to the positive effect of unrelated diversification on performance. Some robustness is reported in Appendix B, based on ROE and the logarithm of the market value of equity. These results concur with those shown in Table 3.
The effect of diversification on firm value considering: ROA and MTB.
| Variables | (1) | (2) | (3) | (4) | (5) | (6) |
|---|---|---|---|---|---|---|
| ROA | ROA | ROA | MTB | MTB | MTB | |
| L.y | 0.401*** | 0.384*** | 0.393*** | 0.516*** | 0.520*** | 0.521*** |
| (0.000) | (0.000) | (0.000) | (0.000) | (0.000) | (0.000) | |
| DT (total diversification) | −0.026** | −0.070** | −0.415 | −2.821* | ||
| (0.024) | (0.013) | (0.357) | (0.081) | |||
| DT2 (total diversification squared) | 0.030* | 2.130** | ||||
| (0.082) | (0.029) | |||||
| DR (related diversification) | −0.038*** | −0.042** | ||||
| (0.004) | (0.042) | |||||
| DU (unrelated diversification) | 0.017** | 0.634*** | ||||
| (0.024) | (0.008) | |||||
| Leverage | −0.118*** | −0.114*** | −0.118*** | −0.617** | −0.604** | −0.606** |
| (0.000) | (0.003) | (0.002) | (0.025) | (0.034) | (0.028) | |
| Age | −0.015* | −0.019* | −0.018* | −0.274*** | −0.289*** | −0.272*** |
| (0.084) | (0.062) | (0.057) | (0.000) | (0.002) | (0.002) | |
| Foreign sales | 0.008 | 0.011 | 0.011 | 0.104 | 0.069 | 0.058 |
| (0.825) | (0.761) | (0.720) | (0.645) | (0.796) | (0.810) | |
| Size | −0.008* | −0.008* | −0.007* | −0.031 | −0.034 | −0.033 |
| (0.085) | (0.079) | (0.093) | (0.569) | (0.487) | (0.522) | |
| Tangibility | 0.035 | 0.052 | 0.043 | 0.309 | 0.406 | 0.293 |
| (0.467) | (0.329) | (0.335) | (0.482) | (0.363) | (0.563) | |
| Ownership concentration | 0.041 | 0.039 | 0.048* | 0.363 | 0.400 | 0.346 |
| (0.110) | (0.158) | (0.080) | (0.254) | (0.269) | (0.272) | |
| Growth opp.: sales growth | 0.079* | 0.076* | 0.071* | 0.377* | 0.387* | 0.365* |
| (0.057) | (0.068) | (0.067) | (0.080) | (0.092) | (0.098) | |
| GDP | −0.025 | −0.023 | −0.026 | 0.300*** | 0.314*** | 0.294*** |
| (0.141) | (0.222) | (0.173) | (0.005) | (0.001) | (0.003) | |
| Constant | 0.079 | 0.045 | 0.023 | 0.259*** | 0.297*** | 0.143*** |
| (0.107) | (0.183) | (0.131) | (0.000) | (0.000) | (0.000) | |
| AR1 | −9.82*** | −9.76*** | −9.78*** | −6.86*** | −6.80*** | −6.82*** |
| (0.000) | (0.000) | (0.000) | (0.000) | (0.000) | (0.000) | |
| AR2 | 0.70 | 0.79 | 0.68 | −1.29 | −1.13 | −1.27 |
| (0.486) | (0.432) | (0.492) | (0.195) | (0.258) | (0.203) | |
| Hansen test | 77.87 | 80.12 | 78.15 | 64.6 | 67.2 | 66.5 |
| (0.384) | (0.369) | (0.373) | (0.314) | (0.332) | (0.329) | |
Note: (*), (**) and (***) indicates that coefficients are significant at 10, 5 and 1 percent level, respectively. The test AR2 is second order autocorrelation of residuals under the null of no serial correlation. Hansen test is test of the overidentifying restrictions, under the null of instruments’ validity.
The negative impact of related diversification on firm value has possible justifications in the literature. Markides and Williamson (1996) suggest that a strategy of related diversification could be value-enhancing. This relatedness needs to be based on resource sharing and skill transfer in related businesses. In order to be beneficial, resource sharing and skill transfer have to be based on rare, not-imitable, valuable and not-substitutable resources. The lack of one of these properties can generate inefficiency and costs. These results can also be interpreted according to Nayyar (1992), who suggested that relatedness can fail to create value when the involved business units lack cooperation; problems in the communication of incentives or inefficiency in the allocation of joint costs generate impediments to relatedness exploitation. The negative relationship between related diversification and performance can be justified from a transaction costs perspective (Jones & Hill, 1988; Williamson, 1985). Inefficient intrafirm exchanges, coordination and agency costs among the business units, along with incentive distortions generated by intrafirm competition (rather than the necessary cooperation among managers) represent obstacles to performance and outweigh the benefits of relatedness. The decisions of Italian firms to realize related diversification can be motivated by opportunistic behaviors instead of by a search for operational synergies.
Concerning the positive effect of unrelated diversification, the context seems to provide a relevant factor that influences the relationship between unrelated diversification and value. The positive effect of unrelated diversification, similar to that found for the US (He, 2009), can be justified by the role of the internal capital market. Khanna and Palepu (1997) suggest that the benefits provided by diversification strategies which arise from the internal capital market can be even greater in the presence of significant external capital market constraints and imperfections. Consistent with this view, Khanna and Palepu (2000) found little evidence of diversification discounts in emerging countries, where external capital market constraints and imperfections are plentiful. In Italy, which has a typical bank-based financial system, inefficiency in the external financial market due to problems of asymmetric information and lack of transparency and disclosure (Bianco & Casavola, 1999) creates a beneficial role for the internal capital market in providing easy access to financial resources. The positive effect of unrelated diversification can also be motivated by the coinsurance effect and the search for tax benefits (Lewellen, 1971). Consistent with this argument, several studies (Bergh, 1997; Kim & McConnell, 1977; Menéndez-Alonso, 2003) have found that the coinsurance effect is one of the most important value-increasing sources associated with unrelated diversification. Firms that follow unrelated diversification can issue more debt and benefit from the fiscal advantages related to debt financing (Bergh, 1997). The tax liability of a diversified firm may be less than the cumulated tax liabilities of the different (single) business units. In Italy, the tax rate is very high, and as a consequence, firms try to reduce fiscal costs by conglomerating.
6ConclusionThis work provides insights into the debate over the relative contribution of related versus unrelated diversification on corporate performance. The effect of diversification on firm value has driven a mainly curvilinear relationship between diversification and firm value. An important issue arises from the results, in agreement with that suggested by Palich et al. (2000), indicating that related diversified firms may not be able to fully exploit the relatedness designed in the portfolio businesses. In this regard, Markides and Williamson (1994) suggested a “mirage effect” or an “exaggerated relatedness effect” when assessing the apparent similarity between business units, and that the expected operational synergies did not provide any benefits. In Italy, it seems that diversified firms in related businesses were not able to create value; they carried out related diversification without exploiting relatedness benefits. Relatedness does not seem to provide a superior competitive advantage over competitors. Furthermore, unrelated strategies may present some unique advantages based on financial synergies that outperform the effect of related diversified strategies. Inefficiency in the external capital market, which characterizes the Italian context, can financially constrain Italian firms. As a consequence, conglomerates provide financial support to sustain corporate growth. Thus, firms operating in countries where the financial market presents frictions and inefficiencies, as is the case in Italy, should count on unrelated diversification as a way to financially support the business. The coinsurance effect and tax benefits can also justify the positive effect of unrelated diversification on corporate value.
Therefore, the general superiority of a related strategy compared to an unrelated strategy, as suggested in the literature, was not observed in Italy. It seems that country-specific factors associated with inefficiencies in the external capital market generate superior benefits from an internal capital market. Therefore, the direction of future research based on non-US cross-country analysis seems to be promising in elucidating the controversial link between diversification and performance. Future research should be aimed at studying this relationship in more depth by using a cross-country sample, in order to determine what kind of institutional features affect the value of diversification.
| Relationship | Arguments |
|---|---|
| - Resource-based view (Markides & Williamson, 1994; Seth, 1990). - Market power effect (Palepu, 1985). - Internal capital market and coinsurance effect (He, 2009; Kuppuswamy & Villalonga, 2016; Lamont, 1997; Lewellen, 1971; Stein, 1997). | |
| - Asymmetric information costs (Williamson, 1985). - Coordination and organizational inefficiencies and costs (Berger & Ofek, 1995; Rajan et al., 2000; Scharfstein & Stein, 2000). - Agency costs (Denis et al., 1997; Fama & Jensen, 1983; Lang & Stulz, 1994). | |
| - Combination of previous effects (Hubbard & Palia, 1998; Matsusaka, 2001; Palich et al., 2000). | |
| Variables | (1) | (2) | (3) | (4) | (5) | (6) |
|---|---|---|---|---|---|---|
| ROE | ROE | ROE | ln(market value of equity) | ln(market value of equity) | ln(market value of equity) | |
| L.y | 0.444*** | 0.432*** | 0.439*** | 0.433*** | 0.437*** | 0.420*** |
| (0.000) | (0.000) | (0.000) | (0.000) | (0.000) | (0.000) | |
| DT (total diversification) | −0.118* | −0.051** | −0.232 | −1.042* | ||
| (0.062) | (0.039) | (0.208) | (0.092) | |||
| DT2 (total diversification squared) | 0.028* | 1.026* | ||||
| (0.069) | (0.060) | |||||
| DR (related diversification) | −0.042* | −0.067* | ||||
| (0.068) | (0.081) | |||||
| DU (unrelated diversification) | 0.070*** | 0.351* | ||||
| (0.008) | (0.057) | |||||
| Leverage | −0.142*** | −0.142*** | −0.133*** | −0.157*** | −0.157*** | −0.165*** |
| (0.000) | (0.003) | (0.003) | (0.000) | (0.000) | (0.000) | |
| Age | −0.020* | −0.018* | −0.017 | −0.019** | −0.020** | −0.020** |
| (0.057) | (0.075) | (0.131) | (0.036) | (0.037) | (0.026) | |
| Foreign sales | 0.003 | 0.000 | 0.000 | 0.013 | 0.014 | 0.027 |
| (0.946) | (0.995) | (0.990) | (0.737) | (0.741) | (0.450) | |
| Size | −0.013** | −0.012** | −0.010* | −0.010 | −0.009 | −0.010 |
| (0.042) | (0.034) | (0.089) | (0.127) | (0.130) | (0.111) | |
| Tangibility | 0.057 | 0.060 | 0.052 | 0.027 | 0.038 | 0.053 |
| (0.300) | (0.381) | (0.405) | (0.558) | (0.440) | (0.295) | |
| Ownership concentration | 0.025 | 0.018 | 0.029 | 0.094*** | 0.093*** | 0.100*** |
| (0.516) | (0.613) | (0.416) | (0.001) | (0.001) | (0.001) | |
| Growth opp.: sales growth | 0.025* | 0.026* | 0.032* | 0.021** | 0.019** | 0.023** |
| (0.069) | (0.067) | (0.091) | (0.043) | (0.049) | (0.026) | |
| GDP | 0.034* | 0.037** | 0.038* | −0.026 | −0.028 | −0.027* |
| (0.054) | (0.047) | (0.065) | (0.128) | (0.131) | (0.085) | |
| Constant | 0.046** | 0.048** | 0.064* | 0.186 | 0.156 | 0.143* |
| (0.028) | (0.029) | (0.067) | (0.163) | (0.181) | (0.098) | |
| AR1 | −2.39*** | −2.29** | −2.32** | −2.93*** | −2.91*** | −2.93*** |
| (0.000) | (0.022) | (0.020) | (0.003) | (0.004) | (0.003) | |
| AR2 | 0.38 | 0.28 | 0.33 | 0.20 | 0.24 | 0.30 |
| (0.706) | (0.776) | (0.745) | (0.841) | (0.798) | (0763) | |
| Hansen test | 74.26 | 70.45 | 72.08 | 67.72 | 67.65 | 64.82 |
| (0.689) | (0.691) | (0.687) | (0.696) | (0.696) | (0.698) | |
Note: (*), (**) and (***) indicates that coefficients are significant at 10, 5 and 1 percent level, respectively. The test AR2 is second order autocorrelation of residuals under the null of no serial correlation. Hansen test is test of the overidentifying restrictions, under the null of instruments’ validity.
The creation and exploitation of the internal capital market is typical of large unrelated diversified firms (Stein, 1997). While there have been opposite conclusions proposed in the literature (Lamont, 1997; Rajan et al., 2000; Scharfstein & Stein, 2000), it is the common opinion (Gertner et al., 1994; Stein, 1997; Williamson, 1985) that internal capital markets have a positive influence on the creation of firm value thanks to improved capital budgeting procedures.
- Direct and moderating effects of COVID-19 on cultural tourist satisfaction
- Destination recovery during COVID-19 in an emerging economy: Insights from Perú
- The impact of the COVID-19 crisis on consumer purchasing motivation and behavior
- Covid-19 vaccines: A model of acceptance behavior in the healthcare sector

www.publicationethics.org.